

Abstract
Background
Carbohydrate‐deficient transferrin (CDT) is used to assess chronic alcohol consumption in administrative and forensic context. The aim of the present study was the optimization of the diagnostic strategy for CDT determination in a clinical laboratory setting.
Methods
Two capillary zone electrophoresis (CZE) assays, the CEofix CDT (Analis, Suarlée, Belgium) run on single capillary MDQ instrument and the muticapillary (Sebia, Lisses, France), were compared as screening methods and a commercial high‐performance liquid chromatography (HPLC) assay (Recipe, Munich, Germany) was used for confirmation.
Results
In total, 367 serum samples were analyzed by both CZE assays with concordant classification in 92% of cases. All discordant samples were classified as negative by HPLC, as did 2/3 of those that could not be classified by either CZE assay. Classification of samples with CDT values close to cut‐off by CZE was confirmed by HPLC in 95–100% of negative samples but only in 28.6–33.3% of positive samples.
Conclusions
Both CZE assays proved suitable for CDT screening. HPLC was useful for discriminating CDT value in most of samples that could not be interpreted by CZE due to analytical interferences. Considering the implication of CDT testing, HPLC assay may also be helpful for the confirmation of positive results close to the cut‐off value of CZE assays.
Keywords: carbohydrate deficient transferrin (CDT), alcohol, capillary zone electrophoresis, HPLC, cut‐off value, clinical chemistry
INTRODUCTION
Transferrin is a glycoprotein, which consists of a polypeptide chain with two binding sites for iron and two N‐linked oligosaccharide chains. The primary structure of transferrin can differ for one or more amino acids. At least 38 genetic variants are known, but only four have a prevalence >1% 1, 2.
Each of the two oligosaccharide chains of transferrin can be bi‐, tri‐, or tetra‐antennary with a sialic acid residue at the extremity. It is well established that elevated alcohol consumption causes a relative increase of asialo‐ and disialo‐transferrin 3. Carbohydrate‐deficient transferrin (CDT), an index of transferrin isoforms with zero up to two sialic acid residues, is now widely recognized as the most valuable biomarker of sustained and repeated alcohol consumption 1, 4, 5. CDT appears as the result of an inefficient glycosylation process resulting from the toxic effect of alcohol metabolism on hepatocytes. CDT is used to monitor abstinence in chronic alcohol abusers and as a marker of temperance in driving license restitution after suspension due to positive blood alcohol levels 6, 7, 8.
CDT levels corresponding to an alcohol consumption averaging at least 50–60 g/day for more than 2 weeks are considered as CDT positive 2. When alcohol consumption is discontinued, the glycoform profile returns to normal with a half‐life of carbohydrate‐deficient isoforms of about 1.5 weeks 2, 3, 9, 10.
Capillary zone electrophoresis (CZE) and high‐performance liquid chromatography (HPLC) are the analytical methods most often employed to detect CDT in human serum. These systems separate the different transferrin isoforms and carry out their relative photometric quantification. In CZE methods, transferrin glycoforms are detected at 200 nm, which is the maximum wavelength of absorption for the peptide bond, whereas HPLC methods rely on the selective absorbance of the iron‐transferrin complex at 460 nm. For this reason, HPLC is considered less prone to analytical interferences compared to CZE 11, 12, 13, 14.
Since CDT is mainly used for forensic and administrative purposes, the reliability of analytical results represents a central issue. For this reason, confirmation of results by an alternative method, based on a different principle, is suggested in forensic toxicology laboratory guidelines 15, 16.
There are several commercial or home‐made assays for CDT determination, which are based on different analytical techniques and principles, but a universal calibrator or a reference method is not yet available. As a consequence, different decisional levels are applied according to the analytical method used for CDT determination. The need for equivalent results of routine measurements has prompted a project for the harmonization of CDT assays 17, 18.
In the present study, we compared two commercial CZE methods for CDT screening, and evaluated the optimal use of a commercial HPLC assay as a confirmatory test in a clinical laboratory processing a high number of routine samples.
MATERIALS AND METHODS
Samples and Study Design
This study was performed on 367 consecutive samples received for the routine determination of CDT. Samples were routinely analyzed by the CZE CEofix CDT assay (Analis, Suarlée, Belgium) run on P/ACE MDQ (Beckman Coulter Europe, Fullerton, CA) and were retested for comparison by the Capillarys CDT kit on the Capillarys 2 (Sebia, Lisses, France) CZE instrumentation. Samples with discordant/not interpretable results by one or both CZE methods were reanalyzed by HPLC using the ClinRep CDT Kit (Recipe, Munich, Germany) using a Prominence liquid chromatograph LC‐20AT (Shimadzu Europe, Duisburg, Germany) equipped with a UV‐visible detector (SPD‐20AV). In addition, HPLC retesting was also performed in samples with %CDT close to the cut‐off values of the two CZE methods.
The precision of CZE and HPLC methods was evaluated by monitoring three levels of CDT control materials: Level 1 and Level 2 (Eureka, Chiaravalle, Italy), which corresponded to a negative and positive CDT result, respectively, and a third material consisting of a 1:1 mix of the two controls, and corresponding to a CDT level close to the cut‐off value of each method. The study was authorized by the internal review board.
Analytical Methods
The CEofixTM CDT assay (Analis) is a single capillary electrophoresis method run on P/ACE MDQ (Beckman Coulter) that requires the predilution of serum samples (50 μl) with 150 μl of a Fe3+ solution to saturate the two iron sites. The amount of CDT is calculated as the ratio between the sum of asialo‐ and disialo‐trasferrin and the sum of all the isoforms (from asialo‐ to esasialo‐transferrin), expressed as percentage. Data are processed by the 32 Karat software (Beckman Coulter) using valley‐to‐valley integration of peak areas. The decision limit for a positive result (cut‐off) indicated by the manufacturer is 2.0%.
The CZE‐based Capillarys CDT kit is run on Capillarys 2 instrument (Sebia) that is equipped with eight capillaries and can process up to seven samples simultaneously, with a throughput of up to 38 samples every hour. Sample preparation before analysis is not required since the sample is directly processed in the primary tube and the saturation with Fe3+ is automatically performed. The CDT value is expressed as the percentage of asialo‐ and disialo‐transferrin over the sum of the glycoforms from asialo‐ to pentasialo‐transferrin. Data treatment is performed with a proprietary software and results are calculated through baseline peak integration. According to the manufacturer, CDT values >1.6% are classified as positive. When the CDT cannot be determined, samples can be retested after treatment by a specific procedure (Capillarys/Minicap CDT, Sebia) aimed at precipitating serum immunoglobulin.
HPLC analysis was performed by a Prominence liquid chromatograph LC‐20AT (Shimadzu) equipped with a UV‐visible detector (SPD‐20AV) settled at 460 nm, using the ClinRep CDT kit. The separation of transferrin isoforms is performed by an anion exchange column using a gradient as specified in the manufacturer's instructions. The kit includes a precolumn for the clean‐up of the sample interferences before column separation. Samples (100 μl) are added to vials containing Fe3+ for iron saturation and CaCl2 for lipoprotein precipitation. After incubation of samples at 4°C for 30 min and centrifugation at 10,000 × g for 5’, samples are ready for analysis and quantification by baseline peak integration using the proprietary software Clarity 4.0.4.987. CDT% is determined as the percentage of the peak areas of asialo‐ and disialo‐transferrin over the total area of all peaks from asialo‐ to pentasialo‐transferrin, and levels >2.36 are considered as positive following the manufacturer's instructions.
Statistical Analysis
Differences between groups were evaluated by the Mann–Whitney rank sum test. Correlation between variables was evaluated by the Spearman correlation coefficient. Results obtained by different methods were compared by Bland–Altman plot. All analyses were performed by the GraphPad Prism statistical software; P < 0.05 (two‐tailed) was considered significant.
RESULTS
Precision
Three decisional levels of control samples (negative, positive, and close to cut‐off value) were tested on each of the test systems. At least 20 replicates were measured in different analytical sessions and no more than five replicates of each control level were analyzed on a single day. The CV% (where CV is coefficient of variation) ranged from 1.9% for CDT‐positive sample to 5.8% for CDT‐negative sample in the MDQ CZE (Beckman Coulter), and from 4.4% to 15% in the Capillarys CZE (Sebia). The CV% of the HPLC method ranged from 7.7% to 12%. Values close to cut‐off level varied by 3.8% for the MDQ CZE, by 6.6% for the Capillarys CZE, and by 8.8% for the HPLC method (Table 1).
Table 1.
Evaluation of Precision by Replicate Analysis of Internal Quality Control Samples
| MDQ CZE | Capillarys CZE | HPLC | ||||
|---|---|---|---|---|---|---|
| Control level | Mean CDT (no. of replicates) | CV% | Mean CDT (no. of replicates) | CV% | Mean CDT (no. of replicates) | CV% |
| Negative | 1.2 (20) | 5.8 | 0.7 (147) | 15.5 | 1.4 (28) | 12.0 |
| Cut‐off | 2.3 (20) | 3.8 | 1.7 (133) | 6.6 | 2.4 (25) | 8.8 |
| Positive | 3.0 (20) | 1.9 | 2.5 (85) | 4.4 | 3.3 (28) | 7.7 |
Each level represents a different decisional level.
CZE, capillary zone electrophoresis; HPLC, high performance liquid chromatography; CDT, carbohydrate deficient transferrin; CV, coefficient of variation.
Comparison Between the CZE Methods
Overall 367 clinical samples were evaluated by both CZE methods. MDQ and Capillarys assays were able to quantify %CDT values in 348 (94.8%) and 338 (92.1%) samples, respectively. Of the 19 and 29 samples that could not be quantified by MDQ and Capillarys assays, respectively, eight were classified by both methods as genetic transferrin variants (GTVs). The remaining 21 samples not interpretable by the Capillarys assay were treated with the Capillarys/Minicap solution that allowed CDT% determination in 5/21 (23.8%). The rate of samples quantifiable by Capillarys CZE therefore increased to 343/367 (93.46%). Details of the results obtained by the two CZE methods are reported in Table 2.
Table 2.
Results Obtained in CDT Analysis by the Capillarys and the Corresponding Results by MDQ CZE Assay
| Assay/result | MDQ CZE/+ | MDQ CZE/− | MDQ CZE/NI | MDQ CZE/GTV |
|---|---|---|---|---|
| Capillarys CZE/+ | 69 | 4 | 0 | 0 |
| Capillarys CZE/− | 9 | 256 | 6 | 0 |
| Capillarys CZE/NI | 0 | 10 | 5 | 0 |
| Capillarys CZE/GTV | 0 | 0 | 0 | 8 |
NI, not interpretable; GTV, genetic transferrin variant.
The CDT% values measured by either CZE method were significantly different (Capillarys: mean 1.26 ± 2.19; MDQ: mean 2.03 ± 2.07; Mann–Whitney rank sum test, P < 0.0001). Altogether, consistent classification as CDT% positive/negative/not interpretable/transferrin variant was observed in 338 (92.1%) samples, 69 (20.41%) of which classified as positive, 256 (75.74%) as negative, 5 (1.48%) as not interpretable, and 8 (2.37%) as genetic variant.
The CDT% values obtained by the two CZE methods on 338 concordant samples were highly correlated (Spearman r: 0.936, P < 0.0001; Fig. 1A), with an average bias (Capillarys vs. MDQ) of −0.38 ± 0.61% consistent with the different cut‐off values (1.6 vs. 2.0; Fig. 1B).
Figure 1.
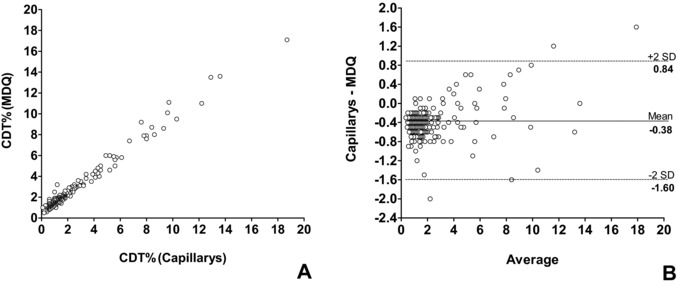
Correlation between CDT values measured by two CZE methods. (A)Spearman correlation and (B) Bland–Altman plot for serum %CDT values obtained by the Capillarys and MDQ method.
Considering mean difference ±2SD (−1.6% ± 0.84%) as a limit for acceptance, only three values fell outside this limit: two of them were highly positive by both assays, whereas one gave discordant results between the two methods (Capillarys: 1.2%; MDQ: 3.2%).
HPLC Results
Thirteen samples with discordant (positive/negative) results by the two CZE methods (Table 2) and 21 samples that were not interpretable (NI) by one 16 or by both CZE methods 5 were retested by HPLC. Among discordant samples, only one of nine positive by MDQ assay alone (CDT%: 2.2) was confirmed by HPLC, whereas all remaining samples, including four positive by Capillarys assay alone (CDT% in the range 1.7–1.8), were negative by HPLC (Table 3). The latter included the only sample with discordant results whose difference between results of each method exceeded mean bias ±2SD (see above). Moreover, CDT% could be quantified by HPLC in 14/21 NI samples (66.67%), with result below cut‐off in all cases (Table 4).
Table 3.
HPLC Results on Samples With Discordant Results by the CZE Assays
| HPLC+ (2.54) | HPLC– (1.49–2.26) | |
|---|---|---|
| MDQ+ (2.1–3.2) Capillarys− (1.2–1.6) | 1 | 8 |
| MDQ− (1.9) Capillarys+ (1.7–1.8) | 0 | 4 |
The range of CDT% values obtained by each method is shown in parentheses.
Table 4.
HPLC Results on Samples With NI Results by One or Both CZE Assays
The total number of samples is shown in parentheses.
We then evaluated the rate of confirmation by HPLC in samples with CDT% values close to the decisional cut‐off of either CZE method. For this purpose, we selected samples with CDT% levels within the range cut‐off ±2SD, using the SD value obtained after repeated testing of internal control samples close to cut‐off (Table 1). By this approach, 45 samples with CDT% in the range 1.4–1.8 (Capillarys assay) and/or 1.8–2.2 (MDQ assay) were identified. Six samples were close to cut‐off value by the Capillarys assay alone, 14 by the MDQ assay alone, and 25 by both CZE assays. Also for CDT% values close to cut‐off, the rate of confirmation by HPLC was higher (95–100%) in samples classified as negative compared to those classified as positive by CZE (28.6–33.3%) performed by Capillarys or MDQ assays, respectively (Table 5).
Table 5.
Analysis by HPLC of Samples Close to cut‐off Value by One or Both CZE Methods
It is worth noting that the rate of HPLC confirmation was 100% in ten samples strongly positive both by Capillarys (CDT% 5.2–18.7) and by MDQ assay (CDT% 4.6–17.1) as well as in 26 samples ≤1.3 by Capillarys assay (range 0.6–1.3) and in 16 samples ≤1.7 by MDQ assay (range: 1.4–1.7; data not shown).
DISCUSSION
Due to the forensic and administrative implications of CDT assays, a strict control of analytical results is mandatory. To this aim, a two‐step strategy is generally applied, consisting of screening by a high throughput, more sensitive technique, and confirmation by an assay with enhanced specificity 16. In the case of CDT determination, screening is mainly performed by CZE assays, whereas detection by HPLC, being based on the selective UV absorbance of the iron‐transferrin complex, has been suggested as a confirmatory assay 16, 19.
In a clinical setting the diagnostic strategy should be optimized in view of maximal analytical efficacy and reliability, altogether minimizing the need for unnecessary retesting due to time and cost considerations. In the present study, we compared the analytical results of two CZE methods with different degree of automation and evaluated the best strategy for HPLC result confirmation.
The rate of samples that could not be quantitated due to analytical interferences ranged from 5% (MDQ assay) to 6.5% (Capillarys assay, after the use of immunoglobulin precipitating solution). Comparative evaluation of the two CZE methods showed a high degree of concordance in result interpretation according to the respective cut‐off values. Only about 8% of samples gave discordant results, with higher frequency of MDQ+/Capillarys− (nine samples) compared to Capillarys+/MDQ− (four samples). Among interpretable results, the correlation between the two methods was good despite higher values measured by the MDQ assay.
The degree of imprecision was higher for the Capillarys assay, possibly due to additional variability linked to its multicapillary analytical principle. However, the highest difference between CV% values was observed for low CDT% concentration irrelevant for result interpretation. The variability of the HPLC method evaluated in this study was higher with respect both to single capillary and multicapillary CZE methods, for values positive or close to cut‐off.
We then analyzed the possible use of HPLC as a confirmatory assay in specific critical situations: samples with discordant results between the two CZE assays or with results that could not be interpreted due to analytical interferences. All samples with discordant results except one were classified as CDT% negative by HPLC, including the only sample that fell outside the interval of 2SD from the mean difference between methods, resulting positive (CDT = 3.2%) by the MDQ assay and negative (CDT = 1.2%) by the Capillarys assay. In addition, retesting by HPLC proved useful to assess CDT% value in two‐thirds of samples that could not be interpreted by either CZE method due to analytical interferences, with negative results in all cases. Taken together, our observations are consistent with better specificity of HPLC compared to CZE methods 16, 19, 20 that display higher frequency of false‐positive or uninterpretable results due to less selective analytical principle.
The most critical point in CDT% determination is the discrimination of positive versus negative results according to the analytical cut‐off set for each method. The administrative consequences linked to the detection of a positive result strongly suggest enhanced caution in result evaluation. Our results show that the CV% of all methods for CDT% close to cut‐off is lower than 10%. However, when samples with CDT% values within 2SD of the cut‐off by CZE were reevaluated by HPLC, most of positive results were not confirmed. By contrast, all negative results close to cut‐off except one were confirmed as negative by HPLC. It is also interesting to note that the rate of confirmation by HPLC was 100% in a limited series of samples strongly positive or negative by CZE. These findings further indicate a tendency toward false‐positive results by CZE especially in the weakly positive range, stressing the need for confirmation of these results by a more specific technique before final classification. The confirmation of CDT results by the ClinRep CDT kit used in this study is supported by a study showing its consistency with the candidate reference measurement procedure 18.
Comparable results were obtained with the two CZE methods evaluated in this study, consistent with previous reports 11, 19. Our results indicate that HPLC retesting is useful for samples with uninterpretable results by CZE, which could be quantitated in two‐thirds of cases. Concerning the need for HPLC confirmation, special attention should be paid to CDT% values close to cut‐off by CZE, and especially to weakly positive samples, that are frequently reclassified as negative by HPLC.
REFERENCES
- 1. Mårtensson O, Härlin A, Brandt R, Seppä K, Sillanaukee P. Transferrin isoform distribution: Gender and alcohol consumption. Alcohol Clin Exp Res 1997;21:1710–1715. [PubMed] [Google Scholar]
- 2. Helander A, Eriksson G, Stibler H, Jeppsson JO. Interference of transferrin isoform types with carbohydrate‐deficient transferrin quantification in the identification of alcohol abuse. Clin Chem 2001;47:1225–1233. [PubMed] [Google Scholar]
- 3. Stibler H, Kjellin K. Isoelectric focusing and electrophoresis of the CSF proteins in tremors of different origin. J Neurol Sci 1976;30:269–285. [DOI] [PubMed] [Google Scholar]
- 4. Salaspuro M. Carbohydrate‐deficient transferring as compared to other markers of alcoholism: A systematic review. Alcohol 1999;19:261–271. [DOI] [PubMed] [Google Scholar]
- 5. Niemelä O. Biomarkers in alcoholism. Clin Chim Acta 2007;377:39–49. [DOI] [PubMed] [Google Scholar]
- 6. Musshoff F. Chromatographic method for the determination of markers of chronic and acute alcohol consumption. J Chromatogr B 2002;781:457–480. [DOI] [PubMed] [Google Scholar]
- 7. Morgan MY, Major MG. The use of serum carbohydrate‐deficient transferrin in the assessment of ‘high risk offenders’ in Great Britain. Alcohol Alcohol 1996;31:625–628. [DOI] [PubMed] [Google Scholar]
- 8. Maenhout TM, Baten G, De Buyzere ML, Delanghe JR. Screening and identification carbohydrate deficient transferrin in a Driver's license regranting Program. Alcohol Alcohol 2012;47:253–260. [DOI] [PubMed] [Google Scholar]
- 9. Arndt T. Carbohydrate‐deficient transferrin a marker of chronic alcohol abuse: A critical review of preanalysis, analysis, and interpretation. Clin Chem 2001;47:13–27. [PubMed] [Google Scholar]
- 10. Jeppsson JO, Kristensson H, Fimiani C. Carbohydrate‐deficient transferrin quantified by HPLC to determine heavy consumption of alcohol. Clin Chem 1993;39:2115–2120. [PubMed] [Google Scholar]
- 11. Marti U, Joneli J, Caslavska J, Thormann W. Determination of carbohydrate‐deficient transferrin in human serum by two capillary zone electrophoresis methods and a direct immunoassay: Comparison of patient data. J Sep Sci 2008;31:3079–3087. [DOI] [PubMed] [Google Scholar]
- 12. Lanz C, Falmagne JB, de l'Escaille F, Marti U, Thormann W. Determination of carbohydrate‐deficient transferrin in human serum with capillary zone electrophoresis. Sample preparation strategies for the removal of interferences caused by increased levels of immunoglobulins. J Chromatogr A 2008;1206:33–40. [DOI] [PubMed] [Google Scholar]
- 13. Baraud J, Schellenberg F, Pages JC. Improvement of carbohydrate deficient transferrin measurement by capillary zone electrophoresis using immunosubtraction of immunoglobulins and transferrin. Ann Biol Clin 2009;67:451–455. [DOI] [PubMed] [Google Scholar]
- 14. Delanghe JR, De Buyzere ML. Carbohydrate deficient transferrin and forensic medicine. Clin Chim Acta 2009;406:1–7. [DOI] [PubMed] [Google Scholar]
- 15. Arndt T, Kropf J. Alcohol abuse and carbohydrate‐deficient transferrin analysis: Are screening and confirmatory analysis required? Clin Chem 2002;48:2072–2074. [PubMed] [Google Scholar]
- 16. Kenan N, Husand S, Helander A. Importance of HPLC confirmation of problematic carbohydrate‐deficient transferrin (CDT) results from a multicapillary electrophoresis routine method. Clin Chim Acta 2010;411:1945–1950. [DOI] [PubMed] [Google Scholar]
- 17. Weykamp C, Wielders J, Helander A, et al. Toward standardization of carbohydrate‐deficient transferrin (CDT) measurements: III. Performance of native serum and serum spiked with disialotransferrin proves that harmonization of CDT assays is possible. Clin Chem Lab Med 2013;51:991–996. [DOI] [PubMed] [Google Scholar]
- 18. Weykamp C, Wielders J, Helander A, et al. Harmonization of measurement results of the alcohol biomarker carbohydrate‐deficient transferrin by use of the toolbox of technical procedures of the international consortium for harmonization of clinical laboratory results. Clin Chem 2014;60:945–953. [DOI] [PubMed] [Google Scholar]
- 19. Bortolotti F, De Paoli G, Pascali JP, Tagliaro F. Fully automated analysis of carbohydrate‐deficient transferrin (CDT) by using a multicapillary electrophoresis system. Clin Chim Acta 2007;380:4–7. [DOI] [PubMed] [Google Scholar]
- 20. Daves M, Cemin R, Floreani M, Pusceddu I, Cosio G, Lippi G. Comparative evaluation of capillary zone electrophoresis and HPLC in the determination of carbohydrate‐deficient transferrin. Clin Chem Lab Med 2011;49:1677–1680. [DOI] [PubMed] [Google Scholar]