Abstract
Background
Alopecia areata (AA) is a common dermatological problem that manifests as sudden loss of hair without any inflammation or scarring. Various cytokines are implicated in the pathogenesis of this disease. Macrophage migration inhibitory factor (MIF) is located at an upstream position in the events leading to the possible dysregulated immuno‐inflammatory responses, and the high level of this cytokine in AA may suggest a role of MIF in the pathogenesis of AA.
Methods
This case–control study was carried out on 31 AA patients with different grades of severity and 15 apparently healthy subjects. Serum MIF level was measured by ELISA, and was correlated with the clinical severity of the disease using SALT (severity of alopecia tool) scoring system.
Results
In this study, there was a significant elevation in serum MIF levels in AA patients in comparison with controls. There was also a positive correlation between MIF levels and clinical severity and disease duration.
Conclusion
MIF seems to have an essential role in the etiopathogenesis of AA. So, it is considered to be a promising target in the therapy of autoimmune diseases and as a future predictor of alopecia activity. Anti‐MIF therapy might be added as one of the new biological treatments for AA.
Keywords: SALT score, hair loss, cytokines, autoimmune disease, dermatology
INTRODUCTION
Alopecia areata (AA) is a relatively frequent nonscarring hair loss condition with an unpredictable course. It has been accepted that its pathogenesis is multifactorial. Among the many factors that have been under investigation in the pathogenesis of AA, are genetic constitutions, as well as, nonspecific immune and organ‐specific autoimmune reactions. There are other proposed origins reported, including infectious agents and emotional stress 1, 2. Alopecia has been found to be associated with substantial psychological distress and a high prevalence of psychiatric morbidity 3.
The contribution of cytokines, thought to be involved in the pathogenesis of AA, has been studied. Interleukin (IL) 1 4, tumor necrosis factor (TNF) 5, and macrophage migration inhibitory factor (MIF) 5 might be crucial inducers of hair loss in AA.
Macrophage MIF is a pleiotropic protein, exhibiting a broad range of activities. It was originally identified as a lymphokine that prevents random migration of macrophages and recruits them at inflammatory loci 6. MIF has been found to have a role in inflammatory and autoimmune skin diseases and is also involved in fundamental events in innate and adaptive immunity 7. Therefore, it is likely that a similar mechanism takes place in AA. On the basis of the immuno‐histochemical results, it has been speculated that activated T cells might be a potential source of serum MIF. Macrophage MIF is known to stimulate the production of pro‐inflammatory cytokines such as IL‐1 and TNF‐α by macrophages and vice versa. From the data available to date, it is believed that a positive feedback loop might be the cause of the inflammatory interaction between IL‐1, TNF‐α, and MIF in this disease 8.
Our study aimed at estimating the level of serum MIF in AA patients and at determining the relationship between its level and the clinical severity of AA lesions using global AA severity score ‘‘severity of alopecia tool’’ or SALT scoring system. Our study was designed looking forward to applying the use of anti‐MIF biological therapy that might give us hope in treating this disease as well as various other autoimmune and inflammatory skin diseases 7.
MATERIALS AND METHODS
Thirty‐one Egyptians were recruited from the Dermatology Outpatient Clinic at Alexandria Main University Hospital, all suffering from various clinical presentations of AA. Fifteen healthy control subjects, matched for age and sex, were also included. Patients and healthy volunteers signed a written informed consent before participating in this study. This study received ethical approval from the Institutional Review Board at Faculty of Medicine, Alexandria University, Egypt. The identification information of all subjects included in this study was kept confidential and was protected from the public.
Thorough history taking was obtained from each patient including age of patient at onset of the disease, disease course and duration, possible precipitating factors (e.g., infection, psychic stress, and trauma), past history of autoimmune diseases (e.g., vitiligo 9, lupus erythematosus 10, rheumatoid arthritis 11, ulcerative colitis 12, diabetes mellitus 13, malignancy 14, and UV exposure 15. Also, history of other skin diseases, previous treatments, and family history of the same condition were all documented.
All patients had not used any topical or systemic therapy for at least 4 weeks prior to blood sample collection. Patients with history of systemic diseases (e.g., autoimmune diseases, malignancy, hypertension, diabetes mellitus), UV exposure, and dermatological diseases other than AA were excluded (as these are known to increase MIF level) 16.
Dermatological Examination
A global AA severity score called the SALT score was used, which is based on the combination of (i) the extent and (ii) the density of scalp hair loss. First, the scalp is divided into four quadrants (Fig. 1) and the score is determined visually by the amount of terminal hair loss in each of the four views of the scalp and adding these together with a maximum score of 100%. Further, percentage scalp hair loss is subgrouped into the following SALT subclasses: 17
Figure 1.
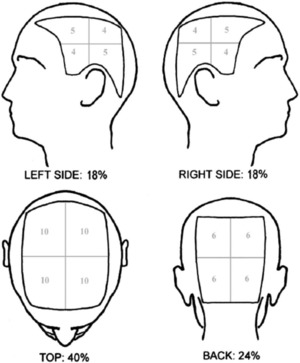
Visual aid (Olsen/Canfield) for estimating percentage scalp hair loss. Using this diagram, one can determine the percentage scalp hair loss in a given quadrant and multiply this by the total scalp area delineated by that quadrant and sum the resultant numbers for each quadrant to give the total percentage scalp hair loss 17.
S0, no hair loss; S1, <25% hair loss; S2, 25–49% hair loss; S3, 50–74% hair loss; S4, 75–99% hair loss; S5, 100% hair loss.
Accordingly, the severity of alopecia was classified into mild, moderate, and severe. SALT scores were used to subdivide the severity of AA; S1 is equivalent to mild alopecia, S2 is equivalent to moderate alopecia, while S3 to S5 (SALT score more than 50%) was defined as extensive AA 17.
Photographic Evaluation
Clear, colored, close‐up photographs were taken for every case.
Serological Evaluation
Venous blood samples (3 ml) were collected under sterile conditions from all subjects to measure serum MIF level, in Clinical Pathology Department Laboratory, by enzyme‐linked immunosorbent assay (ELISA) technique using a kit supplied by R&D systems, Inc., Minneapolis, MN 55413, USA (Quantikine Human MIF).
Sample collection and storage
Using a serum separator tube, 3 ml of blood was left to clot for 30 min at room temperature and then centrifuged for 15 min at approximately 1,000 × g to separate the serum. Serum samples were stored at −20°C until assayed.
Principle of the assay
This assay employs the quantitative sandwich enzyme immunoassay technique. A monoclonal antibody specific for MIF is precoated onto a microplate. Standards and samples are pipetted into the wells and any MIF present is bound by the immobilized antibody. After washing away any unbound substances, an enzyme‐linked polyclonal antibody specific for MIF is added to the wells. Following washing, to remove any unbound antibody‐enzyme reagent, a substrate solution is added to the wells and color develops in proportion to the amount of MIF bound in the initial step. The color development is stopped and the intensity of the color is measured. The optical density of each well was determined within 30 min, using a microplate reader set to 450/540 nm.
Data Analysis 18
The data were collected and analyzed using the statistical package for social sciences version 15 (SPSS Inc., Chicago, IL). Descriptive data were summarized using mean, standard deviation, and range for quantitative variables and using numbers and percentages for qualitative variables. Intergroup comparisons were made using the Pearson's χ2 test for qualitative variables and the independent sample t‐test for normally quantitative variables. Nonparametric tests (the Mann–Whitney and Kruskal–Wallis tests) were used for quantitative variables. Pearson's correlation coefficient (r) test was used to test for linear correlation between quantitative variables. A P ‐value of less than or equal to 0.05 was considered significant.
RESULTS
The AA patients included in our study were 18 males (58.1%) and 13 females (41.9%), while the control group included 8 males (53.3%) and 7 females (46.7%).
The mean age of patients was 28.97 years and that of controls was 26.73 years.
Positive family history was found in 7 of 31 patients (22.58%) while negative family history was found in the remaining 24 patients (77.42%).
Clinically, according to SALT score, 10 patients had mild alopecia (SALT = S1), 14 patients had moderate alopecia (SALT = S2), and 7 patients had severe alopecia (SALT = S3–S5).
As regards the serum level of MIF in the two studied groups, the results were as follows:
The mean level of MIF in AA patients was 6.532 ± 3.508 ng/ml (mean ± SD) while in the control group was 1.891 ± 0.906 (mean ± SD) ng/ml; this result was statistically significant (P = 0.046; (Table 1, Fig. 2).
Table 1.
Comparison Between Patients and Controls Regarding MIF Levels
| MIF | Mean | SD | Min. | Max. | T P |
|---|---|---|---|---|---|
| Patients | 6.535 | 3.5080 | 1.8 | 13.7 | 5.189 |
| Controls | 1.891 | 0.9063 | 0.3 | 3.5 | 0.0046* |
| Total | 5.020 | 3.6473 | 0.3 | 13.7 |
*P is significant if <0.05.
T = t test, P = p value for statistical significance.
Figure 2.
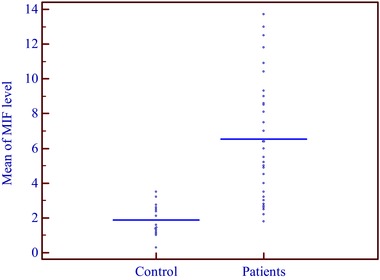
Comparison between patients and controls regarding MIF levels.
As regards the relationship between severity of AA and MIF levels, the results were as follows:
The mean MIF level was 3.560 ng/ml in mild cases, 6.374 ng/ml in moderate cases, and 11.104 ng/ml in severe cases. This means that there was a significant association between the severity of AA and serum level of MIF (P = 0.0001), that is, it was found that MIF level was much higher in severe cases than in moderate and mild cases (Table 2, Figs. 3, 4 5, 6).
Table 2.
Relationship Between MIF Levels and Severity of AA
| N | Mean | SD | Min. | Max. | F | Sig. | |
|---|---|---|---|---|---|---|---|
| Mild | 10 | 3.560 | 1.4569 | 1.8 | 6.4 | 24.523 | 0.0001* |
| Moderate | 14 | 6.374 | 2.6908 | 2.2 | 12.5 | ||
| Severe | 7 | 11.104 | 1.8681 | 8.6 | 13.7 | ||
| Total | 31 | 6.535 | 3.5080 | 1.8 | 13.7 |
*P is significant if <0.05.
Figure 3.
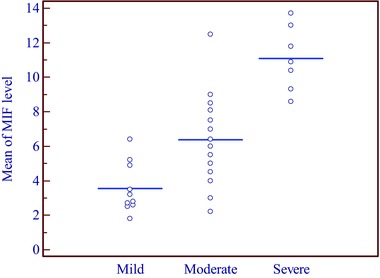
Relationship between MIF levels and severity of AA.
Figure 4.
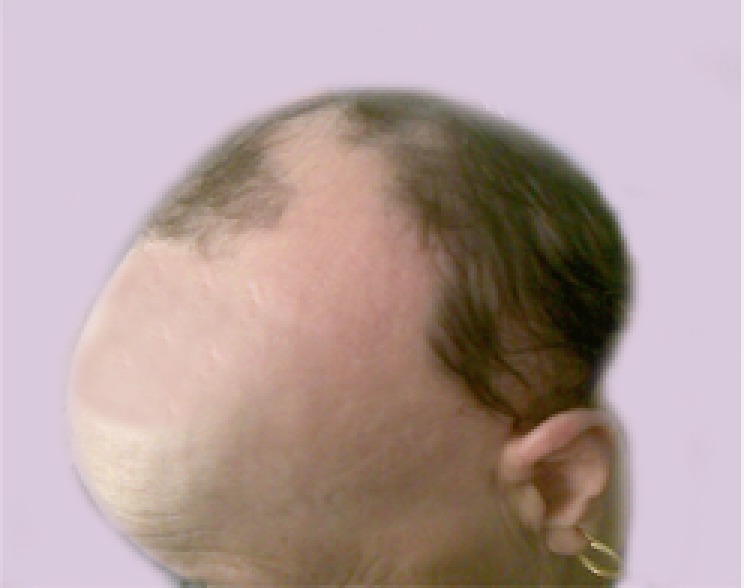
A case of severe AA with MIF level of 13.17 ng/ml.
Figure 5.
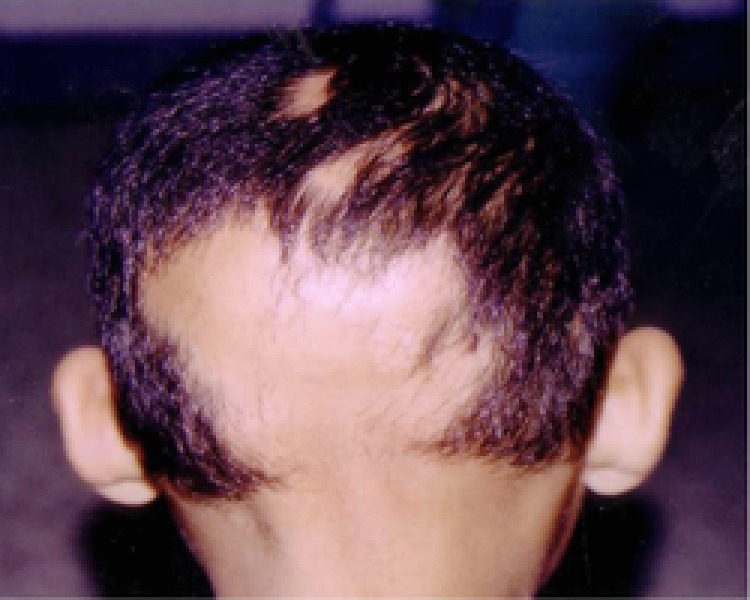
A Case of moderate AA in a child with MIF level of 12.5 ng/ml.
Figure 6.
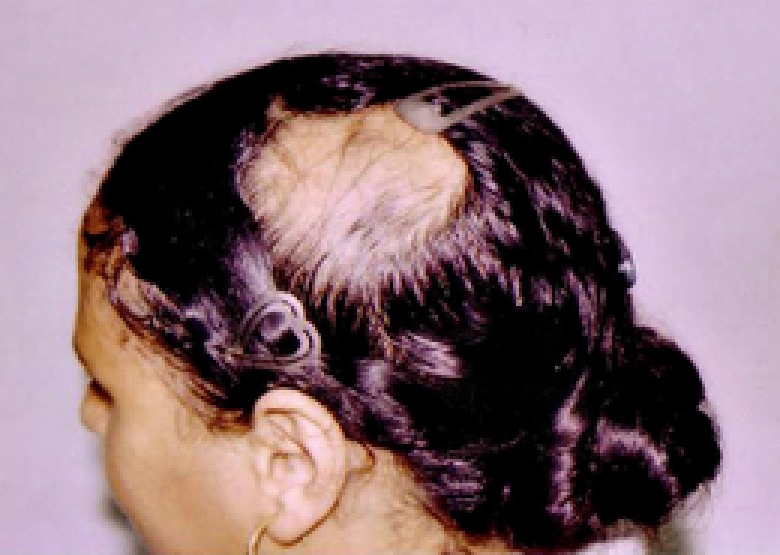
A Case of mild AA with MIF level of 2.6 ng/ml.
As regards the correlation between MIF levels and age, sex, family history, and duration of the disease in patients and controls, the results were as follows:
It was found that there was a negative correlation (Pearson correlation = −0.365) between MIF levels and the age of patients, that is, the younger the age, the higher the MIF level (P = 0.0374). There was nonsignificant statistical correlation between mean serum MIF level and the age of control subjects (P > 0.05).
There was no significant relationship between the sex of patients and MIF levels (P > 0.05), as the mean MIF level in males was 7.109 ng/ml and the mean MIF level in females was 5.738 ng/ml.
Also, there was no significant correlation between MIF levels and positive family history of patients.
On the other hand, there was a positive correlation (Pearson correlation = 0.364) between MIF levels and the duration of alopecia, that is, the longer the duration of the disease, the higher the MIF levels (P = 0.042).
DISCUSSION
AA is considered to be a T‐cell‐mediated autoimmune disease involving the hair follicle, which is characterized by peribulbar infiltration by activated T cells. It is speculated that MIF in inflammatory diseases may be produced by multiple cellular sources such as activated T lymphocytes and monocytes 19.
The results of our case–control study demonstrate that the mean serum level of MIF was significantly higher in patients (with a mean value of 6.535 ng/ml) than in controls (with a mean value of 1.891 ng/ml), which may suggest a role of MIF in the etiopathogenesis of AA. This finding was in agreement with that of Shimizu et al. 20, who performed a study on 38 patients with AA with variable degrees of severity and found that the mean serum level of MIF was significantly higher in AA patients than in healthy control subjects. Extending their research on tissues, other than serum, they also reported that immuno‐histochemical studies using anti‐MIF antibodies were positive in perifollicular‐infiltrated lymphocytes of telogen hair follicles in patients with extensive AA. On the basis of their results, they speculated that activated T cells might be a potential source of serum MIF.
In a following study by Shimizu et al. 21, they demonstrated that MIF gene promoter polymorphisms contribute to the risk of more extensive forms of AA especially with an early onset of disease. As AA is considered as one of the autoimmune diseases, the results of this study come in agreement with similar studies performed on other autoimmune diseases that confirm this concept. For example, Serarslan et al. 10 found that the mean serum level of MIF was significantly higher in vitiligo patients than in healthy control subjects. Moreover, Namazi et al. 22 found that the mean MIF level in patients with pemphigus vulgaris is significantly higher than that in control subjects. Asano et al. 23 also found that mean MIF level in patients with bullous pemphegoid is significantly higher than that in controls. Also, Foote et al. 24 found that serum MIF concentrations in patients with SLE were significantly higher than in controls. Hoi et al. 25 reported that serum concentrations of MIF in patients with the diffuse form of systemic sclerosis are significantly higher than in controls, suggesting that MIF may be involved in the amplifying pro‐inflammatory loop leading to sclerodermatous tissue remodeling. The study done by Shimizu et al. 26 revealed elevated serum MIF levels in patients with psoriasis vulgaris than in healthy controls.
Regarding the mean serum MIF level in the different clinical presentations of AA in this study, SALT scores were used to subdivide the severity of AA into mild (SALT <25%), moderate (SALT = 25–49%), and severe (SALT>50%) and we found significantly higher serum MIF levels in extensive AA than in other clinical presentations of the disease (i.e., mild and moderate). This means that serum MIF level increases with increasing severity of AA, which may suggest that MIF has a role in the severity or chronicity of the disease. These results were similar to that of Shimizu et al. 20, who demonstrated that the mean levels of serum MIF were significantly elevated in patients with extensive AA than in those with moderate and mild cases.
In this study, a correlation between gender and MIF levels in AA patients and in control subjects was performed, but showed no significant changes in the mean serum MIF level between males and females. This comes in agreement with other studies that could not find any correlation between gender and MIF serum levels in AA patients; however, this correlation was positive in other studies. Among such studies, Aloisi et al. 27, who performed their research on the plasma levels of MIF and several hormones (cortisol, estradiol, and testosterone) to evaluate their mutual behavior in control subjects and in chronic pain patients, reported that MIF levels were significantly higher in males than in females. Although many hypotheses can be advanced to explain the higher MIF levels in younger men, the positive correlation between MIF plasma levels and testosterone suggests that MIF levels are modulated directly and/or indirectly by testosterone. This interaction is also supported by the finding of MIF expression in testosterone‐sensitive organs, including the prostate and testes.
Also, in this study, there was significant increase in MIF levels in young patients than in older ones. This was in accordance with Shimizu et al. 21 who demonstrated that MIF gene promoter polymorphisms contribute to the risk of early‐onset forms of AA (less than 20 years). There was also a positive correlation between the duration of AA and MIF levels, that is, the longer the disease duration, the higher the MIF levels.
In our study, 22.6% of the patients had a positive family history of AA defined by the affection of at least one first‐degree relative. Controversial studies exist concerning the possible influence of familiarity on age of onset and severity of the disease 28. However, in our study, we could not detect such an influence. The age of onset, MIF levels, and severity of the disease were all similar in patients with or without a positive family history.
A familial occurrence of AA has been previously reported. This includes the study of Blaumeiser et al. 29 in which the pattern of familial aggregation of AA was assessed by the affection status of patients’ relatives and it was found that 21.8% of the patients had a positive family history of AA. The frequency of AA was greatest in parents (7.4%), followed by siblings (5.5%) and children (2.3%). A positive family history was noted in 34% of patients when information on second‐degree relatives was included.
In conclusion, MIF seems to have an essential role in the etiopathogenesis of autoimmune skin diseases including AA. So it is considered to be a promising target in treating autoimmune diseases as MIF was the only cytokine that counteracts the glucocorticoid‐mediated inhibition of pro‐inflammatory cytokines. Therefore, this may be the critical factor limiting the immunosuppressive effects of glucocorticoid therapy in treatment of autoimmune diseases. In fact, several pharmaceutical companies have already followed different strategies in the development of MIF‐blocking reagents in the treatment of immuno‐inflammatory diseases. So, we can use MIF as a predictor of future alopecia activity and anti‐MIF therapy could be added as one of the new biological treatments for AA. Further understanding of the function and regulation of MIF promises to be of great value for the introduction of new therapeutic approaches for some dermatologic and nondermatologic diseases.
CONFLICT OF INTEREST
The authors have nothing to disclose and declare no conflict of interest, whether personal or financial.
ACKNOWLEDGMENT
This research was completely funded by the authors.
REFERENCES
- 1. Martinez‐Mir A, Zlotogorski A, Gordon D, et al. Genome wide scan for linkage reveals evidence of several susceptibility loci for alopecia areata. Am J Hum Genet 2007;80:316–328. [DOI] [PMC free article] [PubMed] [Google Scholar]
- 2. Rodriguez TA, Duvic M. National alopecia areata registry: Onset of alopecia areata after Epstein‐Barr virus infectious mononucleosis. J Am Acad Dermatol 2008;59:137–139. [DOI] [PubMed] [Google Scholar]
- 3. Okamoto M, Ogawa Y, Watanabe A, et al. Autoantibodies to DFS70/LEDGF are increased in alopecia areata patients. J Autoimmun 2004;23:257–266. [DOI] [PubMed] [Google Scholar]
- 4. Hoffmann R. The potential role of cytokines and T cells in alopecia areata. J Inv Dermatol Symp Proc 1999;4(3):235–238. [DOI] [PubMed] [Google Scholar]
- 5. Teraki Y, Imanishi K, Shiohara T. Cytokines in alopecia areata: Contrasting cytokine orofiles in localized form and extensive form (alopecia universalis). Acta Derm Venereol 1996;76:421–423. [DOI] [PubMed] [Google Scholar]
- 6. Shimizu T, Abe R, Nakamura H, Ohkawara A, Suzuki M, Nishihira J. High expression of macrophage migration inhibitory factor in human melanoma cells and its role in tumor cell growth and angiogenesis. Biochem Biophys Res Commun 1999;264:751–758. [DOI] [PubMed] [Google Scholar]
- 7. Stosic‐Grujicic S, Stojanovic I, Nicoletti F. MIF in autoimmunity and novel therapeutic approaches. Autoimmun Rev 2009;8:244–249. [DOI] [PubMed] [Google Scholar]
- 8. Shimizu T. Role of macrophage migration inhibitory (MIF) factor in the skin. J Dermatol Sci 2005;37:65–73. [DOI] [PubMed] [Google Scholar]
- 9. Serarslan G, Yönden Z, Söğüt S, Savaş N, Celik E, Arpaci A. Macrophage migration inhibitory factor in patients with vitiligo and relationship between duration and clinical type of disease. Clin Exp Dermatol 2010;35:487–490 [DOI] [PubMed] [Google Scholar]
- 10. Foote A, Briganti EM, Kipen Y, Santos L, Leech M, Morand EF. Macrophage migration inhibitory factor in systemic lupus erythematosus. J Rheumatol 2004;31:268–273. [PubMed] [Google Scholar]
- 11. Kim HR, Park MK, Cho ML, et al. Macrophage migration inhibitory factor upregulates angiogenic factors and correlates with clinical measures in rheumatoid arthritis. J Rheumatol 2007;34:927–936. [PubMed] [Google Scholar]
- 12. Nishihira J, Mitsuyama K. Overview of the role of macrophage migration inhibitory factor in inflammatory bowel disease. Curr Pharm Des 2009;15:2104–2109. [DOI] [PubMed] [Google Scholar]
- 13. Stosic‐Grujicic S, Stojanovic I, Maksimovic‐Ivanic D, et al. Macrophage migration inhibitory factor is necessary for progression of autoimmune diabetes mellitus. J Cell Physiol 2008;215:665–675. [DOI] [PubMed] [Google Scholar]
- 14. Repp AC, Mayhew ES, Apte S, Niederkorn JY. Human uveal melanoma cells produce macrophage migration‐inhibitory factor to prevent lysis by NK cells. J Immunol 2000;165:710–715. [DOI] [PubMed] [Google Scholar]
- 15. Shimizu T, Abe R, Ohkawara A, Nishihira J. Ultraviolet B radiation up‐regulates the production of macrophage migration inhibitory factor (MIF) in human epidermal keratinocytes. J Invest Dermatol 1999;112:210–215. [DOI] [PubMed] [Google Scholar]
- 16. Lolis E, Bucala R. Macrophage migration inhibitory factor. Expert Opin Ther Targets 2003;7:153–164. [DOI] [PubMed] [Google Scholar]
- 17. Olsen EA, Hordinsky MK, Price VH, et al. National Alopecia Areata Foundation: Alopecia areata investigational assessment guidelines Part II. J Am Acad Dermatol 2004;51:440–447. [DOI] [PubMed] [Google Scholar]
- 18. Kotz S, Balakrishnan N, Read CB, Vidakovic B. Encyclopedia of Statistical Sciences, second edition, Hoboken, New York: Wiley‐Interscience, Inc; 2006. [Google Scholar]
- 19. Bodemer C, Peuchmaur M, Fraitaig S, Chatenoud L, Brousse N, de Prost Y. Role of cytotoxic T cells in chronic alopecia areata. J Invest Dermatol 2000;114:112–116. [DOI] [PubMed] [Google Scholar]
- 20. Shimizu T, Mizue Y, Abe R, Watanabe H, Shimizu H. Increased macrophage migration inhibitory factor (MIF) in sera of patients with extensive alopecia areata. J Invest Dermatol 2002;118:555–557. [DOI] [PubMed] [Google Scholar]
- 21. Shimizu T, Hizawa N, Honda A, et al. Promoter region polymorphism of macrophage migration inhibitory factor is string risk factor for young onset of extensive alopecia areata. Genes Immun 2005;6:285–289. [DOI] [PubMed] [Google Scholar]
- 22. Namazi MR, Fallahzadeh MK, Shaghelani H, Kamali‐Sarvestani E. Marked elevation of serum MIF Levels in patients with pemphigus vulgaris. Int J Dermatol 2010;49:146–148. [DOI] [PubMed] [Google Scholar]
- 23. Asano Y, Makino T, Norisugi O, et al. Macrophage migration inhibitory factor in bullus pemphegoid. J Dermatol Sci 2008;49:95–97. [DOI] [PubMed] [Google Scholar]
- 24. Foote A, Briganti EM, Kipen Y, Santos L, Leech M, Morand EF. Macrophage migration inhibitory factor in systemic lupus erythematosus. J Rheumatol 2004;31:268–273. [PubMed] [Google Scholar]
- 25. Hoi AY, Hickey MJ, Hall P, et al. Macrophage migration inhibitory factor deficiency attenuates macrophage recruitment, glomerulonephritis, and lethality in MRL/lpr mice. J Immunol 2006;177(8):5687–5696. [DOI] [PubMed] [Google Scholar]
- 26. Shimizu T, Nishihira J, Mizue Y, et al. High macrophage migration inhibitory factor (MIF) serum levels associated with extended psoriasis. J Invest Dermatol 2001;116:989–990. [DOI] [PubMed] [Google Scholar]
- 27. Aloisi AM, Pari G, Ceccarelli I, et al. Gender‐related effects of chronic non‐malignant pain and opioid therapy on plasma levels of macrophage migration inhibitory factor (MIF). IASP 2005;115:142–151. [DOI] [PubMed] [Google Scholar]
- 28. Yang S, Yang J, Liu JB, et al. The genetic epidemiology of alopecia areata in China. Br J Dermatol 2004;151:16–23. [DOI] [PubMed] [Google Scholar]
- 29. Blaumeiser B, van der Goot I, Fimmers R, et al. Familial aggregation of alopecia areata. J Am Acad Dermatol 2006;54:627–632. [DOI] [PubMed] [Google Scholar]


