

Abstract
Background
Selenoprotein P (SeP), a selenium‐rich extracellular glycoprotein, is the primary selenoprotein in the plasma. SeP plays an important role in the maintenance of selenium levels in the peripheral tissues. We developed a new sol particle homogeneous immunoassay (SPIA) for measuring full‐length SeP (FL‐SeP) levels in the human serum.
Methods
We used colloidal gold particles coated with two types of anti‐SeP monoclonal antibodies, one recognizing the N‐terminal side domain of SeP and the other recognizing the C‐terminal side domain.
Results
The assay range was 0.2–9 mg/l, and the linearity was excellent. The within‐day and between‐day coefficients of variation ranged from 0.73% to 2.24% and 0.45% to 1.11%, respectively. Serum samples (n = 200) were examined using the newly developed assay system (employing a Model 7070 Hitachi automatic clinical analyzer) and the conventional enzyme‐linked immunosorbent assay. These two methods were compared using the Passing–Bablok regression analysis; the resulting regression equation and correlation coefficient were y = 0.940x + 0.165 and r = 0.954, respectively.
Conclusions
Our new SPIA assay is a fully automated homogeneous immunoassay that can be used in conjunction with various commercial analyzers. The assay was sensitive, precise, and suitable for clinical measurement of the FL‐SeP in the human serum.
Keywords: colloidal gold, diabetes, homogeneous immunoassay, metformin, selenoprotein P
INTRODUCTION
Selenoprotein P (SeP) is a selenium‐rich extracellular glycoprotein primarily produced by the liver 1, 2. It contains ten selenocysteine (Sec) residues and is a major selenoprotein in the plasma 3. It has been reported that SeP has two kallikrein cutting sites close to its central part. Therefore, both the N‐terminal (SeP‐NF) and C‐terminal fragments (SeP‐CF) can be generated from full‐length SeP (FL‐SeP) by the proteolysis of plasma kallikrein (Fig. 1) 4. SeP catalyzes the reduction of phosphatidylcholine hydroperoxide by glutathione or thioredoxin, acts as a peroxynitrite scavenger 4, 5, 6, and delivers hepatic selenium to the target tissues 3, 7. SeP‐NF is responsible for the enzymatic activity of this protein, while SeP‐CF, which contains nine Sec residues, functions as a selenium supplier 4.
Figure 1.
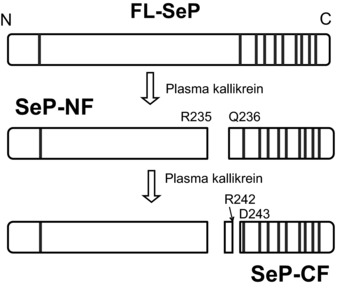
Limited proteolysis of full‐length selenoprotein P (FL‐SeP) by plasma kallikrein. Two main kallikrein‐cleaved fragments, N‐terminal fragment of SeP (SeP‐NF) and C‐terminal fragment of SeP (SeP‐CF), are generated by the the kallikrein. Individual amino acid residues are labeled with their position and single‐letter code. Vertical lines represent selenocysteine (Sec) residue.
Recently, several groups have reported the clinical importance of measuring SeP levels. Decrease in the serum SeP level has been reported in patients with prostate cancer 8 and sepsis 9, 10. It has also been reported that high tumor grades and tumor stage of patients with renal cell cancer correlate with low SeP levels 11. Elevation of the serum SeP level has been reported in patients with dysregulated glucose metabolism 12, 13, 14.
Several different assays for measuring the serum SeP level, including enzyme‐linked immunosorbent assay (ELISA), have been developed. However, most of them are time‐consuming and inconvenient for clinical use 10, 15. Furthermore, because antibodies used in these assay systems recognize SeP‐NF, the assays will capture not only FL‐SeP but also SeP‐NF. Moreover, rapid homogeneous immunoassays for measuring the serum SeP level are not available. In the present study, we developed a novel assay system for measuring the serum SeP level, which determines only the FL‐SeP levels; this method can be used with various clinical analyzers. The procedure is based on the sol particle homogeneous immunoassay (SPIA) 16, 17, 18, 19. We demonstrated the sensitivity and precision of the novel SPIA system described, and the possible applications of this method to analyze clinical samples. We also examined the differences between this system and the ELISA system.
MATERIALS AND METHODS
Reagents
Antibody preparation
Three monoclonal anti‐SeP antibodies (AH5, BD3, and AA3) were used in this study. AH5 and BD3 recognize SeP‐NF, whereas AA3 recognizes SeP‐CF. The antibodies were prepared as previously described 15.
SeP purification
Pooled human serum was purchased from Nippon Bio‐Supply Center (Tokyo, Japan). The serum was treated with polyethylene glycol, and SeP was purified using the heparin–sepharose, Q‐sepharose, and Ni‐NTA agarose columns as previously described 5. For further study, salts used for elution were removed by passing the sample through the PD‐10 gel filtration column equilibrated with the desired buffer. The concentration of the purified SeP was determined using molar extinction coefficient (A280) for human SeP (32,000 M−1 cm−1), and its molecular weight (41 kDa) was calculated for the total number of amino acids 5. Approximately 1 mg of purified SeP was obtained from 4 l of the human serum. We confirmed that the purified SeP contained <3% of free SeP‐NF or SeP‐CF fragments using sodium dodecyl sulfate–polyacrylamide gel electrophoresis (SDS–PAGE) and Western blot analysis. In addition, the SDS‐PAGE analysis showed that the purified SeP 5 presented a high level of purification (>95%).
Antibody‐coated colloidal gold particle solution
Colloidal particles were prepared as previously described 20. These particles were coated with AH5 and AA3 by incubating the particle‐containing solution with monoclonal anti‐SeP antibody (final concentration of 5 mg/l) for 2 h at 4°C. Bovine serum albumin (BSA, Oriental Yeast, Tokyo, Japan) was then added to a final concentration of 0.5 g/l and incubated overnight at 4°C. The solution of coated particles was centrifuged at 12,000 × g for 40 min. The pellet was resuspended in the 2‐[4‐(2‐hydroxyethyl)‐1‐piprazinyl]ethanesulfonic acid (HEPES, Dojijn Laboratories, Kumamoto, Japan) buffer (5 mM, pH 7.5) containing 1 g/l BSA and 30 g/l mannitol, and adjusted with the same buffer solution (HEPES containing 1 g/l BSA, 30 g/l mannitol) to A 540nm = 7.5. Equivalent amounts of AH5‐ and AA3‐coated colloidal gold particle solutions were mixed, and the mixture was used in the assays.
Reaction buffer
Tris(hydroxymethyl)aminomethane buffer (Tris‐buffer, 0.25 M; pH 7.8) containing 50 g/l NaCl, 23 g/l polyethylene glycol 20,000, 2 g/l ethylenediaminetetraacetic acid disodium salt (EDTA 2Na), 3.4 g/l gamma‐butyrolactone, 2 g/l dodecyl(sulfonatophenoxy)benzenesulfonate (Pelex SS‐H, Kao Corporation, Tokyo, Japan), and 3.5 g/l polyoxyethylene lauryl ether (Brij 35, Nacalai Tesque, Kyoto, Japan) was used as the reaction buffer.
Calibrators
HEPES buffer (10 mM, pH 7.4) containing 30 g/l BSA was used for sample dilution and the zero‐standard solution of our assay. Purified human SeP was dissolved in the same diluent to prepare solutions with different standard SeP levels (0.75, 1.50, 3.00, 6.00, and 9.00 mg/l).
Instrument
All analyses were performed on a Model 7070 Hitachi automatic clinical analyzer (Hitachi, Tokyo, Japan).
Assay Procedure
The following protocol was used for routine serum FL‐SeP assay on the Model 7070 Hitachi automatic clinical analyzer. An aliquot of the sample (0.003 ml) was pipetted into a cuvette, followed by 0.170 ml of reaction buffer. After 5 min at 37°C, 0.085 ml of a mixture of colloidal gold particles coated with AH5 and AA3 was added and mixed. The reaction between the particles and FL‐SeP in the samples caused the formation of agglutinates and a concomitant change in absorbance signal (Fig. 2). The absorbance values at 660 nm and 505 nm (as secondary and primary wavelengths, respectively) were measured for 5 min immediately after the agglutination reaction started. We calculated the differences between initial absorbance and the absorbance 5 min after the initiation of the reaction. The variation in the level of absorbance measured depended on the concentration of FL‐SeP. A standard curve for FL‐SeP was calculated using the spline program of a Model 7070 Hitachi automatic clinical analyzer. The concentration of FL‐SeP in the sample was subsequently determined by comparing the absorbance obtained with the standard curve.
Figure 2.
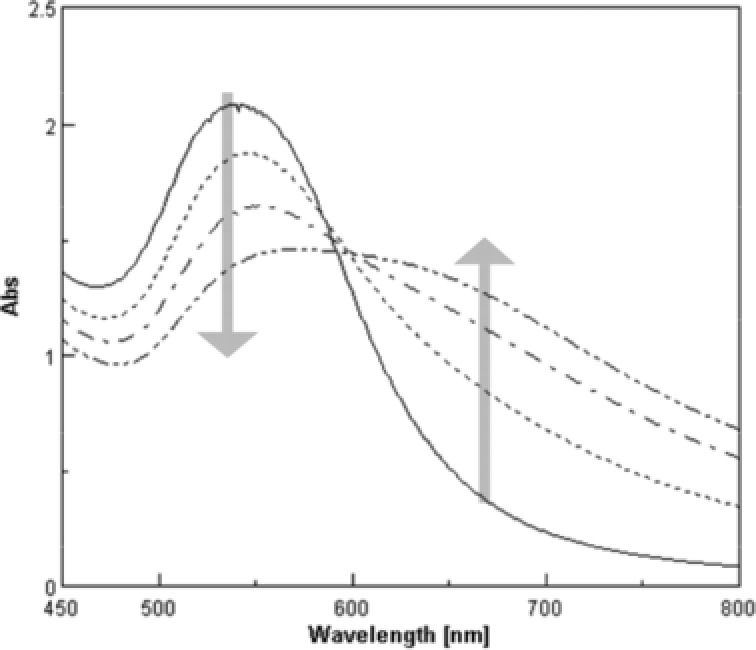
Typical absorbance spectrum changes of colloidal gold in the agglutination reaction. Absorbance spectra of samples with various concentrations of full‐length selenoprotein P (FL‐SeP) (0, 2.5, 5.0, and 10.0 mg/l) were measured 10 min after the start of the agglutination reaction. As the formation of agglutinates increases with the amount of analyte, the peak around 540 nm decreases and the absorbance around 660 nm increases.
In this assay, SeP‐NF and SeP‐CF, generated through the proteolysis of FL‐SeP mediated by plasma kallikrein, do not lead to the agglutination of the colloidal gold particles because each of these molecules only presents one binding site for the antibody coated by colloidal gold particles. In this regard, only FL‐SeP can cause agglutination and can be measured in this assay, because it presents both AH5 and AA3 binding sites.
Assay Validation
Limit of blank (LoB) and limit of detection (LoD)
Six lots of the zero‐standard solution were assayed to evaluate LoB of our assay. Following the CLSI EP17 protocol 21, the 60 measurement values (5 operating days with duplicates used in each run) were used to calculate the LoB.
Six samples with low concentrations of purified SeP were prepared by diluting the lowest calibrator concentration with the zero‐standard solution. The samples were assayed to evaluate the LoD of our assay (total, n = 60; six samples, 5 days with duplicates used in each run). The LoB was calculated using the following equation:
The upper limit of the assay
Purified SeP was added to serum pools to prepare samples containing high SeP levels (2.5–50 mg/l). Those samples were assayed to establish the upper limit for measuring the SeP levels.
Linearity
A solution containing SeP at a concentration close to the LoD was prepared by adding purified SeP to the sample diluent. The serum sample containing SeP (15 mg/l), which was prepared by adding purified SeP to serum pools, was diluted with the sample diluent and assayed in triplicate. The linearity of the assay was examined following CLSI EP6‐A procedures 22.
Recovery
A solution containing SeP (10 mg/l) was prepared by adding purified SeP to the sample diluent. One volume of the solution and nine volumes of the serum samples were mixed. These samples were assayed in triplicate, and the mean values were used for calculations of recovery.
Precision
Four serum samples with SeP levels in the range of 1.43–7.26 mg/l were assayed to evaluate the precision of our assay. In accordance with CLSI EP5‐A guidelines 23, our assay covered 20 operating days with duplicates in each run and two separate runs per day. All serum samples were stored at −40°C during the study.
Interference
To examine the potential interference of bilirubin (up to 200 mg/l), hemoglobin (up to 5 g/l), chyle [up to 2,500 formazin turbidity units (FTU)], and rheumatoid factor (up to 1,000 IU/ml), Interference Check‐A Plus kits and RF Plus kits (both from Sysmex Corporation, Tokyo, Japan) were used. Except for the rheumatoid factor, each series of test samples was prepared by adding one volume of concentrated solution of these interferents to nine volumes of serum sample.
To prepare the rheumatoid factor samples, freeze‐dried rheumatoid factor and sample blank were serially diluted with the serum samples, according to the RF Plus kit instructions, and a series of test samples was prepared by diluting the blank sample. Interference was evaluated according to the JJCLA protocol 24.
The main anticoagulants trisodium citrate, sodium heparin, EDTA 2Na, and sodium fluoride were added to a pooled serum at a final concentration of 20 mg/ml, 100 units/ml, 2 mg/ml, and 4 mg/ml, respectively. A pooled serum without anticoagulants was used as a control sample. The samples containing the anticoagulants and the control sample were analyzed in triplicate, and the mean values were used to further examine the influence of anticoagulants in the accuracy of this method.
Comparison with ELISA
Series of samples containing kallikrein‐cleaved fragments at various ratios and human serum samples were used in the comparison study.
The sample series containing kallikrein‐cleaved fragments.
Kallikrein‐cleaved samples were prepared by treating the purified FL‐SeP with human plasma kallikrein (Calbiochem, La Jolla, CA) [kallikrein:SeP = 1:5(w/w)] overnight at 37°C. Limited proteolysis of FL‐SeP by kallikrein was confirmed by SDS–PAGE (or Western blotting). The control FL‐SeP sample was prepared by incubating FL‐SeP in the absence of kallikrein overnight at 37°C. The control FL‐SeP sample was mixed with kallikrein‐cleaved samples to prepare a series of samples with various ratios of FL‐SeP and kallikrein‐cleaved fragments. In this experiment, the total amount of SeP in the samples was adjusted to the same level.
Human serum samples.
Serum samples were obtained from 200 healthy volunteers who underwent a complete physical examination in the Public Central Hospital of Matto, Ishikawa in 2008. Following an overnight fast, venous blood samples were obtained from each volunteer. All volunteers provided written informed consent for participation in this study. All experimental protocols were approved by the relevant ethics committees in Kanazawa University and Matto Ishikawa Central Hospital and were conducted in accordance with the Declaration of Helsinki.
We used the sample series containing kallikrein‐cleaved fragments to examine the effect of these fragments on our assay system. The effect of the kallikrein‐cleaved fragments was also evaluated in the sandwich ELISA system using the same antibodies. The human serum samples were used to study the correlation between our assay and ELISA for FL‐SeP. The correlation between FL‐SeP and Total‐SeP was examined by comparing the results obtained using two ELISA systems described below. The ELISA procedure was the same as a previous method 15 except a primary antibody.
ELISA for measuring FL‐SeP.
The ELISA for FL‐SeP was conducted using AA3 and AH5 as the primary and secondary antibodies. The AA3 antibody recognizes SeP‐CF, whereas the AH5 antibody recognizes SeP‐NF. The horseradish peroxidase conjugated AH5 antibody was used for detection. Using this antibody combination, only the FL‐SeP levels can be measured.
ELISA for measuring Total‐SeP.
ELISA for total‐SeP measurements was conducted using BD3 and AH5 as the primary and secondary antibodies. Both BD3 and AH5 antibodies recognize SeP‐NF. Using this antibody combination, both FL‐SeP and SeP‐NF levels are measured.
Statistical Analysis
Mean, coefficient of variation (CV), and correlation coefficients were calculated using Excel 2007 (Microsoft, Inc., Tokyo, Japan). The different measuring methods were compared using the Passing–Bablok regression analysis.
RESULTS
The Calibration Curve
The calibration curve for FL‐SeP in the range of 0–9 mg/l is shown in Figure 3.
Figure 3.
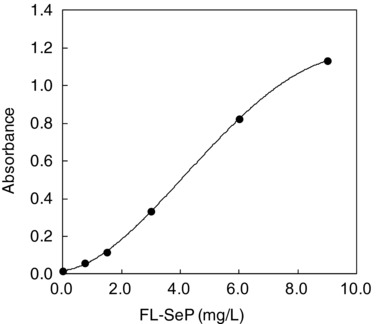
Calibration curve for determination of full‐length selenoprotein P (FL‐SeP) concentration. The absolute values of absorbance changes (the beginning of the reaction vs. end of the reaction at 505/660 nm) for six different known concentrations of FL‐SeP (0, 0.75, 1.5, 3.0, 6.0 and 9.0 mg/l) were measured on a Model 7070 Hitachi automatic clinical analyzer. Those measured values were plotted against FL‐SeP concentration.
The Measuring Range
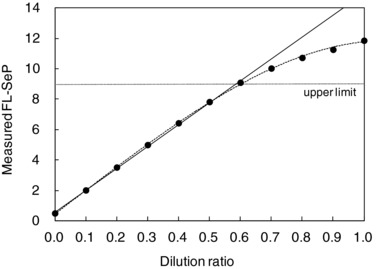
The values estimated for LoB and LoD were 0.150 and 0.197, respectively. The detection limit was estimated to be 0.2 mg/l (which by definition was higher than LoB). The measured FL‐SeP values agreed with the expected values until approximately 9.5 mg/l, when they began to diverge (Fig. 4). The Hock effect, in which excess antigen inhibits the agglutination reaction, was not apparent until a very high FL‐SeP concentration (50 mg/l). Therefore, we determined that the measurable concentration range for FL‐SeP levels was 0.2–9 mg/l.
Figure 4.
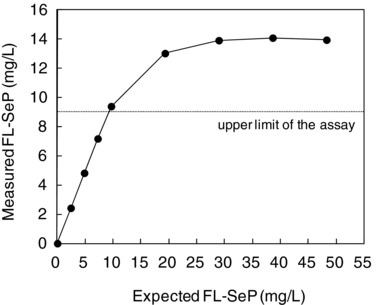
Upper detection limit. Serum samples containing various amounts of antigen (from normal to excessive, up to 50 mg/l) were assayed, and the upper limit was determined. Measured full‐length selenoprotein P (FL‐SeP) concentration (mg/l) was plotted against the expected FL‐SeP concentration.
Linearity
The assay showed strong correlation between the theoretical and obtained values in the measurable range (Fig. 5). In this range, the difference between the theoretical and obtained values was ≤3% of the total theoretical value at each dilution point.
Figure 5.
Serum sample containing about 15 mg/l of full‐length selenoprotein P (FL‐SeP) was diluted with sample diluent in 10 stages. The linearity curves (…) were constructed by plotting the measured FL‐SeP (mg/l; mean value of triplicates) on the y‐axis vs. dilution ratio on the x‐axis. The regression line (—) was constructed by the linear regression analysis of seven dilution ratios between 0.0 and 0.6.
Precision
Within‐day and between‐day CV values varied from 0.73% to 2.24% and 0.45% to 1.11%, respectively, at FL‐SeP levels of 1.45–7.26 mg/l (Table 1).
Table 1.
Precision of the Assay
| Within‐day | Between‐day | |||
|---|---|---|---|---|
| Mean (mg/l) | SD (mg/l) | CV (%) | SD (mg/l) | CV (%) |
| 1.43 | 0.032 | 2.24 | 0.015 | 1.02 |
| 2.81 | 0.021 | 0.73 | 0.015 | 0.54 |
| 4.85 | 0.037 | 0.75 | 0.021 | 0.45 |
| 7.26 | 0.088 | 1.21 | 0.080 | 1.11 |
Recovery
The analytical recovery was 92–102% (Table 2).
Table 2.
Analytical Recovery
| Initial | Added | Measured | Recovery | |
|---|---|---|---|---|
| Sample | (mg/l) | (mg/l) | (mg/l) | (%) |
| 1 | 2.59 | 1.00 | 3.52 | 93 |
| 2 | 3.82 | 1.00 | 4.74 | 92 |
| 3 | 1.88 | 1.00 | 2.82 | 94 |
| 4 | 5.46 | 1.00 | 6.39 | 93 |
| 5 | 2.95 | 1.00 | 3.97 | 102 |
| 6 | 1.72 | 1.00 | 2.65 | 93 |
| 7 | 2.11 | 1.00 | 3.03 | 92 |
| 8 | 1.24 | 1.00 | 2.24 | 100 |
| 9 | 2.46 | 1.00 | 3.43 | 97 |
| 10 | 4.28 | 1.00 | 5.22 | 94 |
Interference
When interference was defined as a change of >3% from the theoretical value, no interference could be detected in the presence of bilirubin (at concentrations <200 mg/l), hemoglobin (<5 g/l), chyle (<25,000 FTU), or rheumatoid factor (<1,000 IU/ml; Fig. 6). We also assessed the possible influence that the presence of antocoagulants could have in the results. Table 3 shows that the presence of anticoagulants did not influence the results obtained through this method.
Figure 6.
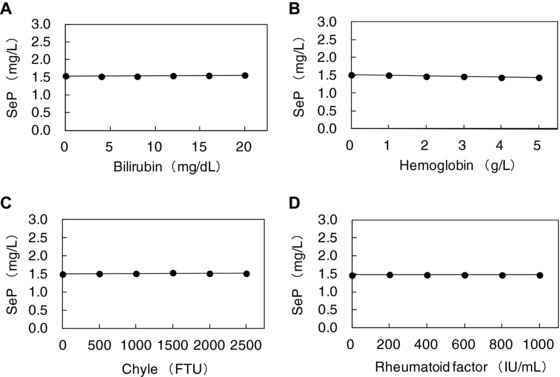
Interference test. Bilirubin (A), hemoglobin (B), chyle (C), and rheumatoid factor (D) were added to serum samples and the samples were assayed. Measured selenoprotein P (SeP) (mg/l; mean value of triplicate) was plotted on the y‐axis.
Table 3.
Influence of Anticoagulants
| Added anticoagulants (final concentration) | |||||
|---|---|---|---|---|---|
| Control | Trisodium citrate (20 mg/ml) | Sodium heparin (100 units/ml) | EDTA 2Na (2 mg/ml) | Sodium fliuoride (4 mg/ml) | |
| Measured FL‐SeP (mg/l) | 3.10 | 3.09 | 3.07 | 3.09 | 3.09 |
| Influence (%) | – | −0.32 | −0.97 | −0.32 | −0.32 |
Comparison With ELISA
The comparison between the measured values obtained using our newly developed SPIA and two ELISA systems is shown in Figure 7. The results of FL‐SeP measurements in the SPIA and ELISA systems showed good agreement irrespective of the mixture ratio of kallikrein‐cleaved fragments. The total‐SeP levels measured by ELISA were mostly constant at any mixture ratio as expected.
Figure 7.
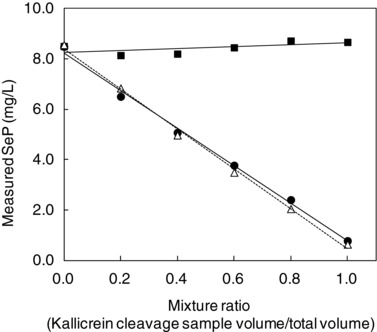
Comparison of measured values obtained using our method and enzyme‐linked immunosorbent assay (ELISA) assay in the samples with mixed full‐length selenoprotein P (FL‐SeP) and kallikrein‐cleaved selenoprotein P (SeP) fragments. The samples were prepared by mixing FL‐SeP with kallikrein‐cleaved SeP fragments at different ratios. Results of ELISA for total‐SeP (▪), for FL‐SeP(●), and the results of our assay for FL‐SeP (Δ) were plotted against the mixture ratio of kallikrein‐cleaved fragments.
The correlation between results from our SPIA and results from the ELISA assays for FL‐SeP is shown in Figure 8. The results from the Passing–Bablok regression analysis showed a slope of the curve of 0.940 (95% confidence interval [CI], 0.891–0.996) and an intercept of 0.165 (95% CI, −0.027 to 0.295). The correlation coefficient (r) was 0.954. Figure 9 shows the dependence between FL‐SeP (x) and total‐SeP (y). In this case, the Passing–Bablok regression equation and correlation coefficient obtained were y = 0.735 (95% CI, 0.630–0.878) x − 0.321 (95% CI, −1.049 to 0.174) and r = 0.630, respectively.
Figure 8.
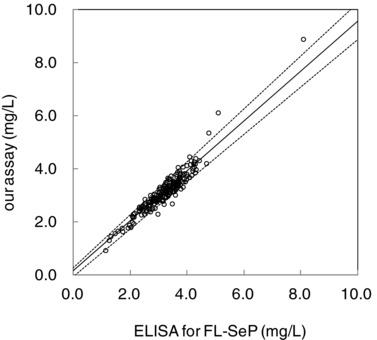
Correlation between our assay and enzyme‐linked immunosorbent assay (ELISA) for full‐length selenoprotein P (FL‐SeP). Serum samples (n = 200) were assayed with the ELISA for FL‐SeP (x) or with our assay (y). The solid line represents the regression line, and the dotted lines indicate the 95% confidence interval.
Figure 9.
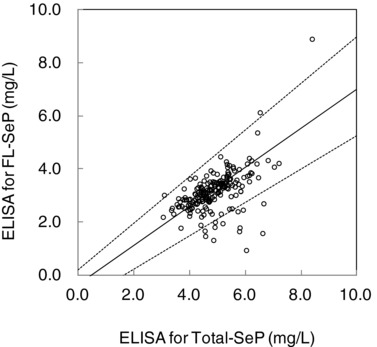
Correlation between total amount of selenoprotein P (total‐SeP) and full‐length selenoprotein P (FL‐SeP). Serum samples (n = 200) were assayed with enzyme‐linked immunosorbent assay (ELISA) for total‐SeP (x) or FL‐SeP (y). The solid line represents the regression line, and the dotted lines indicate the 95% confidence interval.
DISCUSSION
In this study, we have described a novel assay system for measuring the FL‐SeP levels. The assay is based on the SPIA principle; it uses colloidal gold particles coated with anti‐SeP antibodies. The assay is sensitive, with good linearity and recovery. This assay is applicable for FL‐SeP levels in the range 0.2–9 mg/l, which covers most of the reported SeP levels (10–14) and those in the serum samples used in this study.
ELISA provides sufficient time to capture all the analytes present, even in the presence of antisubstances in the sample. Thus, ELISA can provide accurate results irrespective of the co‐occurrence of antisubstances. On the other hand, the homogeneous immunoassay described here presents a much shorter reaction time compared with the ELISA assay; however, it may be subjected to the influence of antisubstances. If kallikrein‐mediated SeP fragments (SeP‐NF or SeP‐CF) resulting from FL‐SeP cleavage can act as antisubstances, they may affect the agglutination reaction negatively. Therefore, we examined the effect of kallikrein‐cleaved SeP fragments on the results of our assay. We compared the measured FL‐SeP levels obtained using our assay and ELISA in a series of samples with various concentrations of the fragments. The results of the two types of assays were in good agreement (Fig. 7). Our assay accurately measured FL‐SeP levels in the presence of kallikrein‐cleaved fragments. We also confirmed that other contaminants (bilirubin, chyle, hemoglobin, and rheumatoid factor) present in the serum did not affect the results. The experiment using clinical serum showed good correlation between the values obtained using our assay and those from conventional ELISA (Fig. 8). Thus, we can conclude that our assay can measure the level of serum FL‐SeP irrespective of the presence of any major interferents.
Using clinical serum samples, we examined the correlation between total‐SeP and FL‐SeP levels. As shown in Figure 9, a few outliers were observed, although some degree of correlation was apparent. This result shows that the total‐SeP and FL‐SeP levels in the blood may not necessarily correlate. New clinical studies may reevaluate the relative levels of FL‐SeP and total‐SeP; our newly developed FL‐SeP assay may be useful in future SeP research.
The positive correlation between serum SeP levels and severity of insulin resistance in patients with type 2 diabetes has been reported 12, suggesting that the serum SeP level could be used as a clinical marker of insulin resistance in such patients. There is also a report showing that the SeP gene expression in cultured hepatocytes is suppressed by an antidiabetic drug metformin 25, which is known to attenuate insulin resistance in humans 26. If the serum SeP levels can predict the efficacy of metformin treatment for insulin resistance in patients with type 2 diabetes, the clinical benefit of measuring the serum SeP level will be considerable. The Diabetes Prevention Program has reported that diabetes incidence in high‐risk adults reduced by 31% after a 3‐year metformin treatment 27, and the 18% reduction of the risk was shown in the 10‐year follow‐up study 28. The preventative effect of metformin on the onset of type 2 diabetes may be increased in nondiabetic individuals with high serum SeP levels. A decrease in plasma SeP levels has been reported to be a possible early marker for septic shock in patients admitted to the intensive care units (ICU) 9. A fast and reliable assay system for measuring serum SeP levels may benefit the patients admitted to the ICU. Our assay would fulfil such needs because it can rapidly quantify SeP. To ensure that our assay can be used with plasma, we confirmed that anticoagulants (trisodium citrate, sodium heparin, EDTA 2Na, and sodium fluoride) do not affect the results, suggesting that the assay could be used to analyze plasma samples. However, a more detailed study using plasma samples and different anticoagulants will be required to confirm the potential of the assay.
In conclusion, we developed a new assay system, based on SPIA, for measuring the FL‐SeP levels. We demonstrated that our SPIA system was sensitive, precise, capable of being fully automated, and compatible with various commercial analyzers. The results delivered by already established assays reflect the total amount of SeP, including FL‐SeP and SeP‐NF fragments, whereas our new SPIA method measures only the FL‐SeP content. This assay system should be useful in future clinical research on SeP.
CONFLICT OF INTEREST
The authors have read the journal's policy and have the following conflicts: M. Tanaka, S. Kato and N. Matsuyama are the employees of Alfresa Pharma Corporation.
ACKNOWLEDGMENTS
This work was supported by Adaptable and Seamless Technology Transfer Program through Target‐driven R&D (A‐STEP) AS2311400F and AS2414066P from Japan Science and Technology Agency (JST).
Grant sponsor: Japan Science and Technology Agency (JST); Grant numbers: AS2311400F and AS2414066P.
REFERENCES
- 1. Burk RF, Hill KE. Selenoprotein P‐expression, functions, and roles in mammals. Biochim Biophys Acta 2009;1790:1441–1447. [DOI] [PMC free article] [PubMed] [Google Scholar]
- 2. Saito Y, Takahashi K. Selenoprotein P: Its structure and functions. J Health Sci 2000;46:409–413. [Google Scholar]
- 3. Saito Y, Takahashi K. Characterization of selenoprotein P as a selenium supply protein. Eur J Biochem 2002;269:5746–5751. [DOI] [PubMed] [Google Scholar]
- 4. Saito Y, Sato N, Hirashima M, Takebe G, Nagasawa S, Takahashi K. Domain structure of bi‐functional selenoprotein P. Biochem J 2004;381:841–846. [DOI] [PMC free article] [PubMed] [Google Scholar]
- 5. Saito Y, Hayashi T, Tanaka A, et al. Selenoprotein P in human plasma as an extracellular phospholipid hydroperoxide glutathione peroxidase. Isolation and enzymatic characterization of human selenoprotein P. J Biol Chem 1999;274:2866–2871. [DOI] [PubMed] [Google Scholar]
- 6. Takebe G, Yarimizu J, Saito Y, et al. A comparative study on the hydroperoxide and thiol specificity of the glutathione peroxidase family and selenoprotein P. J Biol Chem 2002;277:41254–41258. [DOI] [PubMed] [Google Scholar]
- 7. Schomburg L, Schweizer U, Holtmann B, Flohé L, Sendtner M, Köhrle J. Gene disruption discloses role of selenoprotein P in selenium delivery to target tissues. Biochem J 2003;370:397–402. [DOI] [PMC free article] [PubMed] [Google Scholar]
- 8. Meyer HA, Hollenbach B, Stephan C, et al. Reduced serum selenoprotein P concentrations in German prostate cancer patients. Cancer Epidemiol Biomarkers Prev 2009;18:2386–2390. [DOI] [PubMed] [Google Scholar]
- 9. Forceville X, Mostert V, Pierantoni A, et al. Selenoprotein P, rather than glutathione peroxidase, as a potential marker of septic shock and related syndromes. Eur Surg Res 2009;43:338–347. [DOI] [PubMed] [Google Scholar]
- 10. Hollenbach B, Morgenthaler NG, Struck J, et al. New assay for the measurement of selenoprotein P as a sepsis biomarker from serum. J Trace Elem Med Biol 2008;22:24–32. [DOI] [PubMed] [Google Scholar]
- 11. Meyer HA, Endermann T, Stephan C, et al. Selenoprotein P status correlates to cancer‐specific mortality in renal cancer patients. PLoS One 2012;7:e46644. [DOI] [PMC free article] [PubMed] [Google Scholar]
- 12. Misu H, Takamura T, Takayama H, et al. A liver‐derived secretory protein, selenoprotein P, causes insulin resistance. Cell Metab 2010;12:483–495. [DOI] [PubMed] [Google Scholar]
- 13. Misu H, Ishikura K, Kurita S, et al. Inverse correlation between serum levels of selenoprotein P and adiponectin in patients with type 2 diabetes. PLoS One 2012;7:e34952. [DOI] [PMC free article] [PubMed] [Google Scholar]
- 14. Yang SJ, Hwang SY, Choi HY, et al. Serum selenoprotein P levels in patients with type 2 diabetes and prediabetes: Implications for insulin resistance, inflammation, and atherosclerosis. J Clin Endocrinol Metab 2011;96:E1325–E1329. [DOI] [PubMed] [Google Scholar]
- 15. Saito Y, Watanabe Y, Saito E, Honjoh T, Takahashi K. Production and application of monoclonal antibodies to human selenoprotein P. J Health Sci 2001;47:346–352. [Google Scholar]
- 16. Leuvering JH, Thal PJ, Van der Waart M, Schuurs AH. A sol particle agglutination assay for human chorionic gonadotrophin. J Immunol Methods 1981;45:183–194. [DOI] [PubMed] [Google Scholar]
- 17. Wielaard F, Denissen A, van der Veen L, Rutjes I. A sol‐particle immunoassay for determination of anti‐rubella antibodies; development and clinical validation. J Virol Methods 1987;17:149–158. [DOI] [PubMed] [Google Scholar]
- 18. Englebienne P, Van Hoonacker A, Valsamis J. Rapid homogeneous immunoassay for human ferritin in the Cobas Mira using colloidal gold as the reporter reagent. Clin Chem 2000;46:2000–2003. [PubMed] [Google Scholar]
- 19. Tanaka M, Matsuo K, Enomoto M, Mizuno K. A sol particle homogeneous immunoassay for measuring serum cystatin C. Clin Biochem 2004;37:27–35. [DOI] [PubMed] [Google Scholar]
- 20. De Roe C, Courtoy PJ, Baudhuin P. A model of protein‐colloidal gold interactions. J Histochem Cytochem 1987;35:1191–1198. [DOI] [PubMed] [Google Scholar]
- 21. Clinical and Laboratory Standards Institute . Protocols for Determination of Limits of Detection and Limits of Quantitation, Approved Guideline. CLIS document EP17A. Wayne, PA, USA: CLIS; 2004. [Google Scholar]
- 22. Clinical and Laboratory Standards Institute . Evaluation of the Linearity of Quantitative Measurement Procedures: A Statistical Approach; Approved Guideline. CLIS document EP6‐A. Wayne, PA, USA: CLIS; 2003. [Google Scholar]
- 23. Clinical and Laboratory Standards Institute . Evaluation of Precision Performance of Clinical Chemistry Devices; Approved Guideline‐Second Edition. CLIS document EP5‐A2. Wayne, PA, USA:CLIS; 2004. [Google Scholar]
- 24. Jpn J Clinical Laboratory Automation . Performance test manual of the daily clinical test. Jpn J Clin Lab Autom 2002;27(Suppl. 1):27–30. [Google Scholar]
- 25. Speckmann B, Sies H, Steinbrenner H. Attenuation of hepatic expression and secretion of selenoprotein P by metformin. Biochem Biophys Res Commun 2009;387:158–163. [DOI] [PubMed] [Google Scholar]
- 26. Natali A, Ferrannini E. Effects of metformin and thiazolidinediones on suppression of hepatic glucose production and stimulation of glucose uptake in type 2 diabetes: A systematic review. Diabetologia 2006;49:434–441. [DOI] [PubMed] [Google Scholar]
- 27. Diabetes Prevention Program Research Group . Reduction in the incidence of type 2 diabetes with lifestyle intervention or metformin. N Engl J Med 2002;346:393–403. [DOI] [PMC free article] [PubMed] [Google Scholar]
- 28. Diabetes Prevention Program Research Group . 10‐Year follow‐up of diabetes incidence and weight loss in the Diabetes Prevention Program Outcomes Study. Lancet 2009;374:1677–1686. [DOI] [PMC free article] [PubMed] [Google Scholar]