

Abstract
Background
Voriconazole is a broad spectrum triazole antifungal drug used to treat systemic fungal infections. Therapeutic drug monitoring of voriconazole is necessary for achieving maximal efficiency without inducing toxic side effects. Other publications have reported methods for measuring voriconazole in serum using high‐performance liquid chromatography (HPLC) and liquid chromatography tandem mass spectrometry (LC‐MS/MS). Here, we report for the first time a method for the measurement of voriconazole in serum samples using gas chromatography mass spectrometry (GC‐MS).
Methods
Protein precipitation with methanol was used to extract the antifungal that was derivatized with BSTFA (Sigma‐Aldrich, St. Louis, MO) and analyzed by GC‐MS. Linearity, sensitivity, precision, accuracy, and drug interferences were evaluated for this assay.
Results
Our method was linear up to 10 μg/ml of voriconazole. The LOQ was determined to be 0.4 μg/ml. CV for between‐day precision was <12%. Correlation with an established LC‐MS/MS yielded a R2 of 0.96. Tested drugs did not result in >10% error in measurement.
Conclusion
To our knowledge, we report here the first GC‐MS method for voriconazole measurement with acceptable performance. We hope that this method allows clinical laboratories without HPLC or LC‐MS/MS instrumentation to measure voriconazole.
Keywords: antifungal, therapeutic drug monitoring, gas chromatography, mass spectrometry, triazole
INTRODUCTION
Voriconazole is a derivative of the antifungal fluconazole and is intended to enhance fluconazole's activity spectrum 1. Voriconazole is indicated for use in the treatment of fungal infections 2, such as invasive aspergillosis, candidemia, and serious infections caused by Scedosporium and Fusarium species 3, 4, 5, 6, 7. These fungal infections can be life‐threatening and are especially concerning for the immunocompromised patient population treated in a pediatric hospital.
Voriconazole's pharmacokinetics are nonlinear and interindividual variability is high. The drug is metabolized by hepatic cytochrome P450 enzymes CYP3A4, CYP2C9, and CYP2C19 3. CYP2C19 activity varies between individuals due to genetic differences or hepatic insufficiencies that cause voriconazole metabolism to be unpredictable. Also, multiple drug interactions that alter the pharmacokinetics of voriconazole have been noted in the literature 2. The need for therapeutic drug monitoring (TDM) of voriconazole is important to limit patient toxicity and improve drug efficiency by maintaining the appropriate therapeutic range.
According to a retrospective study of patients who received voriconazole, concentrations less than 1.7 mg/l (μg/ml) were associated with increased incidence of treatment failure. Adverse neurotoxic events, such as visual and auditory hallucinations, occurred at concentrations greater than 5 mg/l (μg/ml). The same study suggested an appropriate therapeutic range to be 1.7–5.5 mg/l (μg/ml), although similar studies have suggested treatment ranges that vary between 1 and 6 mg/l (μg/ml) 2. It should be noted that toxic levels of voriconazole >6 mg/l (μg/ml) are associated with elevated hepatic enzymes 3, 7, 8.
Due to the factors described above, there is great difficulty for clinicians to effectively keep the patient's serum concentrations in the therapeutic range, either to provide treatment success or to prevent toxicity. The need for TDM of voriconazole is great and turn‐around time of results is crucial for effective dosing.
Previous reports have shown that voriconazole can be measured both by high‐performance liquid chromatography (HPLC) and liquid chromatography tandem mass spectrometry (LC‐MS/MS). This report is the first to describe a novel method for measuring voriconazole by GC‐MS. This method may allow a larger number of laboratories to measure voriconazole for those facilities that do not have LC‐MS/MS or HPLC instruments available.
METHODS
Reagents
The reagents used in the study are voriconazole and THC‐deuterium 9 (THC‐d9) (Cerilliant, Round Rock, TX), and voriconazole‐deuterium 3 (Vori‐d3; Toronto Research Chemicals, Ontario, Canada). Drugs used for interference studies, Bactrim, Tacrolimus, Cyclosporine, Mycophenolate Mofetil, Vancomycin, Cefepime, Meropenem, Acyclovir, were obtained from hospital pharmacy supplies; methanol HPLC grade from Fisher; and BSTFA from Sigma‐Aldrich, St. Louis, MO.
Sample Extraction
Two hundred microliters of serum sample was mixed with 400 μl of cold methanol with 0.375 μg/ml THC‐d9 internal standard (IS). Samples were mixed vigorously and centrifuged at 13,000 × g for 5 min at room temperature. The supernatant was transferred to a new tube and mixed with 250 μl of room temperature methanol and centrifuged again in the same conditions. About 500 μl of supernatant were mixed with 1.5 mL of Ethyl Acetate, mixed for 5 minutes and centrifuged at 1,000 × g for 4 min at room temperature. Approximately 1.5 mL of the supernatant was transferred to a clean glass test tube and dried under a nitrogen stream at room temperature until the sample was completely dried. BSTFA (50 μl) was then added to the sample and incubated at 50°C for 5 min. The samples were set to cool and loaded on to the autosampler.
GC‐MS Conditions
Sample injection volume was 1 μl, splitless with flow rate of 50 ml/min at 1 min. Chromatography was performed under constant flow set at 0.8 ml/min. Oven conditions were set with a start temperature of 50°C increasing at a rate of 10°C up to 300°C and a final hold time of 3 min. MS was set to selected ion monitoring (SIM) mode, monitoring for m/z ions 339, 263, 141, and 225 for voriconazole and m/z ions 380, 479, and 497 for THC‐d9. Analysis was carried on an Agilent 5975C MS coupled to an Agilent 7890A GC using a HP‐5MS column (30 m × 0.25 mm).
Linearity Studies
Voriconazole concentrations of 0, 1, 3, 5, 8, and 10 μg/ml were spiked into serum devoid of voriconazole and analyzed in triplicate to obtain a linear analytical measuring range.
Precision Studies
Two levels of voriconazole in serum were analyzed 19 times to obtain within run precision data. For between‐day precision, two different concentrations were analyzed on eight different days.
Analytical Sensitivity
Voriconazole spiked in serum at different concentrations were analyzed to determine limit of detection (LOD). Voriconazole spiked in serum (0.4 μg/ml) was analyzed 20 times to obtain statistical data for limit of quantitation (LOQ) studies.
Carryover Studies
Serum samples spiked with voriconazole representing high values (10 μg/ml) and low values (0.5 μg/mL) were analyzed in the following sequence: high1, high2, low1, low2, and low3. Samples were analyzed in triplicate and carryover ratio was determined with the following formula: [(low1 − low3)/(high2 − low3)] × 100 9.
Method Comparison
Forty‐one serum samples were used for performance validation between the GC‐MS method reported here and an established LC‐MS/MS method that is currently used for clinical testing.
Interference Studies
Serum spiked with voriconazole only, or with the addition of other drugs that are frequently administered to patients on voriconazole, was analyzed to determine possible drug interference with the measurement of voriconazole. The additional drugs were tested at the concentrations shown in Table 2.
Table 2.
Drugs That Are Commonly Coadministered With Voriconazole Were Tested at the Concentrations Shown for Interference With Voriconazole Measurement
| Drug | Concentration tested (μg/ml) |
|---|---|
| Meropenem | 100 |
| Tacrolimus | 15 |
| Acyclovir | 50 |
| Cefepime | 40 |
| Vancomycin | 80 |
| Mycophenolate | 50 |
| Bactrim | 500 Sulfamethoxazole 100 trimethoprim |
| Cyclosporine | 50 |
RESULTS
GC‐MS Characterization of Voriconazole
Voriconazole spiked into human serum was used to determine the ion fragmentation pattern. Under the conditions determined by our method, voriconazole had a retention time close to 9.1 min, whereas the IS THC‐d9 had a retention time of approximately 10.9 min (Fig. 1A). In our method, voriconazole's ion pattern showed four ions of m/z 339, 296, 263, 225, and 141. Ion 296 ended up being the main ion in an adjacent peak in our quality control (QC) that interfered with voriconazole quantitation; therefore it was excluded from the selected ion monitoring procedure. The ion pattern used in our method is shown in Figure 1B. In our method ion 339 was the target ion, and the others were used as qualifying ions. For THC‐d9, ion 380 was the target ion.
Figure 1.

GC‐MS characterization of Voriconazole in Serum. A) Total Ion Chromatogram of the voriconazole GC‐MS method. B) Ion fragmentation pattern of Voriconazole.
To confirm that the observed peak was indeed voriconazole, we also spiked a deuterated form of voriconazole, vori‐d3, and found that the fragmentation pattern of the deuterated voriconazole was similar to the original voriconazole (Fig. 2A), except for two ion fragments that were offset by 3 m/z (from 263 to 266 and from 339 to 342; Fig. 2B) that were due to the deuterium.
Figure 2.
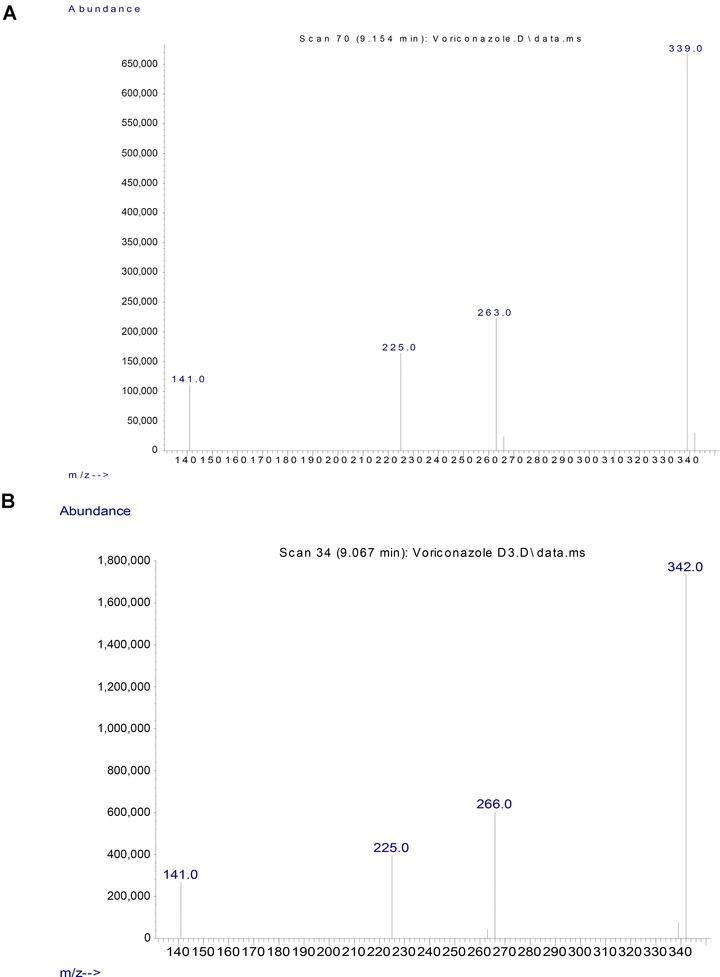
GC‐MS Ion Fragmentation Pattern of Voriconazole and Voriconazole‐D3. A) Ion fragmentation pattern of voriconazole, target ion is 339, qualifying ions are 263, 225 and 141. B) Ion fragmentation pattern of voriconazole‐D3, with ions 342, 266, 225 and 141.
Linearity and Analytical Sensitivity
We tested a measuring range from 0 to 10 μg/ml of voriconazole (Fig. 3). The peak corresponding to voriconazole increased with increasing concentrations of added drug (Fig. 3A). Linear regression analysis statistics showed the following results: R 2 = 0.99, slope = 0.11, and intercept of = 0.016 (Fig. 3B). These results indicated that this assay was linear in this range. This interval is useful clinically, as the therapeutic reference interval is 1–6 μg/ml. Analytical sensitivity was also assessed by spiking different amounts of voriconazole. We determined the LOD to be 0.2 μg/ml for this method (data not shown). Furthermore, we could measure down to a concentration of 0.4 μg/ml with a CV of 12.9% (Table 1), making this the method's LOQ. We considered an acceptable CV of <20% for the LOQ. The LOQ minus 2 SD was also greater than our LOD.
Figure 3.

Analytical Measuring Range of Voriconazole by GC‐MS. A) TIC of increasing concentrations of voriconazole. B) Linearity of voriconazole assay, n = 3, concentrations tested were, 0, 1, 2, 5, 8 and 10 μg/ml.
Table 1.
Precision and LOQ Studies
| Sample | N | Mean (μg/ml) | SD | CV (%) |
|---|---|---|---|---|
| Precision within run | ||||
| QC L1 | 19 | 1.54 | 0.14 | 8.8 |
| QC L2 | 19 | 4.95 | 0.50 | 10.1 |
| Precision between day (spanning 8 days) | ||||
| QC L1 | 52 | 1.29 | 0.14 | 11.1 |
| QC L2 | 52 | 4.57 | 0.52 | 11.5 |
| Limit of quantitation | ||||
| LOQ | 28 | 0.42 | 0.05 | 12.9 |
Precision and Carryover
Within‐day precision was found to have a CV of 8.8% at level 1 of QC, and a CV of 10.1% for level 2 QC. Between‐day precision was found to be a CV of 11.1% at level 1 of QC and 11.5% at level 2 of QC (Table 1). Imprecision was considered acceptable if it was <20% for level 1 and <15% for level 2. Average carryover was determined to be 0.02% based on three repeats, which we considered acceptable (data not shown).
Method Comparison
We compared the performance of our method to an established LC‐MS/MS method to determine method accuracy (Fig. 4A and B). We compared a total of 41 serum samples, ten samples were spiked using voriconazole in serum devoid of voriconazole, but the majority was samples from patients receiving voriconazole. Our results found that R 2 = 0.96 with a slope of = 0.83 and intercept of = 0.17 and average bias of −0.21 μg/ml.
Figure 4.

Voriconazole Method Comparison. A) Linear regression plot B) Difference plot. Forty one serum samples were split and analyzed by the GC‐MS or and established LC‐MS/MS method, and the results compared. Average bias was −0.21 μg/ml.
Drug Interference
We tested the effect of commonly coadministered drugs to determine if any of them could potentially interfere with the measurement of voriconazole by GC‐MS. The concentrations of the individual drugs tested are shown in Table 2. None of the drugs resulted in >10% error in the measurement of voriconazole (Fig. 5).
Figure 5.

Drug Interference Study. Plain serum was spiked with voriconazole alone or a combination of voriconazole and another drug. Each was tested 3 times and results averaged.
DISCUSSION
Voriconazole exhibits nonlinear pharmacokinetics caused by metabolism saturation; therefore, TDM is often required 8. Its narrow therapeutic range and difficult to predict pharmacokinetics make it an ideal target for clinical monitoring.
Several reports have shown different methods for measuring voriconazole from patient samples 8, 10, 11, 12, 13, 14, 15, relying on HPLC or LC‐MS/MS. However, presently LC‐MS/MS instruments have a limited presence in clinical laboratories due to a number of factors, including high initial cost, the complexity of operation, and limited expertise to operate and maintain them. In this report, we introduce an alternative method for the measurement of voriconazole using a GC‐MS method. Our method uses a protein precipitation step with methanol to extract voriconazole, which is then derivatized with BSTFA. We use THC‐d9 as an IS to correct sample handling variability. We have since switched to using voriconazole‐D3 as the internal standard. The run for each sample takes approximately 11.5 min. Our method exhibited excellent linearity from 0.4 to 10 μg/ml (Fig. 2B). This is a clinically useful range, as the therapeutic interval is 1–6 μg/ml, with concentrations of >6 μg/ml considered toxic. Our LOQ was determined to be 0.4 μg/ml. Our imprecision studies yielded acceptable results of CV < 15% for between‐day studies, and carryover studies resulted in an acceptable level of 0.02%. Importantly, method comparison to an established clinical LC‐MS/MS method showed good correlation (Fig. 4) with an average bias of −0.21 μg/ml. In addition, our findings indicated that eight commonly coadministered drugs did not interfere with voriconazole measurement at the concentrations tested (Fig. 5). In conclusion, we report here for the first time a robust GC‐MS method capable of measuring voriconazole in patient serum. This will be a useful alternative for those clinical laboratories that do not have access to LC‐MS/MS or HPLC equipment, and can dramatically improve turnaround time, leading to better dosing of voriconazole.
ACKNOWLEDGEMENTS
The authors thank Heidi Trinkman, PharmD, for providing the medications used in the drug interference studies.
REFERENCES
- 1. Sabo JA, Abdel‐Rahman SM. Voriconazole: A new triazole antifungal. Ann Pharmacother 2000;34:1032–1043. [DOI] [PubMed] [Google Scholar]
- 2. Dolton MJ, Ray JE, Chen SC, Ng K, Pont LG, McLachlan AJ. Multicenter study of voriconazole pharmacokinetics and therapeutic drug monitoring. Antimicrob Agents Chemother 2012;56:4793–4799. [DOI] [PMC free article] [PubMed] [Google Scholar]
- 3. VFEND® (voriconazole) package insert. Vol. New York, NY: Pfizer Inc., 2014. [Google Scholar]
- 4. Ghannoum MA, Kuhn DM. Voriconazole—Better chances for patients with invasive mycoses. Eur J Med Res 2002;7:242–256. [PubMed] [Google Scholar]
- 5. Murphy M, Bernard EM, Ishimaru T, Armstrong D. Activity of voriconazole (UK‐109496) against clinical isolates of Aspergillus species and its effectiveness in an experimental model of invasive pulmonary aspergillosis. Antimicrob Agents Chemother 1997;41:696–698. [DOI] [PMC free article] [PubMed] [Google Scholar]
- 6. Wildfeuer A, Seidl HP, Paule I, Haberreiter A. In vitro evaluation of voriconazole against clinical isolates of yeasts, moulds and dermatophytes in comparison with itraconazole, ketoconazole, amphotericin B and griseofulvin. Mycoses 1998;41:309–319. [DOI] [PubMed] [Google Scholar]
- 7. Ally R, Schürmann D, Kreisel W, et al. A randomized, double‐blind, double‐dummy, multicenter trial of voriconazole and fluconazole in the treatment of esophageal candidiasis in immunocompromised patients. Clin Infect Dis 2001;33:1447–1454. [DOI] [PubMed] [Google Scholar]
- 8. Langman LJ, Boakye‐Agyeman F. Measurement of voriconazole in serum and plasma. Clin Biochem 2007;40:1378–1385. [DOI] [PubMed] [Google Scholar]
- 9. Haeckel R. Recommendations for definition and determination of carry‐over effects. J Automat Chem 1988;10:181–183. [DOI] [PMC free article] [PubMed] [Google Scholar]
- 10. Beste KY, Burkhardt O, Kaever V. Rapid HPLC‐MS/MS method for simultaneous quantitation of four routinely administered triazole antifungals in human plasma. Clin Chim Acta 2012;413:240–245. [DOI] [PubMed] [Google Scholar]
- 11. Farowski F, Cornely OA, Vehreschild JJ, et al. Quantitation of azoles and echinocandins in compartments of peripheral blood by liquid chromatography‐tandem mass spectrometry. Antimicrob Agents Chemother 2010;54:1815–1819. [DOI] [PMC free article] [PubMed] [Google Scholar]
- 12. Decosterd LA, Rochat B, Pesse B, et al. Multiplex ultra‐performance liquid chromatography‐tandem mass spectrometry method for simultaneous quantification in human plasma of fluconazole, itraconazole, hydroxyitraconazole, posaconazole, voriconazole, voriconazole‐N‐oxide, anidulafungin, and caspofungin. Antimicrob Agents Chemother 2010;54:5303–5315. [DOI] [PMC free article] [PubMed] [Google Scholar]
- 13. Pascual A, Nieth V, Calandra T, et al. Variability of voriconazole plasma levels measured by new high‐performance liquid chromatography and bioassay methods. Antimicrob Agents Chemother 2007;51:137–143. [DOI] [PMC free article] [PubMed] [Google Scholar]
- 14. Xiong X, Duan J, Zhai S, Wang L, Lan X. Fast and reliable determination of voriconazole in human plasma by LC‐APCI‐MS/MS. Biosci Biotechnol Biochem 2010;74:2151–2153. [DOI] [PubMed] [Google Scholar]
- 15. Pennick GJ, Clark M, Sutton DA, Rinaldi MG. Development and validation of a high‐performance liquid chromatography assay for voriconazole. Antimicrob Agents Chemother 2003;47:2348–2350. [DOI] [PMC free article] [PubMed] [Google Scholar]