Abstract
Background
Recently, the human common salivary protein 1 (CSP1) was identified as an ortholog of the Demilune cell and parotid protein of mouse. However, its function remains to be determined. Here, we show that the serum CSP1 concentration of diabetes mellitus (DM) patients is much higher than that of healthy controls.
Methods
Recombinant human CSP1 was expressed as a Glutathione‐S‐transferase (GST)‐tagged protein, and the purified fusion protein was used as an immunogen to generate monoclonal antibody (mAb) to CSP1. The produced mAb was tested as a probe in Western blotting of human saliva and in immunohistochemistry of various human tissues. The serum CSP1 levels of 31 DM patients and 38 normal adults were quantified by a house‐fabricated CSP1 sandwich enzyme‐linked immunosorbent assay (ELISA) system.
Results
Immunoblot analysis by mAb‐hCSP1#4 showed that CSP1 in human saliva exists in a 27 kDa glycosylated form. Among the various human tissues tested, the salivary gland was the only tissue stained with mAb‐hCSP1#4 by immunohistochemistry. Quantification of serum CSP1 concentration by CSP1 ELISA showed that the median values (25th–75th percentile) of DM patients and healthy adults were 22.2 (15.8–28.2) and 3.2 (0–11.4), respectively. Student's t‐test results indicated that there was a statistically significant difference between the two groups (P < 0.01).
Conclusion
The significant difference between the CSP1 levels of the two groups indicated that CSP1 would be a potential biomarker for detection or screening of DM patients.
Keywords: biomarker, common salivary protein 1, diabetes mellitus, ELISA, monoclonal antibody
Introduction
A huge number of plasma/serum proteins exist in blood, and their concentrations are different by an extraordinary dynamic range of at least 9–10 orders of magnitude 1. These proteins originate from a variety of tissues and organs as a result of secretion, excretion, or leakage in response to different physiological or pathological states. Biomedical studies have demonstrated that the concentrations of plasma/serum proteins show good correlation with disease progression/severity and prognosis 2, 3, 4. Biomarkers in plasma/serum are indicator biomolecules that assist in early diagnosis, discriminate between diseases, and provide valuable tools for monitoring disease states. For example, a level of prostate‐specific antigen (Ag) higher than 4 ng/ml indicates benign hyperplastic tissue, malignant prostatic tissue, or metastatic prostatic carcinoma in the serum of an adult male 5. Furthermore, this biomarker level can be used for monitoring posttreatment clinical status and for the posttherapeutic evaluation of prostate cancer patients 6. Early detection of cancer or infectious diseases through biomarkers may not only reduce fatalities due to disease severity, but also decrease expenses by avoiding the unnecessary costs of improper and delayed diagnosis and treatment. As a result, most current clinical tests are based on the analysis of blood plasma/serum 7, 8.
Human saliva contains a number of distinct salivary proteins, roughly between 100 and 140, including α‐amylase, lysozyme, mucins, proline‐rich proteins, immunoglobulins, and many others 9, 10. Among the salivary proteins, human common salivary protein 1 (CSP1, LOC124220; synonyms: HRPE773, PRO1567) has been identified as an ortholog of the Demilune cell and parotid protein (Dcpp) of mouse and of CSP1 of rat 11, 12.It has recently been reported that the gene of pancreatic adenocarcinoma upregulating factor is as same as that of CSP1, suggesting the involvement of this novel secretory protein in the progression of pancreatic cancer 13. Another article regarding the function of CSP1 indicated that it may play a role in promoting the binding of Streptococcus mutans to the experimental salivary pellicle formed on a hydroxyapatite surface to influence the initial colonization of this pathogenic bacterium 14. However, other characteristics of CSP1 are still unknown.
When we attempted to identify novel biomarkers from human plasma/serum, we unexpectedly detected the CSP1 at much higher concentrations in the serum of diabetes patients than in the serum of normal adults. We pursued this issue in the present study, produced monoclonal antibodies (mAbs) against human CSP1, and used them as probes to measure and compare the concentrations of CSP1 in the sera of diabetes mellitus (DM) patients and normal adults using the sandwich ELISA method. Furthermore, CSP1 as a potential biomarker for DM was discussed.
Materials and Methods
Serum Collection and Storage
Blood samples were obtained from 31 DM patients and 38 healthy individuals who visited the Hallym University Medical Center in Chuncheon, Korea. Informed consent was obtained from volunteers after the nature and possible consequences of the studies had been fully explained. All of the female and male participants were between the ages of 24 and 75 years. Venous blood was collected in 5‐ml vacuum tubes (Becton‐Dickinson, Franklin Lakes, NJ) and then left at room temperature for 10 min to allow for blood clotting. The serum samples after centrifugation were saved, aliquoted in small volumes, and frozen at −70°C.
Expression and Purification of Recombinant Human CSP1
The recombinant human CSP1 (rhCSP1) clone was a kind gift from Dr. Si Y. Song at Yonsei University College of Medicine. The GST‐tagged construct encoding the full length of rhCSP1 cDNA was expressed following IPTG induction in BL21 (DE3) Escherichia coli, and the fusion protein was purified using glutathione–agarose beads (50% slurry) in the presence of the reduced form of glutathione according to the manufacturer's instructions (ELPIS Biotech, Korea). The purified fusion protein was flash‐frozen in liquid nitrogen and stored at −70°C until use.
SDS‐PAGE and Immunoblotting
Proteins were denatured by boiling for 2 min after adding 2× sodium dodecyl sulfate (SDS)‐treatment buffer and then separated on a 12% SDS polyacrylamide gel. Proteins on the gels were either stained with Coomassie Blue or electrotransferred to nitrocellulose paper for immunoblotting 15. Nitrocellulose blots were blocked with 5% nonfat powdered milk in Tris‐buffered saline (TBS buffer: 10 mM Tris, 150 mM NaCl, pH 8.0) and probed with primary Ab for 1 hr at room temperature or overnight at 4°C. After the membrane was thoroughly rinsed with 50 mM Tris, 150 mM NaCl, 0.05% Tween 20 (TBST) buffer (TBS + 0.3% Tween 20), the blot was visualized using antimouse IgG Ab conjugated to HRP and an enhanced chemiluminescence (ECL) substrate kit (Pierce, Rockford, IL). CSP1 protein was detected by exposure of the blot to Biomax‐MS X‐ray film (Eastman Kodak, Rochester, NY) in a dark room.
Production of Monoclonal Antibodies against CSP1
The GST fusion protein containing rhCSP1 was used as an immunogen for the production of mAbs. The immunization of a Balb/c mouse with GST fusion protein, fusion between immunized mouse spleen cell and myeloma cells, screening of hybridomas by ELISA, and production of ascitic fluids were conducted according to previously described methods 16.
Biotinylation of Monoclonal Antibody
To label mAb with biotin, 10 μg of biotin (EZ‐LinkTM NHS‐LC‐LC‐biotin, Pierce, Waltham, MA) was dissolved in 500 μl of phosphate‐buffered saline (PBS) containing 250 μg of mAb. The mixture was vortexed every 30 min while it was incubated on ice for 4 hr. The mixture was then dialyzed against 1× PBS at 4°C.
Immunohistochemistry
To locate CSP1 in human tissues, immunohistochemistry was conducted with paraffin‐embedded human tissue slides (Super Biochips, South Korea) according to the manufacturer's instructions. Briefly, sections were deparaffinized by treatment with xylenes and rehydrated in a graded alcohol series. Ag unmasking was carried out by boiling the sections in sodium citrate buffer (10 mM sodium citrate; and 0.05% Tween 20, pH 6.0) for 10 min in a microwave oven. After being allowed to cool to room temperature, the sections were rinsed briefly in PBS and treated with 0.3% hydrogen peroxide in water for 30 min to quench any endogenous peroxidase activity. Sections were incubated with 3% bovine albumin serum in PBS for 20 min at room temperature in order to block nonspecific binding. Sections were then incubated with biotinylated anti‐CSP1 Ab overnight at 4°C. The immune reaction complexes were detected using avidin‐HRP for 30 min, and the resulting signal was developed with diaminobenzidine tablets (D4293, Sigma, St. Louis, MO). The sections were counterstained with Mayer's hematoxylin (S3309, DAKO, Santa Clara, CA), dehydrated in 80%, 90%, and 100% ethanol, cleaned in xylene for 2 min each, and then mounted on glass slides with glycerol.
Sandwich ELISA
Sandwich ELISA was used in this study to measure the concentration of CSP1 in serum. In brief, 50 μl of capture mAb (mAb‐hCSP1#14, 2 μg/ml) was applied to the ELISA plate, and the plate was incubated for 1 hr at 37°C and washed three times with PBST. After the plate was treated with 50 μl of bovine serum albumin (BSA) blocking solution (10 mg/ml), 50 μl of the serum was added to the wells, and the plate was incubated for 1 hr at 37°C. After washing the plates with PBST, 50 μl of the biotin‐conjugated detector mAb (mAb‐hCSP1#4, 2 μg/ml) was added to the wells and incubated for 1 hr at 37°C prior to being probed with avidin‐HRP solution (10 mg/ml). Following a final rinse with PBST, the color reaction for detection of Ag–Ab complex was initiated with an addition of 50 μl of 3,3′,5,5′‐tetramethylbenzidine (TMB) substrate solution (10 mg/ml) for 15 min and then stopped by adding 50 μl of 10 μmol/ml H2SO4. The absorbance was measured at 450 nm in an automatic ELISA reader (Bio‐Rad model 550, Irvine, CA).
Data Analysis
PASW Statistics for windows version 18.0 (SPSS Inc., Chicago) and Microsoft version 2010 excel program were used for analysis and comparison of test results. P‐value <0.05 was considered significant. Pearson's correlation coefficients (r2) were used to evaluate correlations between two parameters.
Results
Expression and Purification of Recombinant Human CSP1
The rhCSP1 was expressed as a GST‐tagged fusion protein in E. coli and purified using a GST agarose affinity column. Since the human CSP1 gene encodes 154 amino acids without the predicted signal sequence on the N‐terminus, the expected total fusion protein size was about 45 kDa, including the GST protein of 26 kDa. SDS‐polyacrylamide gel electrophoresis (PAGE) and immunoblot analyses were performed to confirm the expression and purification of GST‐tagged rhCSP1. The size of expressed GST‐tagged rhCSP1 was consistent with its estimated molecular weight as shown in lanes 2 and 3 of CB and WB in Figure 1. The purified rhCSP1 had only one band, and no other proteins were identified (Fig. 1, lane 3 of CB and WB).
Figure 1.
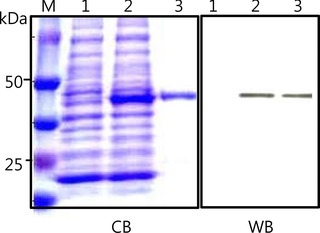
Expression and purification of rhCSP1. The rhCSP1 was expressed as a GST‐tagged protein in E. coli and purified using a GST agarose column. CB is a Coomassie Blue‐stained SDS gel containing molecular‐size marker (lane M), bacterial lysate without induction (lane 1), bacterial lysate with induction (lane 2), and purified GST‐tagged rhCSP1 (lane 3). WB is a corresponding immunoblot of CB probed with anti‐GST IgG. GST‐tagged rhCSP1 of 45 kDa was detected as shown in lanes 2 and 3.
Production of mAbs against Human Recombinant CSP1
The purified GST‐tagged rhCSP1 was used as an immunogen for the production of mAbs. Thus, positive hybridoma clones producing Ab against rhCSP1 were selected when the supernatants of hybridoma clones reacted with GST‐tagged rhCSP1 but not with GST protein according to ELISA. Ten monoclonal hybridoma clones were selected as positive clones through a series of limiting dilutions. Sandwich ELISA was performed with purified GST‐tagged rhCSP1 as an Ag in order to select the pair of detector and capture Ab among the ten mAbs. When mAb‐hCSP1#14 and mAb‐hCSP1#4 were used as capture Ab and detector Ab, respectively, the best signal was obtained (data not shown). Therefore, this pair of mAbs was used for the measurement of CSP1 level in sera of diabetes patients and normal adults in sandwich ELISA.
Quality Test of Produced mAbs by Immunoblot and Immunohistochemistry
To test the quality of the produced mAbs, human saliva proteins were resolved in SDS‐PAGE and electrotransferred to nitrocellulose paper. The blot was then probed with mAb‐hCSP1#4. As shown in lane 2 of WB in Figure 2, only a single band was detected at about 27 kDa and appeared to be human glycosylated CSP1. When the blot was probed with mAb‐hCSP1#14, a similar result was obtained (data not shown). In addition, various human tissues were immunohistochemically stained with mAb‐hCSP1#4 to visualize the localization of CSP1 and to verify the quality of mAbs. The only stained tissue among the 15 different human tissues examined was salivary gland, as shown in Figure 3. The other human tissues did not exhibit positive signals with mAb‐hCSP1#4, as shown in negative signals of pancreas, adrenal, and thyroid in Figure 3.
Figure 2.
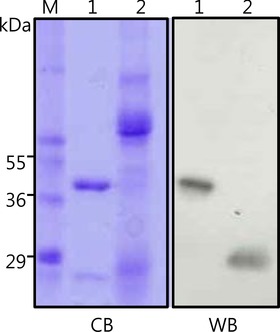
Detection of CSP1 in saliva with the produced mAb against rhCSP1. CB is a Coomassie Blue‐stained SDS gel containing molecular‐size marker (lane M), purified GST‐tagged rhCSP1 as a positive control (lane 1), and human saliva (lane 2). WB is a corresponding immunoblot of CB probed with mAb‐hCSP1#4. The GST‐tagged rhCSP1 of 45 kDa was detected as shown in lanes 2 and 3. A single band at approximately 27 kDa was detected and appeared to be glycosylated CSP1.
Figure 3.

Immunohistochemical localization of CSP1 in various human tissues. The various human tissue section slides were probed with mAb‐hCSP1#4, and the distribution of CSP1 was examined. The only stained tissue was salivary gland, with no positive signals detected in thyroid and adrenal tissue.
Standard Curve and Measurement of CSP1 in Sera by ELISA
Before measuring the CSP1 level in serum by a sandwich ELISA system, a standard curve was obtained with different concentrations of rhCSP1 (0–200 ng/ml). In the standard curve, the OD value at 450 nm was plotted on the y‐axis against the rhCSP1 concentration on the x‐axis. In order to detect a standard protein of rhCSP1, mAb‐hCSP1#14 and mAb‐hCSP1#4 were used as capture Ab and detector Ab, respectively. A reliable Pearson's correlation coefficient (r2 = 0.998) was observed between the two parameters, indicating good linearity throughout the entire measuring range (Fig. 4). Serum CSP1 concentrations of 31 DM patients and 38 healthy adults were quantified based on the standard curve created by the custom‐fabricated CSP1 sandwich ELISA system. Figure 5 shows the profiles of serum CSP1 concentration in DM patients and healthy adults. The profiles demonstrate a larger amount of CSP1 in the serum of DM patients than in healthy individuals. The median values (25th–75th percentile) of DM patients and healthy adults were 22.2 (15.8–28.2) and 3.2 (0–11.4), respectively. Student's t‐test results showed statistically significant differences between the two groups at P < 0.01.
Figure 4.
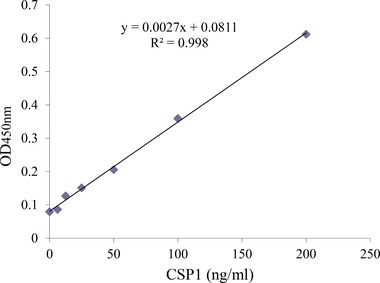
Standard curve of ELISA system for measurement of CSP1 in human sera. MAb‐hCSP1#14 and mAb‐hCSP1#4 generated as a part of this study were used as capture Ab and detector Ab, respectively, and the rhCSP1 was used as a standard protein. A reliable correlation of coefficient was observed between the OD450nm value and rhCSP1 concentration (r2 = 0.998), and good linearity was displayed throughout the entire measuring range.
Figure 5.
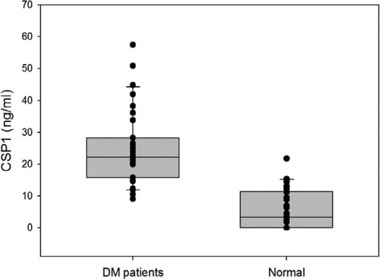
The profiles of serum CSP1 concentration in DM patients and healthy adults. After immobilizing mAb‐hCSP1#14 on the ELISA plate, serum was added, and CSP1 concentration in the serum was quantified by probing with mAb‐hCSP1#4. The profiles show that there was a larger amount of the CSP1 in serum of DM patients than in serum of healthy individuals. The median values (25th–75th percentile) of DM patients and healthy adults were 22.2 (15.8–28.2) and 3.2 (0–11.4), respectively. Student's t‐test shows that P‐value is statistically significant (P < 0.01). The central box and the middle line of each graph represent the values from the lower to upper quartiles (25th–75th percentile) and median, respectively. The horizontal line extends from the minimum to the maximum value, excluding outside values that are displayed as separate points. A defined outside value is one smaller than the 10th percentile or larger than the 90th percentile.
Discussion
In this study, we expressed rhCSP1 as a GST‐tagged protein in a bacterial system, purified it using a GST agarose affinity column, and then used the purified fusion protein as an immunogen to produce mAbs from mouse. The generated mAbs were tested for quality by immunoblotting with human saliva (Fig. 2) and immunohistochemistry with human tissue sections (Fig. 3). Furthermore, the serum concentrations of CSP1 between DM patients and normal healthy adults were measured by a sandwich ELISA system, custom‐fabricated with capture mAb‐hCSP1#14 and detector mAb‐hCSP1#4, and the results of the serum concentrations of CSP1 were compared and analyzed (Fig. 5).
In rat, three CSPl isoforms of molecular weights 16,000, 20,000, and 22,000 were identified in salivary gland secretions, and the differences in weight were not due to different genes but were possibly caused by N‐glycosylation of posttranslational modifications 12. In the case of mouse, the ortholog of human CSP1, named Dcpp, has three forms, SPT1, SPT2, and SPT3, encoded by different genes that are closely linked in the T‐complex region of chromosome 17 11. When the purified rhCSP1 as a fusion protein with GST was subjected to SDS‐PAGE and Western blot analysis, its molecular weight was estimated to be about 44 kDa (Fig. 1), indicating that the size of the CSP1 portion was approximately 18 kDa. However, mAbs recognized one single band at about 27 kDa in human saliva, as shown in lane 2 of WB in Figure 2. A possible explanation for this discrepancy is that human CSP1 may exist as a phosphorylated form or a glycosylated form in saliva. However, the fact that the human CSPl sequence contains one potential N‐glycosylation site makes the latter possibility more likely 11. That only a single band of CSP1 was detected in human saliva by Western blot analysis (Fig. 2) supports the claim that HRPE773 is the human ortholog of the CSP1/Dcpp family 11.
The results of the immunohistochemical assay showed that human CSP1 is a salivary gland‐specific protein, and that it was below the level of detection in other tissues including exocrine/endocrine glands, such as pancreas, thyroid, and adrenal (Fig. 3). As far as we know, this is the first immunohistochemical image of antihuman CSP1 Ab in human salivary glands and other tissues. The expression profile of CSP1 in various human tissues was consistent with those of CSP1 in other organisms examined in previous research. Girard et al. 12 reported that CSP1 transcripts measured by Northern blot analysis were detected in the major rat salivary glands but not in the nonsalivary organs of liver, kidney, and pancreas. Mullins et al. 11 also demonstrated no signal for CSP1 mRNA from various mouse organs including pancreas, adrenal gland, liver, heart, and kidney but predominant expression in the sublingual gland. The similar expression profiles of CSP1 from different mammalian organisms indicate that CSP1 is a highly tissue‐specific protein and may have common functions that remain unknown.
The means (SD) of serum CSP1 concentrations of 31 DM patients and 38 normal adults were 24.87 (11.86) ng/ml and 5.67 (6.53) ng/ml, respectively (Fig. 5), and the analysis of results showed that the difference in CSP1 level between the two groups was statistically significant (P < 0.01). The accuracy of CSP1 ELISA system was accessed by area under receiver operating characteristic (ROC) curve (AUC) to check how well the test separated two different groups (Fig. 6). The AUC was 0.940 (P < 0.0001), and sensitivity and specificity was determined to be 83.87 and 89.47, respectively. Since 0.9–1.0 of AUC means diagnostic test is an excellent tool according to traditional academic point system, the CSP1 ELISA test would be considered to be “excellent” at separating DM patients from normal individuals. This significant difference indicates that CSP1 is a potential biomarker for detection or screening of DM patients. However, a well‐controlled, sophisticated, and much larger cohort study 17 is required to conclusively claim that CSP1 can be used as a biomarker for DM. This study was a blind test in terms of information on the participants, except that the volunteers belonged to either a DM patient group or a healthy normal group. In other words, the sera obtained from DM patients and healthy adults were not strictly controlled. Thus, the medications taken by DM patients could have affected their levels of CSP1, and any oral diseases present could have elevated the serum level of CSP1. At this point, the cause of the much higher level of CSP1 in DM patients compared to normal adults is unknown.
Figure 6.
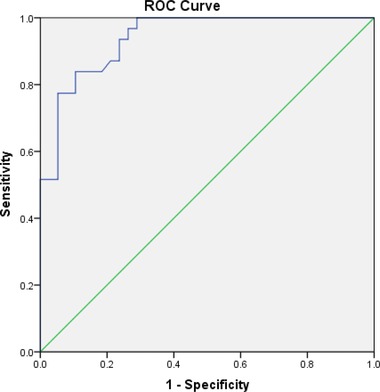
The ROC curve for CSP1 ELISA test in DM patients and healthy adults. AUC was 0.940 (P < 0.0001). Optimal criterion was >14.4, and sensitivity and specificity was determined to be 83.87 and 89.47, respectively.
Even though the mechanisms through which CSP1, which is a part of normal salivary secretions, appears in serum are unknown, the ways in which serum proteins cross to the saliva could be reversely applied. It has been shown that transport of molecules from serum to saliva occurs by transcellular (passive and active transport) and paracellular routes (ultrafiltration) 18. Many cases involve detection of a biomarker for a specific disease in both the saliva and serum. For example, higher concentrations of salivary defensin‐1 were detected in patients with oral squamous cell carcinoma compared with healthy controls. A high‐positive correlation was observed between salivary defensin‐1 level and serum level of squamous cell carcinoma‐related Ag 19. The soluble fragments of the c‐erbB‐2 oncogene, which is a prognostic breast cancer marker, and the cancer Ag 15‐3 were significantly higher in the saliva and sera of women who had cancer than in those of healthy controls and patients with benign tumors 20.
We have already begun an additional study to investigate whether salivary and serum CSP1 levels have a positive correlation and if the salivary level of CSP1 shows any significant difference between DM patients and healthy controls. If these possibilities turn out to be true, diagnosis and screening of DM would be more accessible due to the advantages of saliva including noninvasiveness, safety, and simplicity 21.
In conclusion, we used GST‐tagged rhCSP1 as an immunogen to produce mAbs from mouse. Glycosylated human CSP1 was detected in saliva as a 27 kDa single band by probing with mAb‐hCSP1#4 by immunoblotting, and salivary gland was the only tissue among the various human tissues examined that stained with mAb in immunohistochemistry. The means (SD) of CSP1 serum level in DM patients and healthy controls were 24.87 (11.86) ng/ml and 5.67 (6.53) ng/ml, respectively, and thus there was a statistically significant difference in CSP1 level between the two groups (P < 0.01) by a sandwich ELISA system. The results indicate that CSP1 would be a potential biomarker for detection and screening of DM patients.
References
- 1. Anderson L. Candidate‐based proteomics in the search for biomarkers of cardiovascular disease. J Physiol 2005;563:23–60. [DOI] [PMC free article] [PubMed] [Google Scholar]
- 2. Anderson NL, Anderson NG. The human plasma proteome: History, character, and diagnostic prospects. Mol Cell Proteomics 2002;1:845–867. [DOI] [PubMed] [Google Scholar]
- 3. Issaq HJ, Xiao Z, Veenstra TD, Serum and plasma proteomics. Chem Rev 2007;107:3601–3620. [DOI] [PubMed] [Google Scholar]
- 4. Thadikkaran L, Siegenthaler MA, Crettaz D, Queloz PA, Schneider P, Tissot JD. Recent advances in blood‐related proteomics. Proteomics 2005;5:3019–3034. [DOI] [PubMed] [Google Scholar]
- 5. Thompson IM, Pauler DK, Goodman PJ, et al. Prevalence of prostate cancer among men with a prostate‐specific antigen level < or = 4.0 ng per milliliter. N Engl J Med 2004;350(22):2239–2246. [DOI] [PubMed] [Google Scholar]
- 6. Stamey TA, Yang N, Hay AR, McNeal JE, Freiha FS, Redwine E. Prostate‐specific antigen as a serum marker for adenocarcinoma of the prostate. N Engl J Med 1987;317:909–916. [DOI] [PubMed] [Google Scholar]
- 7. Grant GH, Butt WR. Immunochemical methods in clinical chemistry. Adv Clin Chem 1970;13:383–466. [DOI] [PubMed] [Google Scholar]
- 8. Lentner C. Physical chemistry, composition of blood, hematology, somatometric data Lentner C. (ed.). Geigy Scientific Tables, eighth edition, NJ: West Caldwell; 1981. p 165–177. [Google Scholar]
- 9. Wilmarth PA, Riviere MA, Rustvold DL, Lauten JD, Madden TE, David LL. Two‐dimensional liquid chromatography of the human whole saliva proteome. J Proteome Res 2004;3:1017–1023. [DOI] [PubMed] [Google Scholar]
- 10. Yao Y, Berg EA, Costello CE, Troxler RF, Oppenheim FG. Identification of protein components in human acquired enamel pellicle and whole saliva using novel proteomics approaches. J Biol Chem 2003;278:5300–5308. [DOI] [PubMed] [Google Scholar]
- 11. Mullins JJ, Mullins LJ, Dunbar DR, Brammar WJ, Gross KW, Morley SD. Identification of a human ortholog of the mouse Dcpp gene locus, encoding a novel member of the CSP‐1/Dcpp salivary protein family. Physiol Genomics 2006;28:129–140. [DOI] [PubMed] [Google Scholar]
- 12. Girard LR, Castle AM, Hand AR, Castle JD, Mirels L. Characterization of common salivary protein 1, a product of rat submandibular, sublingual, and parotid glands. J Biol Chem 1993;268:26592–26601. [PubMed] [Google Scholar]
- 13. Kim SA, Lee Y, Jung DE, et al. Pancreatic adenocarcinoma up‐regulated factor (PAUF), a novel up‐regulated secretory protein in pancreatic ductal adenocarcinoma. Cancer Sci 2009;100:828–836. [DOI] [PMC free article] [PubMed] [Google Scholar]
- 14. Ambatipudi KS, Hagen FK, Delahunty CM, et al. Human common salivary protein 1 (CSP‐1) promotes binding of Streptococcus mutans to experimental salivary pellicle and glucans formed on hydroxyapatite surface. J Proteome Res 2010;9(12):6605–6614. [DOI] [PMC free article] [PubMed] [Google Scholar]
- 15. Towbin H, Staehelin T, Gordon J. Electrophoretic transfer of proteins from polyacrylamide gels to nitrocellulose sheets: Procedure and some applications. Proc Natl Acad Sci 1979;76:4350–4354. [DOI] [PMC free article] [PubMed] [Google Scholar]
- 16. Ha SG, Park JB, Ko KH, Choi, EY . Production and characterization of isotype‐specific monoclonal antibodies to bovine brain Rab GDI. Hybridoma 1999;18:371–376. [DOI] [PubMed] [Google Scholar]
- 17. Hansen TV, Simonsen MK, Nielsen FC, Hundrup YA. Collection of blood, saliva, and buccal cell samples in a pilot study on the Danish nurse cohort: Comparison of the response rate and quality of genomic DNA. Cancer Epidemiol Biomarkers Prev 2007;16:2072–2076. [DOI] [PubMed] [Google Scholar]
- 18. Haeckel R, Hanecke P. Application of saliva for drug monitoring. An in vivo model for transmembrane transport. Eur J Clin Chem Clin Biochem 1996;34:171–191. [PubMed] [Google Scholar]
- 19. Mizukawa N, Sugiyama K, Fukunaga J, et al. Defensin‐1, a peptide detected in the saliva of oral squamous cell carcinoma patients. Anticancer Res 1998;18:4645–4649. [PubMed] [Google Scholar]
- 20. Streckfus C, Bigler L, Tucci M, Thigpen JT. A preliminary study of CA15‐3, c‐erbB‐2, epidermal growth factor receptor, cathepsin‐D, and p53 in saliva among women with breast carcinoma. Cancer Invest 2000;18:101–109. [DOI] [PubMed] [Google Scholar]
- 21. Kaufman E, Lamster IB. The diagnostic applications of saliva—A review. Crit Rev InOral Biol Med 2002;13(2):197–212. [DOI] [PubMed] [Google Scholar]


