Abstract
Background
Mild acute pancreatitis (MAP) is a common acute abdominal disease, and exhibits rising incidence in recent decades. As an important component of systemic biology, metabonomics is a new discipline developed following genomics and proteomics. In this study, the objective was to analyze the serum metabonomics of patients with MAP, aiming to screen metabolic markers with potential diagnostic values.
Methods
An analysis platform with ultra performance liquid chromatography‐high‐resolution mass spectrometry was used to screen the difference metabolites related to MAP diagnosis and disease course monitoring.
Results
A total of 432 endogenous metabolites were screened out from 122 serum samples, and 49 difference metabolites were verified, among which 12 difference metabolites were identified by nonparametric test. After material identification, eight metabolites exhibited reliable results, and their levels in MAP serum were higher than those in healthy serum. Four metabolites exhibited gradual downward trend with treatment process going on, and the differences were statistically significant (P < 0.05).
Conclusion
Metabonomic analysis has revealed eight metabolites with potential diagnostic values toward MAP, among which four metabolites can be used to monitor the disease course.
Keywords: metabonomics, acute pancreatitis, cholelithiasis, liquid chromatography, mass spectrometry
Introduction
Mild acute pancreatitis (MAP) is a common acute abdominal disease, and exhibits rising incidence in recent decades. Clinically, the course of about 80% of MAP patients exhibits self‐limiting, and 20–30% of patients may exhibit more dangerous clinical courses. The overall mortality rate is about 5–10% 1. There are many causes for pancreatitis, and the most common causes are gallstone transferring induced duct blockage and excessive alcohol intake caused pancreatic damages. Though there still exists controversy, most scholars still recognize that the direct course of pancreatitis is the uncontrolled activation of trypsin in pancreatic acinar cells 2.
MAP has rapid onset and critical conditions 3. The main clinical indication of the vast majority of MAP patients is acute upper abdominal pain, which, in nearly half of the patients, will radiate to back. The onset is fast, and the pain will normally reach the peak within 30 min, which is often difficult to be tolerated, and lasts for more than 24 h while without remission. The increased contents of serum amylase and lipase enzyme are generally used as the basis for initial diagnosis. Unfortunately, the specificity and accuracy of these two clinical indicators are not high enough. Therefore, they can only be used as auxiliary diagnostic markers. As an important component of systemic biology, metabonomics is a new discipline developed following genomics and proteomics, with the concept as "quantitatively determining the dynamic impacts of pathophysiological stimuli or genetic alteration on multiple metabolic indicators in living systems” 4. Through identifying as many metabolites from samples as possible, the metabolic outlines in different body conditions are thus analyzed 5, 6, expecting to find one or a group of specific and sensitive metabolites to describe and distinguish different states of biological system 7. Lusczek et al. 8 have used magnetic resonance imaging (MRI) to scan the metabolic outlines of patients with MAP and chronic pancreatitis (CP). After comparison with those from the healthy control group, five metabolic ions that can distinguish the patients with pancreatitis from healthy people are found, while no metabolite that can distinguish acute and CP is found. This experiment still has some limitations due to the small sample amount, but it has opened up new ideas for the metabonomic study of pancreatitis, and laid certain foundation for the methodology study. This study used ultra performance liquid chromatography‐high‐resolution mass spectrometry (UPLC‐HRMS) as the analytical platform, and used metabonomic method to analyze the serum metabolic outlines of patients with MAP, cholelithiasis (CHO), as well as that of healthy volunteers. The objective was to identify metabolites and potential biomarkers that were closely related to pancreatitis and provide a basis for the diagnosis, treatment, course monitoring, and prognosis judgment of pancreatitis.
Materials and Methods
Study Objects
Thirty‐eight MAP patients, diagnosed and admitted to the Department of Hepatobiliary Surgery, Tianjin Third Central Hospital (Tianjin, China), from May 2012 to December 2012, were selected; the diagnosis met the diagnostic and classification criteria of pancreatic diseases, Chinese Medical Association of Gastroenterology (2004) 9. Among the 38 MAP patients, 18 cases were males and 20 cases were females, aged 50 ± 16 years. Another 26 patients, who were admitted in the same period and diagnosed with CHO while without complicating acute pancreatitis and neoplastic disease by clinical manifestations, ultrasound, CT, MRI, and cholangiopancreatography, were selected and set as the CHO group, including 12 males and 14 females, aged 59 ± 17 years old. Thirty‐six healthy volunteers were also enrolled in the same period as the control (NOR), 16 males and 20 females, aged 51 ± 16 years. The activities of serum amylase in groups MAP, CHO, and NOR, when admitted, were 1,170 ± 1,823, 5,230 ± 74, and 67 ± 26 IU/l, respectively. The activities of lipase were 1,234 ± 2,214, 642 ± 556, and 41 ± 9 IU/l, respectively. The activities of pancreatic amylase were 692 ± 1,127, 3,751 ± 366, and 21 ± 11 IU/l, respectively. Eleven MAP patients were selected for the disease course tracking during their hospitalization, and their sera were sampled when admitted, in the medium term of treatment (D6 of treatment), and when discharged. The test results are shown in Table 1. This study was approved and authorized by the Ethics Committee of Clinical Research, Tianjin Third Central Hospital. All patients and healthy volunteers or their families were informed before sampling their serum samples.
Table 1.
Changes of Serum, Urine, and Pancreatic Diastase and Lipase at Different Stages in 11 MAP Patients (IU/l, mean ± SD)
| Test item | When admitted | D6 | When discharged |
| Serum amylase | 886.12 ± 437.78 | 189.50 ± 104.82 | 54.5 ± 45.31 |
| Urine amylase | 4,785.12 ± 3,936.5 | 562.12 ± 274.16 | 180.62 ± 140.08 |
| Pancreatic amylase | 711.5 ± 331.83 | 102.75 ± 40.48 | 46.62 ± 24.46 |
| Lipase | 1,124.01 ± 520.39 | 212.62 ± 59.52 | 97.37 ± 34.77 |
UPLC‐HRMS Analysis
Fasting venous blood was sampled from groups MAP and CHO on the next morning of admission. Eleven MAP patients’ sera were also sampled on the medium time point of treatment (the sixth day, D6) and when discharged, and the healthy volunteers’ venous blood was sampled after 12‐h fasting. Blood samples were centrifuged to separate serum, then cryopreserved at –80°C. The samples were defrosted at room temperature before analysis. A total of 100 μl serum was mixed with 300 μl of methanol, and then was vigorously shaken for 30 s and stood at 4°C for 5 min. After centrifugation (12,000 × g, 4°C) for 15 min, the supernatant was loaded for the analysis.
Accela UHPLC system was provided by Thermo Fisher Scientific (MA), with Thermo Hypersil GOLD C18 reverse‐phase column (2.1 mm id × 50 mm × 1.9 μm). The temperature in autosampler was set at 4°C, with oven temperature 20°C and injection volume 10 μl. After loading, the sample was gradiently eluted with binary solvents. A total of 0.1% formic acid and 0.1% formic acid in acetonitrile were used as the mobile phase A and B, respectively. The elution was started with 95% A–5% B, eluted for 3.5 min, and then linearly decreased mobile A from 95% to 5%. The mobile B content was linearly increased from 5% to 95% within 10 min, and maintained for 3 min, and then was rapidly replaced by the initial content for 3.5‐min elution to balance the column. The total chromatographic elution process was 20 min, with the flow rate of 200 μl/min.
LTQ Orbitrap XL hybrid mass spectrometer system was provided by Thermo Fisher Scientific, with positive ion scanning mode (ion source voltage 4.5 kV, capillary voltage 30 V, cone voltage 150 V, desolvation temperature 350°C, sheath gas flow rate 30 arb [99.999% nitrogen], secondary gas flow rate 5 arb [99.999% nitrogen]). The MS data during 20‐min chromatographic elution were acquired, with acquisition range of m/z 50–1,000 and mass resolution of 100,000 (FMHW). The secondary mass detection used collision‐induced dissociation (CID) mode, with the energy of 35 (standardized collision energy), and the collision gas was high‐purity helium (99.9999% helium).
Screening and Identification of Difference Metabolites
MZmine 2.0 software 10 was used to extract ion chromatograms from data according to signal noise ratio (S/N) >10, with the offset of retention time (RT) not exceeding ±0.2 min and the deviation of mass‐to‐charge ratio (m/z) not exceeding ±0.02. The peaks obtained were then performed with the identification, matching, and normalization. The relative contents of serum metabolites were expressed as peak area integration. The data were imported into SIMCA‐P + 12.0.1.0 software 11 (Umetrics, Umeå, Sweden) to construct the models of principal components analysis (PCA) and orthogonal partial least squares discriminant analysis (OPLS‐DA) 12 by pattern recognition method. The screening of potential markers was based on the contribution degrees (VIP, very important) and VIP confidence intervals of different‐content metabolic ions toward model building, excluding the metabolites with VIP >1, while containing zero in VIP figure and confidence interval of coefficient figure; then the loading figure was used to ensure the screened metabolites have greater changing degree and higher reliability for the initial screening of potential difference metabolites 12. The accurate m/z values of difference metabolites were used to search HMDB database (http://hmdb.ca/), and the searching results were verified in accordance with the rules as follows: m/z value deviation should not exceed 0.01, together with the ionization formula that had accurate charges consistent with the experimental conditions. The identification results that matched the requirements were reserved. Meanwhile, the difference metabolites were performed MS/MS scanning. The secondary MS spectra obtained were compared with Mass Frontier 6.0 software‐simulated theoretical debris of HMDB identification results, and the deviation between the characteristic secondary ion (m/z) and that of theoretical fragment should not exceed 0.2 (the secondary MS fragmentation was produced by ion trap CID pattern). The difference metabolites were identified based on the following principles: the theoretical fragments should exhibit three strong peaks matching with the secondary characteristic fragments, and should be able to cover more than 80% of secondary characteristic fragments.
Statistical Analysis
SPSS 17.0 software was used for statistical analysis. The counting data were expressed as mean ± SD, the intragroup comparison used t‐test; the screened difference metabolites were performed independent samples nonparametric test. Meanwhile, WEKA software was used to build support vector machine (SVM) classification model 13, 14, and the diagnostic values of the difference metabolites toward MAP were judged by receiver operating characteristic (ROC) curve, with P <0.05 considered as statistically significant.
Results
Total Ion Chromatogram and Analysis of PCA and OPLS‐DA Model
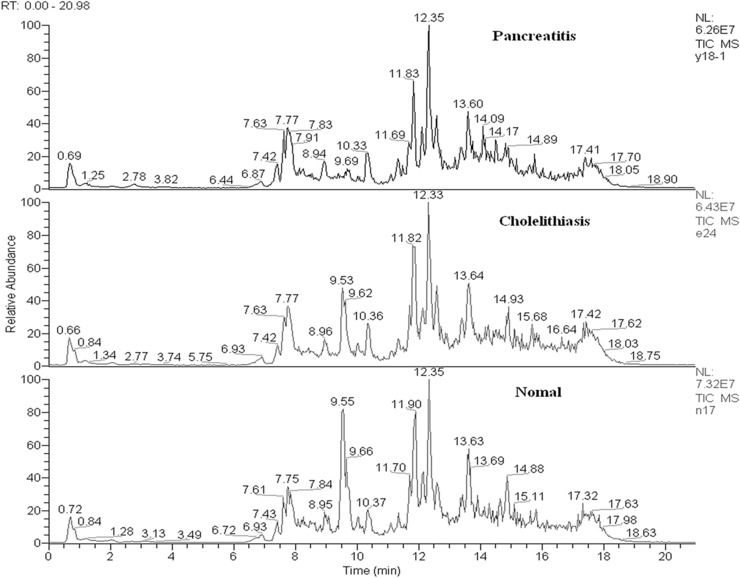
The total ion chromatograms (TICs) of groups MAP, CHO, and NOR are shown in Figure 1. A total of 432 endogenous metabolites were extracted from the 122 serum samples of these three groups, and each metabolite ion had its specific m/z and RT.
Figure 1.

TIC of serum samples from the three groups.
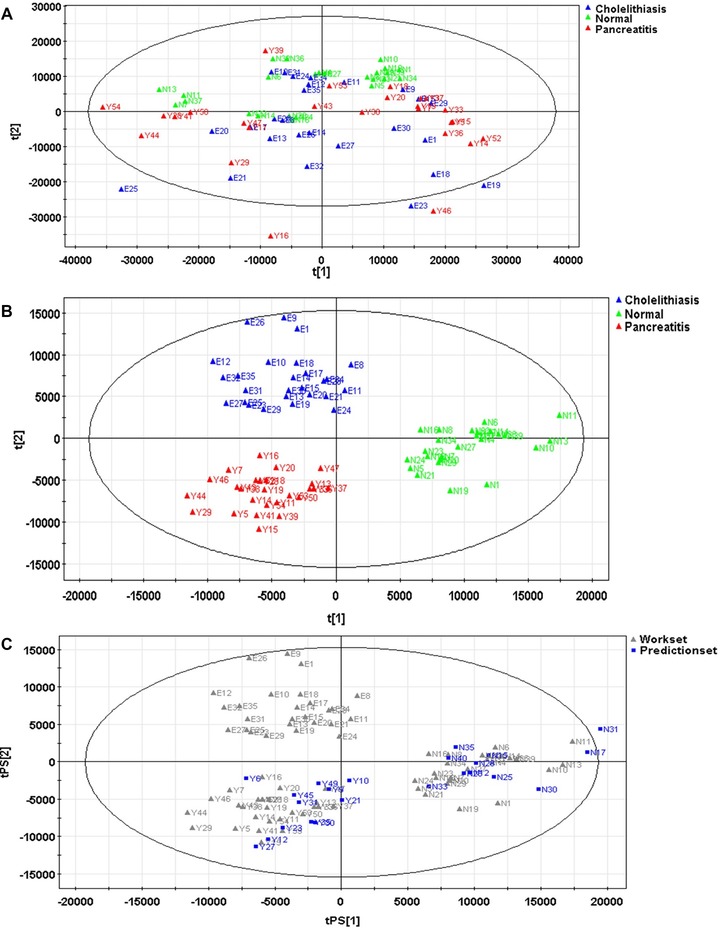
Seventy percent of serum samples were randomly selected from each group as the model group, while the rest 30% were set as the validation group. The PCA model constructed by the serum samples of the model group exhibited ten primary ingredients (R2X = 77.1%, Q2 = 23.5%; Fig. 2a); the serum metabolites of groups MAP and NOR exhibited certain tendency of distinguishing clustering; the OPLS‐DA model constructed contained two main predictive ingredients and five orthogonal principal components (R2X = 58.7%, R2Y = 84.0%, Q2 = 62.8%; Fig. 2b); the samples of these three groups exhibited clear distinguishing clustering, as well as good fitting and predictive abilities. When applying the predictive power of OPLS‐DA model constructed by the serum samples of the validation group for verification, all serum samples could be correctly included into the grouped clustering, indicating that the predictive accuracy of the model was 100% (Fig. 2c).
Figure 2.

PCA model (A) and OPLS‐DA model (B) constructed by the samples of model group, and OPLS‐DA model constructed by the samples of validation group (C).
Screening and Identification of Difference Metabolites
A total of 49 difference metabolites were screened out from the extracted 432 metabolites. The nonparametric test showed that there existed 12 difference metabolites with statistical significance between groups MAP and CHO or NOR, among which sphingasine, capryloyl choline, glycocholic acid, myristic acid, decanoyl choline, dodecanol, 2‐tetradecanone, and L‐thyronine were reliably identified. Their serum levels in group MAP were increased compared with group NOR. Compared with group CHO, the serum contents of sphingasine, capryloyl choline, myristic acid, decanoyl choline, dodecanol, and 2‐tetradecanone were significantly increased, while those of glycocholic acid and L‐thyronine were significantly decreased, and the differences were all statistically significant (P < 0.05, Table 2).
Table 2.
Identification and Relative Contents of Difference Metabolites
| Relative content | |||||
| No. | Name | m/z | RT/min | MAP/CHO | MAP/NOR |
| Var‐8 | Sphinganine | 302.305 | 11.317 | ↑b | ↑b |
| Var‐431 | Capryloyl choline | 313.273 | 12.264 | ↑b | ↑b |
| Var‐284 | Glycocholic acid | 466.315 | 9.36002 | ↓a | ↑b |
| Var‐22 | Myristic acid | 246.242 | 9.40278 | ↑b | ↑b |
| Var‐131 | Unidentified | 612.411 | 13.9801 | ↓a | ↓b |
| Var‐40 | Unidentified | 337.115 | 9.206 | ↓a | ↑b |
| Var‐110 | Unidentified | 100.075 | 1.17803 | ↑b | ↓b |
| Var‐91 | Decanoyl choline | 341.304 | 13.4161 | ↑b | ↑b |
| Var‐71 | Dodecanol | 228.231 | 9.4611 | ↑b | ↑b |
| Var‐293 | 2‐Tetradecanone | 230.247 | 10.3937 | ↑b | ↑b |
| Var‐104 | L‐thyronine | 315.133 | 9.2444 | ↓a | ↑b |
| Var‐172 | Unidentified | 163.034 | 1.78994 | ↑b | ↑b |
Two independent samples nonparametric test,
P < 0.05
P < 0.01.
Clinical Diagnostic Value of Difference Metabolites
The screened 12 difference metabolites were used to construct the level‐two SVM classification model between groups MAP (26 cases) and CHO (26 cases), as well as between groups MAP (26 cases) and NOR (36 cases). The kernel function of both two models was RBFkernel. Both the sensitivity and accuracy achieved by tenfold cross‐validation of SVM were 100%, and no false‐positive case appeared, indicating that difference metabolites had great potential clinical values toward the diagnosis and differentiation of MAP.
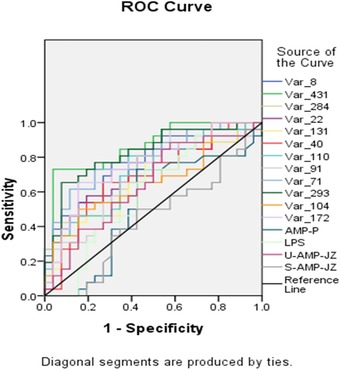
The ROC curves that assessed the screened 12 difference metabolites and commonly laboratory tests such as blood, urine, pancreatic amylase, and lipase are shown in Figure 3. AUCs of the 12 difference metabolites were higher than the commonly used laboratory indicators, among which the diagnostic value of capryloyl choline was the highest, with its AUC as high as 0.865.
Figure 3.

ROC curves of two difference metabolites, as well as pancreatic amylase (AMP‐P), lipase (LPS), urine amylase (U‐AMP), and serum amylase (S‐AMP) in diagnosing MAP.
Correlations of Difference Metabolites and Disease Changes
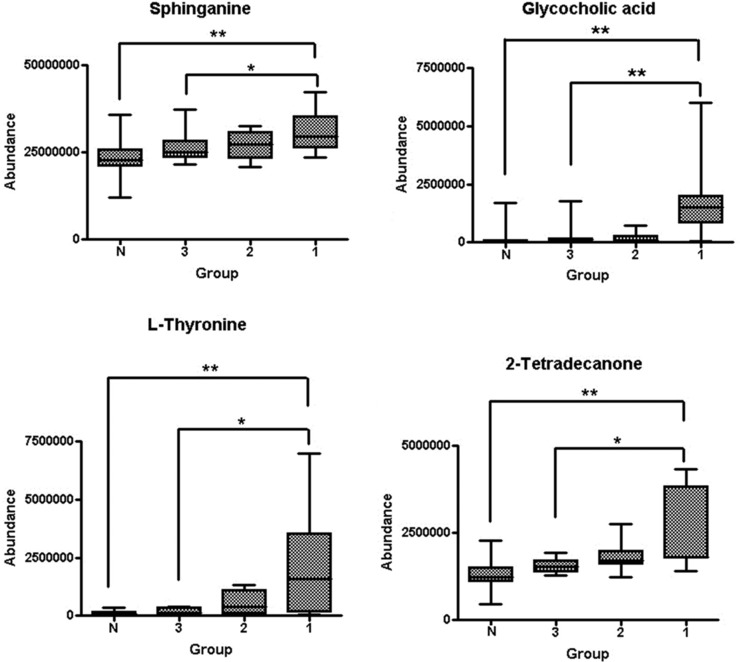
The OPLS‐DA model constructed by dynamic tracking serum samples of 11 MAP patients and group NOR contained a predictive main component and two orthogonal principal components (R2X = 41.5%, R2Y = 35.7%, Q2 = 24.2%; Fig. 4). With treatment going on, the contents of difference metabolites in MAP patients showed a gradual recovery trend, which gradually approached to those in healthy population. The comparison of serum difference metabolites between groups MAP and NOR showed that the four metabolites, namely, sphinganine, L‐thyronine, glycocholic acid, and 2‐tetradecanone, exhibited a gradual decreasing trend with treatment going, which gradually approached to the normal levels (Fig. 5). There existed significant decrease between the values when admitted and when discharged, and the differences were statistically significant (P < 0.05).
Figure 4.

OPLS‐DS figures of serum difference metabolites in MAP patients when admitted 1, on D6 2, and when discharged 3.
Figure 5.

Changes of relative contents of serum sphinganine, L‐thyronine, glycocholic acid, and 2‐tetradecanone in MAP patients when admitted 1, on D6 2, and when discharged (3; N, group NOR. **Two independent samples nonparametric test, P < 0.01; *two independent samples nonparametric test, P < 0.05).
Discussion
Currently, although the clinical diagnostic accuracy of MAP is higher than before, it is still easily confused with many diseases, such as cholecystitis, biliary ascariasis, gastric and duodenal ulcerative perforation, renal colic, coronary heart disease or myocardial infarction, especially CHO and cholecystitis, which are usually distinguished based on different increasing folds of serum amylase and lipase in clinical tests. However, the specificity of this method is not high, so it will be easy to cause misdiagnosis when lacking the support of imaging. Therefore, improving the diagnosis, treatment, course monitoring, and prognosis judgment of MAP will undoubtedly exhibit great significance.
Lusczek et al 8 have applied MRI to scan the metabonomics of urine samples of patients with mild AP and CP, and compared with those of healthy control group. Five metabolites that can distinguish CP patients from healthy volunteers have been found, while no metabolite that can distinguish AP from CP has been found. This study is limited by the amount of samples, but it has opened a new way for the metabonomics of pancreatitis, and laid certain methodological foundation at the same time.
This study used UPLC‐HRMS analysis platform to perform metabonomic analysis toward patients with MAP, or CHO, as well as healthy volunteers, and 11 MAP patients were performed with longitudinal course tracking. A total of 432 endogenous metabolites were extracted from serum samples, among which PCA model and OPLS‐DA model screened out 49 difference metabolites, and the nonparametric test revealed 12 difference metabolites among the three groups. Their AUCs were all greater than those of commonly used laboratory indicators, namely, amylase and lipase. After identification, the reliable results were sphinganine, capryloyl choline, glycocholic acid, myristic acid, decanoyl choline, dodecanol, 2‐tetradecanone, L‐thyronine, and so on, of which the serum levels were significantly increased in MAP compared with those in healthy volunteers. Compared with group CHO, the serum levels of sphinganine, capryloyl choline, glycocholic acid, myristic acid, decanoyl choline, and 2‐tetradecanone were increased significantly, while the serum contents of glycocholic acid and L‐thyronine were significantly decreased.
Sphinganine is an integral part of cell membrane, and in cell experiment and serum experiment, the concentration of sphingasine is positively correlated with the severity of inflammatory response 15, 16, 17, 18. The increased serum level of sphingasine may be caused by the tryptic hydrolysis‐induced rupture of lots of cells. Capryloyl choline and decanoyl choline belong to cholines, which are both the esterification products of choline and fatty acid under the roles of choline acetyltransferase 19. The choline metabolism pathway is an important pathway of inflammation responses. In mouse AP model, cholinesterase is positively correlated with the severity of AP, while choline acetyltransferase is negatively correlated with the severity of AP, which may cause the changes in serum level. Glycocholic acid is a component of bile acids, and its level is declined in CP patients 20. The results of this study showed that the level of glycocholic acid was increased in AP, which may be associated with the abnormal discharging of pancreatic secretions during the onset of AP. Myristic acid is a saturated fatty acid, and it will synthesize phosphatidic acid under the mediation of phospholipase D. During AP, the activity of phospholipase D is decreased, leading to the accumulation of myristic acid, so its serum level will be increased 21.
This study first found that the serum levels of decanoyl choline, dodecanol, and 2‐tetradecanone were increased in AP, while the reason was still not clear. These three difference metabolites also exhibited potential values in diagnosing AP, the same as other five previously reported difference metabolites. This study performed dynamic testing toward partial AP patients and found that the four metabolites, namely, sphinganine, L‐thyronine, glycocholic acid, and 2‐tetradecanone showed a gradual decreasing trend with treatment going on, which gradually approached to the normal levels. Therefore, they might be used as the metabolic biomarkers for the clinical course detection of AP. This study also has some limitations. The sample size is relatively small, and the disease types were not complete. In the next study, the sample size should be enlarged and the disease types should be broadened, for obtaining more satisfactory outcomes.
References
- 1. Kota SK, Krishna SV, Lakhtakia S, Modi KD. Metabolic pancreatitis: Etiopathogenesis and management. Indian J Endocrinol Metab 2013;7:799–805. [DOI] [PMC free article] [PubMed] [Google Scholar]
- 2. Frossard JL, Steer ML, Pastor CM. Acute pancreatitis. Lancet 2008;371:143–152. [DOI] [PubMed] [Google Scholar]
- 3. Bugdaci MS, Sokmen M, Zuhur SS, Altuntas Y. Lipid profile changes and importance of low serum alpha‐lipoprotein fraction (high‐density lipoprotein) in cases with acute pancreatitis. Pancreas 2011;40:1241–1244. [DOI] [PubMed] [Google Scholar]
- 4. Ramirez T, Daneshian M, Kamp H, et al. Metabolomics in toxicology and preclinical research. ALTEX 2013;30:209–225. [DOI] [PMC free article] [PubMed] [Google Scholar]
- 5. Wood PL. Mass spectrometry strategies for clinical metabolomics and lipidomics in psychiatry, neurology, and neuro‐oncology. Neuropsychophamacology 2014;39:24–33. [DOI] [PMC free article] [PubMed] [Google Scholar]
- 6. van Assche R, Temmerman L, Dias DA, et al. Metabolic profiling of a transgenic Caenorhabditis elegans Alzheimer model. Metabonomics 2015;11:477–486. [DOI] [PMC free article] [PubMed] [Google Scholar]
- 7. Steinfath M, Groth D, Lisec J, Selbig J. Metabolite profile analysis: From raw data to regression and classification. Physiol Plant 2008;132:150–161. [DOI] [PubMed] [Google Scholar]
- 8. Lusczek ER, Paulo JA, Saltzman JR, et al. Urinary 1H‐NMR metabonomics can distinguish pancreatitis patients from healthy controls. JOP 2013;14:161–170. [DOI] [PMC free article] [PubMed] [Google Scholar]
- 9. Zhang L, Li L, Kong H, Zeng F. Urinary metabonomics study of renal cell carcinoma based on gas chromatography‐mass spectrometry. Nan Fang Da Xue Xue Bao 2015;35:763–766 (in Chinese). [PubMed] [Google Scholar]
- 10. Katajamaa M, Oresic M. Processing methods for differential analysis of LC/MS profile data. BMC Bioinformatics 2005;6:179. [DOI] [PMC free article] [PubMed] [Google Scholar]
- 11. Liu SY, Zhang RL, Kang H, Fan ZJ, Du Z. Human liver tissue metabolic profiling research on hepatitis B virus‐related hepatocellular carcinoma. World J Gastroenterol 2013;19:3423–3432. [DOI] [PMC free article] [PubMed] [Google Scholar]
- 12. Yin PY, Wan DF, Zhao CX, et al. A metabonomic study of hepatitis B‐induced liver cirrhosis and hepatocellular carcinoma by using RP‐LC and HILIC coupled with mass spectrometry. Mol Biosyst 2009;5:868–876. [DOI] [PubMed] [Google Scholar]
- 13. Scott IM, Vermeer CP, Liakata M, et al. Enhancement of plant metabolite fingerprinting by machine learning. Plant Physiol 2010;153:1506–1520. [DOI] [PMC free article] [PubMed] [Google Scholar]
- 14. Denery JR, Nunes AA, Hixon MS, Dickerson TJ. Metabonomics‐based discovery of diagnostic biomarkers for onchocerciasis. PLoS Negl Trop Dis 2010;4:1150–1154. [DOI] [PMC free article] [PubMed] [Google Scholar]
- 15. El Alwani M, Wu BX, Obeid LM, Hannun YA. Bioactive sphingolipids in the modulation of the inflammatory response. Pharmacol Ther 2006;112:171–183. [DOI] [PubMed] [Google Scholar]
- 16. Loiseau N, Obata Y, Moradian S, et al. Altered sphingoid base profiles predict compromised membrane structure and permeability in atopic dermatitis. J Dermatol Sci 2013;72:296–303. [DOI] [PMC free article] [PubMed] [Google Scholar]
- 17. Roviezzo F, Brancaleone V, De Gruttola L, et al. Sphingasine‐1‐phosphate modulates vascular permeability and cell recruitment in acute inflammation in vivo. J Pharmacol Exp Ther 2011;337:830–837. [DOI] [PubMed] [Google Scholar]
- 18. Wang X, Lv H, Zhang A, et al. Metabolite profiling and pathway analysis of acute hepatitis rats by UPLC‐ESI MS combined with pattern recognition methods. Liver Int 2014;34:759–770. [DOI] [PubMed] [Google Scholar]
- 19. Schorsch C, Boles E, Schaffer S. Biotechnological production of sphingoid bases and their applications. Appl Microbiol Biotechnol 2013;97:4301–4308. [DOI] [PubMed] [Google Scholar]
- 20. Vinokurova LV, Valitova ER, Trubitsyna IE, Shustova SG, Iashina NI, Tkachenko EV. Impairment of humoral regulation of exocrine pancreatic function in chronic pancreatitis. Ter Arkh 2007;79:44–48. [PubMed] [Google Scholar]
- 21. Xue P, Huang ZW, Zhang HY, et al. Impact of Chai Qin Cheng Qi Decoction on cholinergic anti‐inflammatory pathway in rats with severe acute pancreatitis. Sichuan Da Xue Xue Bao Yi Xue Ban 2006;37:66–68. [PubMed] [Google Scholar]


