

Abstract
Aim
To reveal the serum proteomic profiling of intraductal carcinoma (IDC) patients in China, establish a serum proteome fractionation technique for choosing magnetic beads for proteomic analysis in breast cancer research; and identify differentially expressed peptides (m/z; P < 0.0001) as potential biomarkers of early IDCs.
Methods
We used two different kinds of magnetic beads (magnetic bead‐based weak cation exchange chromatography (MB‐WCX) and immobilized metal ion affinity chromatography (MB‐IMAC‐Cu)) to analyze 32 patients with early stage (stages I‐II) IDC and 32 healthy control serum samples for proteomic profiling by matrix‐assisted laser desorption/ionization time‐of‐flight mass spectrometry (MALDI‐TOF MS) analysis. The mass spectra, analyzed using ClinProTools software, distinguished between IDC patients and healthy individuals based on k‐nearest neighbor genetic algorithm.
Results
The serum samples purified in the MB‐WCX group provided better proteomic patterns than the MB‐IMAC‐Cu group. The samples purified by MB‐WCX had better average peak numbers, higher peak intensities, and better capturing ability of low abundance proteins or peptides in serum samples. In addition, the MB‐WCX and MB‐IMAC‐Cu purification methods, followed MALDI‐TOF MS identification and use of ClinProTools software accurately distinguished patients with early stage IDC from healthy individuals.
Conclusion
Serum proteomic profiling by MALDI‐TOF MS is a novel potential tool for the clinical diagnosis of patients with IDC in China.
Keywords: intraductal carcinoma, biomarker, MALDI‐TOF MS, MB‐WCX, MB‐IMAC‐Cu
INTRODUCTION
Breast cancer is the most common cancer in developed and developing countries. Approximately 690, 000 new cases have been estimated to occur in each country type in 2012, (population ratio = 1:4), with a high incidence (> 80 per 100,000) in developed countries (except Japan) and low (< 40 per 100,000) in most developing countries. Nevertheless, breast cancer is still the most frequent cause of cancer deaths in women in developing (269, 000 deaths; 12.7% of the total population) and developed countries. Invasive ductal carcinoma (IDC), which represents 80% of all breast cancer diagnoses, is the most common form of breast cancer. IDC, also known as infiltrating ductal carcinoma, indicates a tumor that began growing in the duct and has invaded the fatty tissue of the breast outside of the duct. IDC may migrate into other parts of the body via the bloodstream or lymphatic system if not treated at an early stage.
Early detection is essential in the optimal treatment of breast cancer. Indeed, early detection can improve the likelihood of successful treatment and recovery 1. It has been reported that the 5‐year survival rate of breast cancer patients is between 75% and 90% (http://seer.cancer.gov). However, modern imaging modalities, such as mammography, breast sonography, X‐rays, and CT scanning, either do not have a sufficient spatial resolution to effectively detect very small breast cancers 2 or are not sensitive enough to measure microangiogenesis in the very earliest stages of breast cancer 3, 4. Currently, mammographic screening is the most reliable method to detect breast cancers in asymptomatic patients. Although highly effective, mammographic screening has significant limitations, thus the development of more accurate, convenient, and objective detection methods is needed. Utilizing proteomic tools, it is possible to identify quantitative and qualitative protein patterns in a wide variety of tissues and body fluids, such as blood, urine, saliva, and cerebrospinal fluid, and establish specific diagnostic and prognostic biomarkers.
Biomarkers are potentially useful adjuncts to clinical management because biomarkers can increase diagnostic accuracy and facilitate optimal treatment. Use of quantitative biomarker‐based tests is more objective than clinical assessment because observer variation is minimized and quality assurance protocols in the laboratory improve reproducibility and reliability. Further improvement of early detection can be achieved with the use of blood‐based biomarkers. Such markers could indicate the presence of an early stage breast tumor before the lesion cannot be detected using mammography 5. A blood test is less expensive and easy to perform on a large scale. Peptidome analysis based on mass spectrometric screening methods, such as surface‐enhanced laser desorption/ionization time‐of‐flight (SELDI‐TOF) and MALDI‐TOF MS, is a promising high‐throughput approach for identifying new potential biomarkers in serum or other body fluids6, 7, 8. MALDI‐TOF MS has been widely applied to analyze serum samples for the diagnosis of human diseases and for the identification of potential biomarkers; however, different types of magnetic beads afford different purification capabilities for low abundance proteins and peptides in body fluids. To date, the most frequently used magnetic beads are MB‐WCX and MB‐IMAC‐Cu 9, 10, 11.
Thus, in this pilot study the serum proteomic profiles of 32 patients with IDC and 32 healthy controls were compared and analyzed. The goals of the current study were as follows: (1) determine the serum proteomic profiles of patients with IDC; (2) compare MB‐WCX with MB‐IMAC‐Cu purification capability in patients with IDC; (3) establish a proteome fractionation technique for choosing magnetic beads for proteomic analysis in breast cancer research; and 4) identify differentially expressed peptides (m/z; P < 0.0001) as potential biomarkers of early IDC.
MATERIALS AND METHODS
Patient Specimens and Sample Collection
This study was approved by the Ethics Committee and the Human Research Review Committee of Xi'an Jiaotong University. Sixty‐four serum samples were included in this study, of which 32 were collected from patients with IDC and 32 from healthy female volunteers to be used as controls. The samples were collected in the Tumor Hospital of Shaanxi province between May and December 2012. All of the patients were recently diagnosed, and had an average age of 49 years (range, 30–78 years), The 32 healthy volunteers ranged in age from 31 to 60 years (average age, 51 years). All blood samples were drawn while the patients or healthy controls were seated and fasting. The samples were collected in 10‐cc serum separator tubes and held at 4°C for 1 h, then centrifuged at 3,000 g at 4°C for 20 min. The serum samples were distributed into 500 μl aliquots and stored at −80°C until subsequent use.
Sample Preparation and MALDI‐TOF MS Analysis
To identify a better serum peptidome separation method, MB‐WCX and MB‐IMAC‐Cu ClinProt™ purification reagent sets of Bruker Daltonics, (Bremen, Germany) were separately used for protein separation for MALDI‐TOF MS analyses. Purification via MB‐WCX and MB‐IMAC Cu were performed according to the manufacturer's protocol for serum and a Bruker Magnetic Separator (8‐well, #65554). To prepare the MALDI target, we spotted 1 μl of a mixture containing 10 μl of 0.3 g/l α‐cyano‐4‐hydroxy cinnamic acid in 2:1 ethanol/acetone (v/v) and 1 μl of the eluted peptide fraction onto a MALDI AnchorChip™ (Bruker Daltonics) sample target platform (384 spots). To evaluate reproducibility, each serum sample was spotted for three repeats.
Air‐dried targets were measured immediately using a calibrated Autoflex III MALDI‐TOF MS (Bruker Daltonics) with FlexControl software (version 3.0; Bruker Daltonics), and optimized measuring protocols were established. Matrix suppression up to 1,000 Da, with a mass range of 1,000—10,000 Da, was set as the default. Instrument calibration parameters were determined using standard peptide and protein mixtures. All measurements were performed in a blinded manner, including patient and control sera in one mixed approach.
Data Processing With ClinProTools Software
Data analyses were performed using Flex analysis v3.0 and ClinProTools v2.2 (Bruker Daltonics). ClinProTools v2.2 uses a standard data preparation workflow, including spectra pretreatment, peak picking, and peak calculation operation, and was used to recognize peptide patterns in this study. For statistical analysis, a k‐nearest neighbor genetic algorithm, as implemented in this software suite, was used to identify statistically significant differences in protein peaks among the groups analyzed. The protein fingerprint data were analyzed using ClinProTools v2.2. Comparisons between patients with IDC and healthy controls were performed with the Wilcoxon test; statistical significance was assumed when the P value was < 0.001.
RESULTS
We analyzed the serum peptidome fingerprints of all 32 patients with IDC (all early stage disease) and 32 healthy controls. We evaluated changes at the peptidome level in the serum samples of 32 patients with IDC compared with 32 healthy controls in the training set. By analyzing the spectra (screened from two groups in the training set) using ClinProTools software 2.2, we were able to identify proteomic patterns that clearly distinguished between patients with IDC and healthy controls.
Peak Detection Based on MB‐WCX Versus MB‐IMAC‐Cu
The serum samples from the patients with IDC and healthy controls were purified using MB‐WCX and MB‐IMAC‐Cu, respectively. Mass spectrometry analysis indicated that there were 52 and 40 peaks, respectively, with signal‐to‐noise ratios >5 detected between mass to charge (m/z) 1,000–10,000 in the serum samples from the two groups (Fig. 1).
Figure 1.
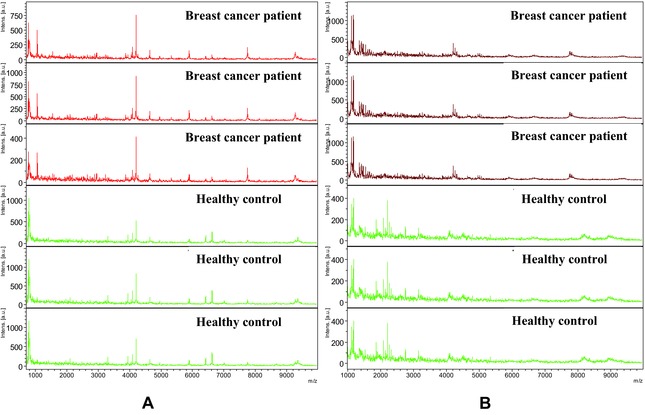
Comparative profiling of serum peptides from IDC breast cancer (red) and healthy controls (green). (A) Mass spectra (1,000–10,000 Da) of serum samples from IDC breast cancer patients (red) and age‐matched controls (green) from WCX purification. (B) Mass spectra (1,000–10,000 Da) of serum samples from IDC breast cancer patients (red) and age‐matched controls (green) from IMAC‐CU purification. Each sample represents three replications.
Using MB‐WCX magnetic beads on prefractionated serum samples and MALDI‐TOF MS revealed, on average, up to 52 peaks, of which 20 significant m/z peaks (fold change > 1.5; P < 0.001 [Wilcoxon rank sum test]) were detected between the patients with IDC and the healthy controls in the training set. Among the significant peaks, 15 were upregulated in the patients with IDC and the other five were down‐regulated in the IDC group (Table 1). While using MB‐IMAC‐Cu magnetic beads, of at least 40 peaks, there were 16 significant m/z peaks (fold change > 1.5; P < 0.001 [Wilcoxon rank sum test]) were detected between the patients with IDC and healthy controls in the training set, among which five peaks were upregulated and 11 peaks were downregulated in the IDC group (Table 1).
Table 1.
The Mean Level of Differentially Expressed Proteins Between IDC Breast Cancer Patients and Healthy Controls
| m/z MB‐WCX | Control | IDC BC | m/z MB‐IMAC‐Cu | Control | IDC BC |
|---|---|---|---|---|---|
| 4,209 | 3.33 | 18.2 ↑ | 4,493 | 2.56 | 1.30 ↓ |
| 4,192 | 1.70 | 3.53 ↑ | 4,521 | 2.35 | 1.25 ↓ |
| 4,264 | 1.71 | 3.37 ↑ | 8,927 | 1.54 | 0.60 ↓ |
| 4,090 | 2.03 | 3.90 ↑ | 4,467 | 2.55 | 1.37 ↓ |
| 6,627 | 1.76 | 3.56 ↑ | 8,983 | 1.67 | 0.72 ↓ |
| 4,962 | 1.98 | 6.48 ↑ | 8,133 | 1.56 | 0.62 ↓ |
| 5,901 | 1.73 | 4.78 ↑ | 8,870 | 0.56 | 1.04 ↑ |
| 3,882 | 2.17 | 4.19 ↑ | 4,263 | 1.96 | 3.60 ↑ |
| 4,152 | 1.87 | 3.37 ↑ | 4,079 | 2.65 | 1.75 ↓ |
| 2,952 | 2.10 | 3.50 ↑ | 1,126 | 4.06 | 5.92 ↑ |
| 3,315 | 2.00 | 3.20 ↑ | 1,865 | 4.68 | 2.84 ↓ |
| 1,741 | 2.76 | 4.37 ↑ | 4,106 | 2.48 | 1.73 ↓ |
| 4643 | 2.07 | 3.36 ↑ | 1,170 | 8.25 | 14.08 ↑ |
| 4,109 | 1.86 | 2.51 ↑ | 1,546 | 3.12 | 6.08 ↑ |
| 2,105 | 2.75 | 4.82 ↑ | 4,208 | 2.35 | 4.62 ↑ |
| 1,866 | 5.60 | 3.40 ↓ | 2,210 | 4.37 | 2.27 ↓ |
| 2,210 | 7.55 | 3.05 ↓ | 1,108 | 12.76 | 20.20 ↑ |
| 2,082 | 5.01 | 3.14 ↓ | 1,456 | 2.92 | 7.19 ↑ |
| 3,274 | 3.76 | 2.30 ↓ | |||
| 1,466 | 5.21 | 3.31 ↓ |
The patients with IDC (red) and healthy controls (green) had protein profiles from 1–10 kDa (Fig. 1A and 1B). Within this mass range, large numbers of differentially expressed proteins or peptides were detected. By observing the sample distribution chart of the patients with IDC and controls, there were small overlapping areas from the serum samples pretreated with MB‐IMAC‐Cu, which accurately distinguished patients with IDC from the control group (Fig. 1B).
Quality Control
To evaluate the reproducibility and stability of the mass spectra, all samples were repeated three times for both MB‐WCX and MB‐IMAC‐Cu purification. The intra‐assay variation of each MALDI ProteinChip assay was determined by MALDI profiling of ten aliquots of one serum sample, and spotted randomly onto ten of the 384 wells of the ProteinChip arrays along with the 64 analytical samples. The mean value of the coefficient of variance (CV) for all 52 MB‐WCX peaks was 15.79%, with maximum and minimum values of 18.13% and 7.7%, respectively. The mean value of the CV for all 40 MB‐IMAC‐Cu peaks was 12.47%, with maximum and minimum values of 16.2% and 4.2%, respectively.
Serum Protein Profiling Between Patients With IDC Versus Healthy Controls
Based on CLINPROT analysis, the two most discriminating peaks obtained from WCX (m/z 4,962 and 4,264; Fig. 2A and 2C; Table 1) distinguished between patients with IDC and healthy controls. The two most discriminating markers from the MB‐IMAC‐Cu (m/z 4,493, 4,521) also distinguished between patients with IDC and healthy controls (Fig. 2B and 2D; Table 1).
Figure 2.
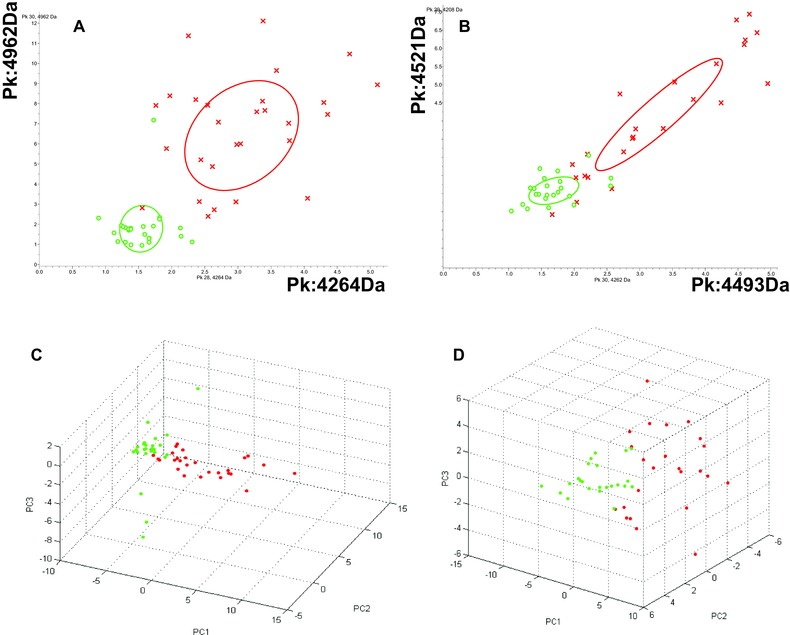
Comparison of serum proteins between IDC breast cancer patients (red) and controls (green). (A) Bivariate plot of the two most differentially expressed protein peaks (4,962 Da and 4,264 Da) from WCX purification. (B) Bivariate plot of the two most differentially expressed protein peaks (4,493 Da and 4,521 Da) from IMAC‐CU purification. (C) Three‐dimensional plot of IDC breast cancer (red) and healthy control (green) subgroup separation in the component analysis module of WCX; (D) Three‐dimensional plot of IDC breast cancer (red) and healthy control (green) subgroup separation in the component analysis module of IMAC‐CU, using all available peak data.
Potential Biomarkers Detected by MB‐WCX and MB‐IMAC‐Cu
All detected peaks were used with a k‐nearest neighbor genetic algorithm in the ClinProt system to generate a cross‐validated classification model. The model consisted of a set of three potential biomarkers (m/z: 4,209, 4,264, and 4,192), all of which were upregulated in the IDC group; the AUC values were 0.99, 0.97, and 0.98, respectively. Analyzing the training set based on the GA algorithm model, patients with IDC could be discriminated from healthy controls with 93.48% sensitivity and 98.39% specificity.
For MB‐IMAC‐Cu, the model consisted of a set of five potential biomarkers (m/z: 4,263, 4,208, 4,493, 4,521, and 1,170); the AUC values were 0.96, 0.92, 0.89, 0.85, and 0.81, respectively. Three biomarkers (m/z: 4,263, 4,208, and 1,170) were upregulated in the IDC group, and two biomarkers (m/z: 4,493 and 4,521) were downregulated in the IDC group. Using biomarkers from MB‐IMAC‐Cu based on the GA algorithm model, the training set of patients with IDC were discriminated from healthy controls with 88.89% sensitivity and 97.92% specificity.
DISSCUSSION
By definition, early detection of cancer involves asymptomatic patients. Thus, testing for cancer rises to the level of population screening 12. For breast cancer, early detection is much more significant than any treatment. Therefore, more attention should focus on the early detection of breast cancer. Currently, the tests used to diagnostic breast cancer include self‐examination, clinical / physical examination, and mammography, however, these traditional tests do not achieve early detection of breast cancer. The targeted location of resident breast cancer makes visualization of tumors with different imaging techniques relatively simple. For women with dense breasts, the sensitivity of mammography is low (45.8%–55%) 13, and is even worse for women undergoing hormone replacement therapy (25%) 14. It is unlikely that a screening test will include imaging modalities, at least until fully automated image analysis is available. Indeed, it is more likely that a highly redundant blood‐based assay which measures many different components within each sample will be developed.
Proteomic research is currently used worldwide in the search for biomarkers of different types of cancer. MALDI‐TOF MS is being widely applied to analyze serum samples for the diagnosis of human diseases and the identification of potential biomarkers 15, 16, 17, 18, 19, 20. For serum proteomics approaches, such as MB‐MALDI‐TOF MS (magnetic bead‐based fractionation followed by MALDI‐TOF MS), could greatly increase the sensitivity of mass spectra 16, 17, 18, 19, 20. However, different kinds of magnetic beads have different capabilities in capturing proteins and peptides in chromatography, which is of fundamental importance in MALDI‐TOF MS analysis. It has been reported that MB‐WCX can capture more proteins in serum than strong anionic exchange magnetic beads, especially in the low molecular weight range. MB‐WCX has been extensively applied to research involving tumor markers 16, 17, such as prostate cancer 18, 19, gastric cancer 16, bladder cancer 20, hepatocellular carcinoma 21, and nasopharyngeal cancer 22. In the current study we used two different kinds of magnetic beads (MB‐IMAC‐Cu and MB‐WCX) to preanalyze 32 patients with early stage (stages I‐II) IDC and 30 healthy control serum samples for proteomic profiling by MALDI‐TOF MS analysis. The serum samples purified in the MB‐WCX group provided a better proteomic pattern than MB‐IMAC‐Cu. The samples purified by MB‐WCX had better average peak numbers, higher peak intensities, and better capturing ability of low abundance proteins or peptides in serum samples. We showed that MB‐WCX purification is better suited in IDC biomarker research than MB‐IMAC‐Cu. In addition, the MB‐WCX and MB‐IMAC‐Cu purification methods followed by MALDI‐TOF MS identification with use of ClinProTools software accurately distinguished patients with early stage IDC from healthy individuals.
To date most studies which have identified serum biomarkers for the detection of breast cancer have used SELDI‐TOF MS 23, 24, 25, 26, 27, 28, 29. The literature in which the MALDI‐TOF MS approach has been used in breast cancer is limited, including IDC in China. Van Winden et al. adopted the SELDI technology to determine the density difference between breast cancer and control groups, making new progress compared with previous breast cancer marker protein research 29. Gast et al. utilized SELDI technology for protein profiling in serum to diagnose breast cancer, showing that three peaks are significantly correlated with breast cancer 26. Opstal‐van Winden et al. (2011) identified two SELDI‐TOF MS peaks (m/z: 3,323 and 8,939), which likely represents doubly charged apolipoprotein C‐I and C3a des‐arginine anaphylatoxin (C3adesArg), and were higher in prediagnostic breast cancer serum (P = 0.02 and P = 0.06, respectively) 30. In our study, two candidate biomarkers (m/z: 4,209 and 4,264) were upregulated in patients with IDC by MB‐WCX purification, while similar potential biomarkers (m/z : 4,263 and 4,208) identified by MB‐IMAC‐Cu purification were also overexpressed in IDC breast cancer patients. Thus, these two candidate biomarkers will be further identified by expanding samples from patients with IDC.
CONCLUSIONS
Our findings demonstrate that screening for serum protein patterns using magnetic bead purification (MB‐WCX as well as MB‐IMAC‐Cu) followed by MALDI‐TOF MS identification with ClinProTools software can accurately distinguish patients with early stage IDC from healthy individuals, and the MB‐WCX purification method was superior to MB‐IMAC‐Cu. For the high‐throughput capability of this approach, the identified differentially expressed protein panel may improve the early detection of IDC. However, expanding the data set of patients with IDC and different tumor stages, especially early stage tumors, will aid the identification of clinically useful markers for early IDC detection.
CONFLICT OF INTEREST
The authors declare that they have no conflicts of interest.
Grant sponsor: The National Natural Science Foundation of China; Grant number: 81200845; Grant sponsor: Key Science and Technology Program of Shaanxi province; Grant number: 2012 K13‐02‐01.
REFERENCES
- 1. Smart CR, Hartmann WH, Beahrs OH, et al. Insights into breast cancer screening of younger women. Cancer 1993;72:1449–1456. [DOI] [PubMed] [Google Scholar]
- 2. Smith JA, Andreopoulou E. An overview of the status of imaging screening technology for breast cancer. Ann Oncology 2004;15:i18–i26. [DOI] [PubMed] [Google Scholar]
- 3. Reinikainen H. Complementary Imaging of Solid Breast Lesions. Oulu University Press, Finland, 2003. [Google Scholar]
- 4. Lee CY, Chuang CC, Hsieh HY, et al. Evalution of dual‐spectrum irspectrogram system on invasive ductal carcinoma (IDC) breast cancer. Biomed Eng‐App Bas C 2011;23:427–433. [Google Scholar]
- 5. Levenson VV. Biomarkers for early detection of breast cancer: What, when, and where? Biochimica et Biophysica Acta 2007;177:847–856. [DOI] [PubMed] [Google Scholar]
- 6. Aldred S, Grant MM, Griffiths HR. The use of proteomics for the assessment of clinical samples in research. Clin Biochem 2004;37:943–952. [DOI] [PubMed] [Google Scholar]
- 7. Diamandis EP. Mass spectrometry as a diagnostic and a cancer biomarker discovery tool: opportunities and potential limitations. Mol Cell Proteomics 2004;3:367–378. [DOI] [PubMed] [Google Scholar]
- 8. Villanueva J, Philip J, Entenberg D, et al. Serum peptide profiling by magnetic particle‐assisted, automated sample processing and MALDI‐TOF mass spectrometry. Anal Chem 2004;76:1560–1570. [DOI] [PubMed] [Google Scholar]
- 9. Hortin GL. The MALDI‐TOF mass spectrometric view of the plasma proteome and peptidome. Clin Chem 2006;52:1223–1237. [DOI] [PubMed] [Google Scholar]
- 10. McLerran D. Analytical validation of serum proteomic profiling for diagnosis of prostate cancer: sources of sample bias. Clin Chem 2008;54:44–52. [DOI] [PMC free article] [PubMed] [Google Scholar]
- 11. McLerran D. SELDI‐TOF MS whole serum proteomic profiling with IMAC surface does not reliably detect prostate cancer. Clin Chem 2008;54:53–60. [DOI] [PMC free article] [PubMed] [Google Scholar]
- 12. Hinestrosa MC, Dickersin K, Klein P, et al. Shaping the future of biomarker research in breast cancer to ensure clinical relevance. Nat Rev Cancer 2007;7:309–315. [DOI] [PubMed] [Google Scholar]
- 13. Berg WA, Gutierrez L, NessAiver MS, et al. Diagnostic accuracy of mammography, clinical examination, US, and MR imaging in preoperative assessment of breast cancer. Radiology 2004;233:830–849. [DOI] [PubMed] [Google Scholar]
- 14. Kolb TM, Lichy J, Newhouse JH. Comparison of the performance of screening mammography, physical examination, and breast US and evaluation of factors that influence them: an analysis of 27,825 patient evaluations. Radiology 2002;225:165–175. [DOI] [PubMed] [Google Scholar]
- 15. Yang J, Song YC, Song TS, et al. Identification of novel low‐molecular‐weight serum peptidome biomarkers for non‐small‐cell lung cancer (NSCLC). J Clin Lab Anal 2012;26:148–154. [DOI] [PMC free article] [PubMed] [Google Scholar]
- 16. Yang J, Song YC, Song TS, et al. Serum peptidome profiling in patients with gastric cancer. Clin Exp Med 2012;12:79–87. [DOI] [PubMed] [Google Scholar]
- 17. Yang J, Yang SY, Hu XY, et al. Serum Peptidome Profiling in Patients with Lung Cancer. Anat Rec 2010;293:2027–2033. [DOI] [PubMed] [Google Scholar]
- 18. Malik G, Ward MD, Gupta SK, et al. Serum levels of an isoform of apolipoprotein A‐II as a potential marker for prostate cancer. Clin Cancer Res 2005;11:1073–1085. [PubMed] [Google Scholar]
- 19. Zeidan BA, Townsend PA. SELDI‐TOF proteomic profiling of breast carcinomas identifies clinicopathologically relevant groups of patients similar to previously defined clusters from cDNA expression. Breast Cancer Res 2008;10:1–2. [DOI] [PMC free article] [PubMed] [Google Scholar]
- 20. Paradis V, Degos F, Dargère D, et al. Identification of a new marker of hepatocellu1ar carcinom a by serum protein profiling of patients with chronic liver diseases. Hepatology 2005;41:40–47. [DOI] [PubMed] [Google Scholar]
- 21. Cho WC, Yip TT, Ngan RK, et al. ProteinChip array profiling for identification of disease‐ and chemotherapy‐associated biomarkers of nasopharyngeal carcinoma. Clin Chem 2007;53:241–250. [DOI] [PubMed] [Google Scholar]
- 22. Kozak KR, Amneus MW, Pusey SM, et al. Identification of biomarkers for ovarian cancer using strong anion‐exchange ProteinChips: Potential use in diagnosis and prognosi. Proc Natl Acad Sci USA 2003;100:12343–12348. [DOI] [PMC free article] [PubMed] [Google Scholar]
- 23. Hu Y, Zhang S, Yu J, et al. SELDI‐TOF‐MS: the proteomics and bioinformatics approaches in the diagnosis of breast cancer. Breast 2005;14:250–255. [DOI] [PubMed] [Google Scholar]
- 24. Belluco C, Petricoin EF, Mammano E, et al. Serum proteomic analysis identifies a highly sensitive and specific discriminatory pattern in stage1 breast cancer. Ann Surg Oncol 2007;14:2470–2476. [DOI] [PubMed] [Google Scholar]
- 25. Vlahou A, Laronga C, Wilson L, et al. A novel approach toward development of a rapid blood test for breast cancer. Clin Breast Cancer 2003;4:203–209. [DOI] [PubMed] [Google Scholar]
- 26. Gast MC, Bonfrer JM, van Dulken EJ, et al. SELDI‐TOF MS serum protein profiles in breast cancer: assessment of robustness and validity. Cancer Biomark 2006; 2:235–248. [DOI] [PubMed] [Google Scholar]
- 27. Li J, Orlandi R, White CN, et al. Independent validation of candidate breast cancer serum biomarkers identified by mass spectrometry. Clin Chem 2005;51:2229–2235. [DOI] [PubMed] [Google Scholar]
- 28. Mathelin C, Cromer A, Wendling C, et al. Serum biomarkers for detection of breast cancers: a prospective study. Breast Cancer Res Treat 2006;96:83–90. [DOI] [PubMed] [Google Scholar]
- 29. van Winden AW, Gast MC, Beijnen JH, et al. Validation of previously identified serum biomarkers for breast cancer with SELDI‐TOF MS: a case control study. BMC Med Genomics 2009;2:1–14. [DOI] [PMC free article] [PubMed] [Google Scholar]
- 30. Opstal‐van Winden AW, Krop EJM, Kåredal MH, et al. Searching for early breast cancer biomarkers by serum protein profiling of pre‐diagnostic serum; a nested case‐control study. BMC Cancer 2011;11:1–11. [DOI] [PMC free article] [PubMed] [Google Scholar]