

Abstract
Background
Analysis of urinary proteins using cellulose acetate membrane electrophoresis (CAME) is a useful and challenging method for the recognition of damaged sites in the kidney. However, protein content of each CAME fraction is still not completely understood.
Methods
In this study, an effective method of protein extraction from each band fractionated by CAME was established, which enabled us to examine the extracted proteins by sodium dodecyl sulfate‐polyacrylamide gel electrophoresis and mass spectrometry.
Results
Proteins were extracted from the gel and analyzed by mass spectrometry. In all, 31 proteins were identified, including 20 urinary proteins that were newly identified in the CAME‐based analysis.
Conclusion
This methodology was useful for identifying the proteins responsible for creating unique bands on CAME in a urine sample of a patient with drug‐induced interstitial nephritis. These findings provide in‐depth characterization of urinary protein contents in each CAME fraction.
Keywords: cellulose acetate membrane electrophoresis, kidney, proteome, SDS‐PAGE, urinary protein
INTRODUCTION
Currently, high‐throughput mass spectrometric analysis of urinary proteins is being widely used in renal studies 1, 2, 3. Since urine sampling is noninvasive and relatively easy compared with serum samples, urine is attractive for biomarker discovery. A urinary protein panel, which is a renal disease assessment involving several novel protein markers 3, increases the diagnosis accuracy in diabetes mellitus, lupus nephritis 4, and recurrent bladder cancer 5. Therefore, a multiplex urinary protein assay is valuable for monitoring renal diseases.
Cellulose acetate membrane electrophoresis (CAME) is one of the most classic approaches of protein panel analysis. In clinical practice, urinary protein electrophoresis has been mainly used for confirming the Bence Jones protein in multiple myeloma 6, but it has not been widely used. In the previous study, we analyzed the potential of this easy and inexpensive method to predict renal dysfunction. First, we developed a highly sensitive colloidal silver stain for CAM instead of conventional Ponceau 3R or other dyes 7. The silver staining technique is sensitive enough to visualize urinary protein patterns even in urine samples of healthy subjects 8. Second, we established the classification of urinary protein patterns using the relative mobility (RM) of each band on CAME by using urine samples of patients with several kidney diseases 9. The urinary protein patterns of patients with persistent proteinuria, including IgA nephropathy, tubulointerstitial nephritis, and other nephropathies, were clearly classified into three groups according to the damaged location within the nephron, as evidenced by the characteristic protein bands on CAME: glomerular, tubular, and mixed patterns. The representative proteins in the glomerular pattern are albumin (Alb) at the Alb fraction and transferrin (Tf) at the β fraction. In the tubular pattern, retinol‐binding protein (RBP) appears at the anodic side of the β (βa) fraction and β2‐microglobulin (β2m) at the cathodic side of the β (βc) fraction. RBP and/or β2m with Alb and Tf appeared in the mixed pattern. Since the protein profiles classified with this technique exhibited good agreement with the histological findings of the subsequent renal biopsy 9, the urinary protein profile based on CAME is expected to become a useful method to predict the regional site and provide supportive data for histopathological diagnosis of renal diseases.
Different profiles are often seen in the CAME of urinary proteins from patients with renal diseases 10, 11. To identify the proteins on CAME, immune fixation and Western blot have been employed using specific antibodies 12, 13, 14; however, the protein contents in each fraction have not been fully identified. Identification of urinary proteins in each fraction is expected to be more efficient, effective, and accurate if it is coupled with proteomic approaches such as mass spectrometry once the proteins are effectively extracted from CAM after electrophoresis. In the present study, we established a method for extracting proteins from each fraction of CAM. By employing the proteomic approach, characteristic proteins were identified from the unique fractions of a sample of a patient with drug‐induced interstitial nephritis.
MATERIALS AND METHODS
Patients
The analytical samples of two patients with tubulointerstitial nephritis at the Niigata university hospital were collected before renal biopsy 4. A urine sample was also collected from a patient with IgA nephropathy, which showed five fractions of glomerular‐type protein pattern, to establish the protein extraction method. Informed consent was obtained from all patients. Freshly voided urine was centrifuged (1,500 × g, 5 min, 4°C), and the supernatant was stocked at –80°C until analysis.
Methods
Measurement of total protein (TP) and Alb concentrations in urine samples
The urinary TP concentration was determined by the pyrogallol red method using the Micro TP‐Test Wako (Wako, Osaka, Japan). The urinary Alb concentration was determined by the immunoturbidimetric method using the N‐Assay TIA Micro Alb (Nittobo, Tokyo, Japan). Both proteins were analyzed using an autoanalyzer (Accute, Toshiba, Tokyo, Japan).
CAME following colloidal silver staining
Urine samples (0.8 μl) were loaded on CAM (SELECA‐VSP, Toyo Roshi Kaisha, Tokyo, Japan) using a sample applicator (Jokoh, Tokyo, Japan). Urinary proteins were electrophoresed at a constant current of 0.7 mA/cm for 40 min using 0.6 mol/l Veronal buffer at pH 8.6 (Jokoh). After electrophoresis, the proteins were stained with the colloidal silver staining kit (Jokoh) as previously described 9.
Protein extraction after CAME
To investigate the protein content of each fraction on CAM, we established the protein extraction method. First, a urine sample was loaded into ten lanes on CAM, and electrophoresed using the conditions listed above (Fig. 1a). Then, both ends of CAM were cut and stained with colloidal silver (Fig. 1b). Each fraction in the unstained part of the CAM from lane 2 to 9 was cut out following the stained area (Fig. 1c), and each fraction strip was further cut into 5 mm2 segments (Fig. 1d). The proteins in each fraction on the CAM segments were extracted with 40 μl of each protein extraction buffer, and 10 μl of the extracted proteins (approximately 1 μg/well) was analyzed by sodium dodecyl sulfate‐polyacrylamide gel electrophoresis (SDS‐PAGE) 15. After electrophoresis, the gel was stained with Silver Stain KANTO III (Kanto Kagaku, Tokyo, Japan).
Figure 1.
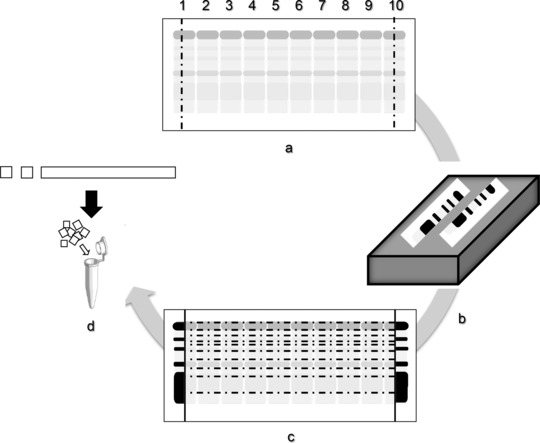
Schematic representation of the protocol for protein extraction from CAM. Loading of ten lanes with urine sample on CAM (a), silver staining of both ends after separation (b), cutting each fraction of the unstained membrane following the stained area (c), and fragmenting each fraction strip for protein extraction (d).
To establish the basic conditions for protein extraction from CAM, we carried out the following validations:
Spread of protein fraction after electrophoresis: While staining both ends of CAM after electrophoresis, the unstained part was kept moist in a chamber. Proteins might diffuse into the adjacent fractions, leading to misidentification of proteins. To investigate the influence of protein diffusion on CAM, the membrane was kept in a moisture chamber for 0, 15, 30, 60, and 120 min after electrophoresis, and each protein pattern was compared.
Optimal concentration of protein application: The urine sample from the patient with IgA nephropathy was diluted to a final TP concentration of 100–1600 mg/l, and each protein pattern was compared to assess the conditions for obtaining well‐separated protein bands on CAM with maximum protein load.
Selection of protein extraction buffer: Buffers at four different pH values were tested for protein extraction, and the protein profile under the different conditions was compared: 0.2 mol/l glycine–HCl buffer (Gly–HCl, pH 2.5), phosphate‐buffered saline (PBS, pH 7.4), 96 mmol/l carbonate–bicarbonate buffer (Carb–bicarb, pH 9.6), and Laemmli sample buffer (LSB; 14 mmol/l SDS, 0.5 mol/l Tris amino methane, 0.7 μmol/l bromophenol blue, and 14 mol/l glycerol, pH 6.8), which is the buffer solution used for SDS‐PAGE sample preparation.
Protein extraction time: The protein profiles obtained after 1, 2, 4, and 8 h were extracted, and each protein pattern was compared.
In‐gel digestion
The protein bands were excised manually from the SDS‐PAGE gel, cut into pieces, and destained using the Silver Stain KANTO Gel Washing Solution for MS (Kanto Kagaku). Gel pieces were washed with 50% v/v acetonitrile (ACN) in 25 mmol/l ammonium bicarbonate. The gel pieces were reduced with 40 μl of 10 mmol/l dithiothreitol in 100 mmol/l ammonium bicarbonate at 56°C for 1 h. After removal of dithiothreitol solution, 40 μl of 55 mmol/l iodoacetamide in 100 mmol/l ammonium bicarbonate was added, and the gel pieces were incubated for 30 min at room temperature in the dark. Following reduction and alkylation, the gel pieces were washed with 30 μl of 100 mmol/l ammonium bicarbonate and 40 μl of ACN and placed in a centrifugal concentrator (VC‐36N, Titec, Saitama, Japan) until dry. Then, sufficient volume (20–40 μl) of modified porcine trypsin (Sequencing Grade Modified Trypsin; Promega, Madison, WI) at a final concentration of 25 ng/μl in 50 mmol/l ammonium bicarbonate was added to the gel pieces and allowed to rehydrate for 30 min on ice. Then, 10 μl of 50 mmol/l ammonium bicarbonate was added, and tryptic digestion was performed overnight at 37°C. The resulting peptides were extracted from the gel pieces with 10 μl of 25 mmol/l ammonium bicarbonate for 10 min, and the extracted peptide solution was removed and saved. Then, 20 μl of ACN was added and dehydrated for 10 min. The extracted solution was also saved in the same tube. The gel pieces were then incubated with 10 μl of 5% formic acid in 50% ACN for 10 min, and the solution was collected. This procedure was repeated three times. The eluates were combined and concentrated in a centrifugal concentrator and stored at –20°C until analysis.
Mass spectrometry analysis
Digested peptides were reconstituted with 20 μl of 0.1% formic acid in water and analyzed by liquid chromatography‐tandem mass spectrometry (LC‐MS/MS, LC: Advance‐nano UHPLC, AMR, Tokyo, Japan, MS: amazon ETD, Bruker Daltonics, Billerica, MA) using a C18 reverse‐phase capillary column (L‐column 2 ODS, 0.1 × 50 mm, 0.3 μm i.d., Chemicals Evaluation Research Institute, Tokyo, Japan) at a flow rate of 500 nl/min using the following mobile phases: A, 0.1% formic acid in water; B, 0.1% formic acid/ACN. The gradient step was from 5% to 45% B in 20 min.
Subsequently, all acquired MS/MS spectra were searched against the Swiss‐Prot database R51.5 human taxonomy using the MASCOT search engine (v. 2.1, Matrix Science, London, UK) using the following parameters: missed cleavage = 1, peptide mass tolerance = 0.5, MS/MS mass tolerance = 0.5 Da. Carbamidomethylation was used for fixed modification and methionine oxidation for variable modification.
RESULTS
Extraction Conditions of Protein From CAM
Spread of protein fraction after electrophoresis
After 15 and 30 min, which is the colloidal silver‐staining incubation time, the proteins of each fraction did not diffuse compared with the control (Fig. 2a). Remarkable protein diffusion was observed after 120 min especially in the fraction peaks of α1‐G, α2‐G, and ϒ‐G, which became flat, making it difficult to distinguish the borders of each fraction.
Figure 2.
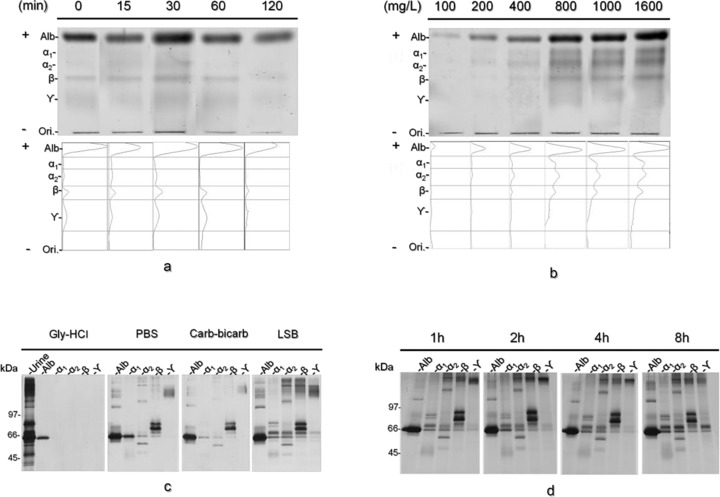
Validation of the protein extraction procedure. CAME pattern of the urine sample kept in a chamber for 0, 15, 30, 60, and 120 min after separation and the corresponding densitometric profiles (a). CAME profile of the urine sample at different loading amounts (b). Result of the SDS‐PAGE of the urine sample using four different extraction buffers (c). Result of the SDS‐PAGE of the urine sample with Laemmli sample buffer at different extraction times (d).
Optimal concentration of protein application
At the concentration <800 mg/l, all protein fractions were detected. However, each fraction became turbid when >1000 mg/l protein was loaded (Fig. 2b).
Selection of protein extraction buffer
The SDS‐PAGE results of the urine sample before extraction were compared in several extraction buffers. Only one band was observed in Gly–HCl buffer. A couple of proteins were extracted by PBS or Carb–bicarb buffer. The best results were obtained in LSB. Therefore, we employed LSB for protein extraction in the following experiments (Fig. 2c).
Time required for protein extraction
There were no major differences in the protein patterns between 1 and 8 h, with the exception of the high molecular mass area of the Alb and ϒ‐G fractions (Fig. 2d). Therefore, in the following experiments, protein extraction was performed for 8 h.
Patient Profile and Pathological Characteristics
The diagnosis and medications of the two patients with tubulointerstitial nephritis are summarized in Figure 3a. In patient A, biopsy revealed tubular atrophy, granuloma formation, inflammatory cell infiltrate, and cast formation (Fig. 3b, 1–4). In patient B, tubular atrophy, interstitial fibrosis, tubular dropout, and interstitial edema were observed (Fig. 3c, 5–8).
Figure 3.
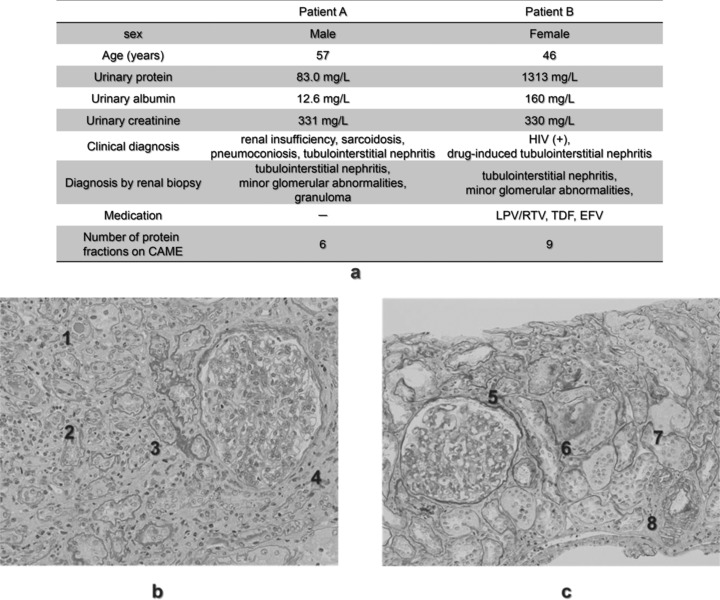
Clinical characteristics and histological features of kidney biopsies from two patients with tubulointerstitial nephritis. Basic information of the two patients with tubulointerstitial nephritis (a). The renal tissue of patient A (b) shows tubular atrophy, granuloma formation, inflammatory cell infiltrate, and cast formation 1, 2, 3, 4. In addition, tubular atrophy, interstitial fibrosis, tubular dropout, and interstitial edema 5, 6, 7, 8 were observed in the tissue of patient B (c).
CAME Profile of Urinary Proteins
The urinary protein patterns on CAME of the patients with tubulointerstitial nephritis are shown in Figure 4a. The RM and area percentage of each fraction were calculated by densitometric analysis (Fig. 4b). Since patient A showed the typical tubular pattern on CAME, the abundance of the Alb fraction was less than 50%, while the bands of βa and βc represent RBP at RM of 0.62 (reference 0.60–0.65) and β2m at RM of 0.42 (reference 0.40–0.45), respectively. In patient B, on the other hand, urinary proteins were separated into nine characteristic fractions. Although Alb (<50% abundance) and βa fractions indicated tubular type, the β fraction represented a glomerular protein of Tf at the RM of 0.53 (0.48–0.57). Furthermore, this pattern was similar to the mixed pattern, even though it lacked the βc fraction. Three unknown bands were detected at RM of 1.14, 0.38, and 0.15 (x, y, and z). The relatively sharp band of the ϒ‐G fraction was also a characteristic feature of the band shape.
Figure 4.
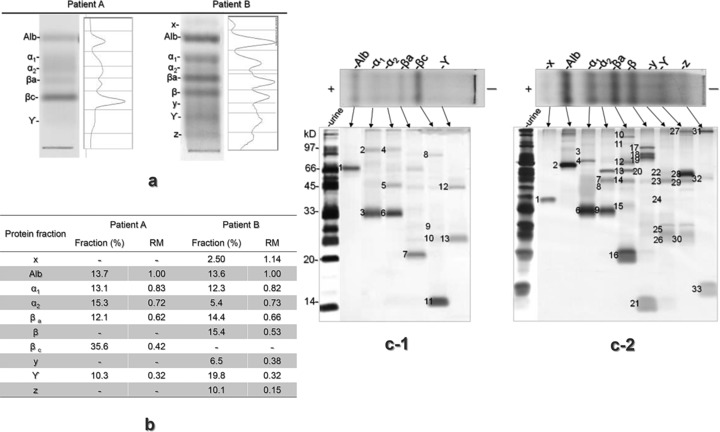
CAME and SDS‐PAGE patterns of the proteins extracted from the urine samples of the patients with tubulointerstitial nephritis and RM of each fraction. Silver‐stained CAM gel and densitometric profiles of the urine samples from two patients with tubulointerstitial nephritis (a). RM of each fraction from each patient (b). SDS‐PAGE gels of the fractions extracted from the urine samples of patient A (c‐1) and patient B (c‐2).
Comparison of the Proteins Extracted From Each CAM Fraction
Figure 4c shows the SDS‐PAGE results of the extracted proteins in each pattern. In total, 31 proteins from 46 bands in the SDS‐PAGE gels were identified with this method from the samples of the two patients with tubulointerstitial nephritis (Table 1). The characteristic fraction x of patient B was consistent with transthyretin. The fraction y showed similar protein content of the ϒ‐G fraction, except for the lower amount of beta‐2‐glycoprotein. Fraction z was mainly consistent with lysozyme.
Table 1.
Protein Bands Identified by LC‐MS/MS
| Band | Protein | Gene | Nominal | pI | Peptide | Sequence | |||
|---|---|---|---|---|---|---|---|---|---|
| no. | Fraction | name | name | AC | mass | value | Score | no. | coverage (%) |
| Patient A | |||||||||
| 1 | Alb | Serum Alb | ALBU_HUMAN | P02768 | 71,317 | 5.92 | 104 | 11 | 26 |
| 2 | α1 | Uromdulin | UROM | P07911 | 72,451 | 5.05 | 24 | 2 | 3 |
| 3 | Alpha‐1‐microglobulin | AMBP_HUMAN | P02760 | 39,886 | 5.95 | 136 | 4 | 15 | |
| 4 | α2 | Uromodulin | UROM | P07911 | 72,451 | 5.05 | 65 | 4 | 5 |
| 5 | Zinc‐alpha‐2‐glycoprotein | ZA2G_HUMAN | P25311 | 34,465 | 5.71 | 86 | 6 | 23 | |
| 6 | Alpha‐1‐microglobulin | AMBP_HUMAN | P02760 | 39,886 | 5.95 | 70 | 8 | 19 | |
| 7 | βa | RBP 4 | RET4_HUMAN | P02753 | 23,337 | 5.76 | 68 | 4 | 30 |
| 8 | βc | Serotransferrin | TRFE_HUMAN | P02787 | 79,294 | 6.81 | 22 | 3 | 7 |
| 9 | Prostaglandin‐H2 d‐isomerase | PTGDS_HUMAN | P41222 | 21,243 | 7.66 | 88 | 2 | 8 | |
| 10 | Ig kappa chain C region | IGKC_HUMAN | P01834 | 11,773 | 5.58 | 31 | 2 | 32 | |
| 11 | Lysozyme C | LYZ_HUMAN | P61626 | 16,982 | 9.38 | 79 | 3 | 19 | |
| 11 | Cystatin‐C | CYTC_HUMAN | P01034 | 16,017 | 9.00 | 176 | 3 | 19 | |
| 12 | ϒ | Ig gamma‐1 chain C region | IGHG1_HUMAN | P01857 | 36,596 | 8.46 | 81 | 3 | 50 |
| 13 | Ig kappa chain C region | IGKC_HUMAN | P01834 | 11,773 | 5.58 | 123 | 3 | 48 | |
| Patient B | |||||||||
| 1 | X | Transthyretin | TTHY_HUMAN | P02766 | 15,991 | 5.52 | 79 | 3 | 17 |
| 2 | Alb | Serum Alb | ALBU_HUMAN | P02768 | 71,317 | 5.92 | 254 | 12 | 48 |
| 3 | α1 | Alpha‐1‐antitrypsin | A1AT_HUMAN | P01009 | 46,878 | 5.37 | 166 | 4 | 10 |
| 4 | Alpha‐1B‐glycoprotein | A1BG_HUMAN | P04217 | 54,790 | 5.56 | 66 | 9 | 24 | |
| 5 | Alpha‐1‐microglobulin | AMBP_HUMAN | P02760 | 39,886 | 5.95 | 76 | 10 | 21 | |
| 6 | α2 | Angiotensinogen | ANGT_HUMAN | P01019 | 53,406 | 5.87 | 100 | 3 | 8 |
| 7 | Vitamin D binding protein | VTDB_HUMAN | P02774 | 54,526 | 5.40 | 77 | 10 | 32 | |
| 8 | Apolipoprotein A‐IV | APOA4_HUMAN | P06727 | 45,371 | 5.28 | 21 | 3 | 13 | |
| 9 | Zinc‐alpha‐2‐glycoprotein | ZA2G_HUMAN | P25311 | 34,465 | 5.71 | 108 | 4 | 10 | |
| 10 | Alpha‐1‐microglobulin | AMBP_HUMAN | P02760 | 39,886 | 5.95 | 130 | 10 | 31 | |
| 11 | βa | Plasma protease C1 inhibitor | IC1_HUMAN | Q96FE0 | 55,347 | 6.09 | 89 | 7 | 19 |
| 12 | Complement C1s subcomponent | C1S_HUMAN | Q9UCV3 | 78,174 | 4.86 | 73 | 9 | 19 | |
| 13 | Antithrombin‐III | ANT3_HUMAN | Q9UC78 | 53,025 | 6.32 | 60 | 7 | 21 | |
| 14 | Spermatogenesis‐associated protein 7 | SPAT7_HUMAN | Q9P0W8 | 68,190 | 5.90 | 35 | 3 | 7 | |
| 15 | Vitamin D binding protein | VTDB_HUMAN | P02774 | 54,526 | 5.40 | 103 | 7 | 28 | |
| 16 | Apolipoprotein A‐IV | APOA4_HUMAN | P06727 | 45,371 | 5.28 | 28 | 3 | 21 | |
| 16 | Complement C3 fragment | CO3_HUMAN | P01024 | 188,569 | 6.02 | 67 | 9 | 10 | |
| 17 | RBP 4 | RET4_HUMAN | P02753 | 23,337 | 5.76 | 81 | 7 | 45 | |
| 18 | β | Apolipoprotein A‐IV | APOA4_HUMAN | P06727 | 45,371 | 5.28 | 169 | 8 | 21 |
| 19 | Serotransferrin | TRFE_HUMAN | P02787 | 79,294 | 6.81 | 148 | 6 | 10 | |
| 20 | Hemopexin | HEMO_HUMAN | P02790 | 52,385 | 6.55 | 56 | 5 | 16 | |
| 21 | β2m | B2MG_HUMAN | P61769 | 13,715 | 5.30 | 34 | 3 | 14 | |
| 22 | Y | Pigment epithelium derived factor | PDEF_HUMAN | P36955 | 46,454 | 5.97 | 220 | 8 | 20 |
| 23 | Beta‐2‐glycoprotein 1/Apolipoprotein H | APOH_HUMAN | P02749 | 39,548 | 8.34 | 55 | 4 | 17 | |
| 24 | Complement factor H related protein 1 | PHR1_HUMAN | Q03591 | 38766 | 7.38 | 37 | 6 | 18 | |
| 25 | Apolipoprotein A‐I | APOA1_HUMAN | P02647 | 30,759 | 5.56 | 80 | 9 | 32 | |
| 25 | Complement factor D | CFAD_HUMAN | P00746 | 27,529 | 7.99 | 79 | 7 | 27 | |
| 26 | Ig kappa chain C region | IGKC_HUMAN | P01834 | 11,773 | 5.58 | 85 | 3 | 18 | |
| 27 | ϒ | Ig kappa chain C region | IGKC_HUMAN | P01834 | 11,773 | 5.58 | 97 | 2 | 18 |
| 28 | Beta‐2‐glycoprotein 1/Apolipoprotein H | APOH_HUMAN | P02749 | 39,548 | 8.34 | 63 | 6 | 28 | |
| 29 | Beta‐2‐glycoprotein 1/Apolipoprotein H | APOH_HUMAN | P02749 | 39,548 | 8.34 | 337 | 15 | 54 | |
| 29 | Apolipoprotein A‐IV | APOA4_HUMAN | P06727 | 45,371 | 5.28 | 62 | 12 | 29 | |
| 30 | Immunoglobulin light chain | gi218783334 | BAH03697 | 23,438 | 8.31 | 55 | 5 | 39 | |
| 31 | Z | Ig gamma‐1 chain C region | IGHG1_HUMAN | P01857 | 36,596 | 8.46 | 63 | 2 | 9 |
| 31 | Ig kappa chain C region | IGKC_HUMAN | P01834 | 11,773 | 5.58 | 116 | 4 | 51 | |
| 31 | Ig gamma‐3 chain C region | IGHG3_HUMAN | P01860 | 42,287 | 8.23 | 57 | 3 | 9 | |
| 32 | Apolipoprotein A‐IV | APOA4_HUMAN | P06727 | 45,371 | 5.28 | 29 | 6 | 18 | |
| 33 | Lysozyme C | LYZ_HUMAN | P61626 | 16,982 | 9.38 | 95 | 6 | 37 | |
| 33 | Cystatin‐C | CYTC_HUMAN | P01034 | 16,017 | 9.00 | 62 | 5 | 45 | |
The protein band number used in Figure 4c, protein identity, gene name, AC, normal mass, pI value, score, number of peptide matches (peptide no.), and sequence coverage.
AC, accession code.
Among the proteins identified, 11 have been previously identified by immunofixation 6, and the remaining 20 proteins (i.e., zinc‐alpha‐2‐glycoprotein, prostaglandin‐H2 d‐isomerase, Ig kappa chain C region, Ig gamma‐1 chain C region, alpha‐1B‐glycoprotein, angiotensinogen, vitamin D binding protein, apolipoprotein A‐IV, plasma protease C1 inhibitor, complement C1s subcomponent, antithrombin‐III, spermatogenesis‐associated protein 7, complement C3 fragment, pigment epithelium‐derived factor, beta‐2‐glycoprotein 1/apolipoprotein H, complement factor H related protein 1, apolipoprotein A‐I, complement factor D, immunoglobulin light chain, Ig gamma‐3 chain C region) were newly detected in the present CAM‐based analysis.
DISCUSSION
Urinary protein profile using CAME coupled with the highly sensitive colloidal silver staining enables the separation of urinary proteins without concentration and provides the entire scope of the urinary protein abnormalities. Urinary protein profiles on CAME also allow to identify damaged portions of the kidney. To increase the information that CAME could provide, identification of proteins in each fraction was necessary.
In the present study, our protein extraction method was validated. As expected, the LSB buffer was the most effective and appropriate solution to extract the proteins fractionated on CAM. The subsequent SDS‐PAGE analysis enabled the estimation of the approximate abundance of the extracted proteins. Furthermore, this method could discriminate both the well‐separated proteins on CAM, such as transthyretin, Alb, RBP, β2m, and lysozyme C, as well as overlapped‐proteins such as uromodulin, alpha‐1‐microglobulin, vitamin D binding protein, and apolipoprotein A‐IV. These detailed results confirm the feasibility of CAME in urinary protein analysis. In our preliminary study, better results were obtained when 15% acrylamide gel was used than when 10% and 12.5% acrylamide gel were employed (data not shown). However, the protein identification may be limited by the polyacrylamide concentration, and wide molecular mass range might not be fully covered. Shotgun proteomics of the extracted proteins could also be an effective method for protein identification if the sample preparation method is successfully confirmed.
Our developed CAME‐based proteomic approach was useful to identify the proteins contained in each fraction. Most of these proteins have already been reported as renal dysfunction related markers. For example, zinc‐alpha‐2‐glycoprotein was reported as the candidate marker for nonalbuminuric diabetic nephropathy 16 and active lupus nephritis 17. In lupus nephritis, urinary prostagrandin‐H2 d‐isomerase was also reported as a novel marker 17. Alpha‐1B‐glycoprotein expression was increased in the urine of patients with interstitial cystitis 18. Urinary angiotensinogen level was found to be elevated in children with obstructive nephropathy 19. Vitamin D binding protein is one of the typical megalin‐mediated proteins 20, and it has been reported as the biomarker of several kidney diseases including tubular dysfunction and IgA nephropathy 21, 22. Apolipoprotein A‐IV is also taken up by megalin expressed in proximal tubular cells, and many studies have demonstrated that the decreased clearance of apolipoprotein A‐IV was due to renal dysfunction 23, 24. Vivekanandan‐Giri et al. have reported that the levels of several N‐linked glycoproteins such as zinc‐alpha‐2‐glycoprotein, antithrombin‐III, pigment epithelium derived factor, and complement factor H related 1 were elevated in urine samples of patients with chronic kidney diseases 25. Our patient B showed a relatively sharp band in the ϒ‐G fraction, which usually presents as a broad diffuse band because of a slightly different pI state of immunoglobulins. This fraction was mainly consistent with beta‐2‐glycoprotein, which is a highly glycosylated plasma protein of approximately 40 kDa, and because of its high isophoretic point (8.34), it is thought to be filtered in the glomerulus more easily than other anionic proteins 16. Beta‐2‐glycoprotein is also metabolized through megalin‐mediated endocytosis like other low‐molecular mass proteins, and is thought to be an important marker of renal tubular diseases 17. In a previous analysis using agarose gel electrophoresis, beta‐2‐glycoprotein also produced a prominent band in the β to ϒ‐G region in urine of patients with renal tubular diseases, including low syndrome, Fanconi syndrome, and Dent's disease 26. Therefore, the characteristic band in the ϒ‐G fraction may be used as a useful indicator of deterioration of tubular reabsorption.
Low amounts of proteins may not highly contribute to the alteration of the mobility or formation of a protein fraction; however, a band on CAM is an assembly of proteins that have a similar charge. Pathophysiological changes can differentiate the composition of proteins from a damaged kidney in individual patients, and this may cause slight mobility shifts or create new fractions. The two patients enrolled in this study presented tubulointerstitial nephritis; however, patient B exhibited exacerbation of tubular proteinuria, while patient A did not. To clarify whether their different protein profiles on CAME were caused by a different disease stage, pharmacological treatment, or other reasons, further studies conducted on a larger number of patients are needed.
Renal biopsy is the most accurate method to diagnose renal diseases, not only for differentiating the damaged site of nephrons (e.g., glomerular or tubular) but also for evaluating the treatment results; however, since it is invasive, expensive, and risky, it cannot be performed frequently. Therefore, a noninvasive urine analysis is needed to predict and diagnose renal diseases. The coexistence of characteristic urinary protein fractions on CAME may lead to quick and inexpensive laboratory tests for renal injury. To broaden the clinical application of urinary protein profiles obtained via CAME, such as screening renal diseases or providing data that support the pathological findings of renal biopsy, the relationship between each protein profile and tissue damage needs to be clarified. In conclusion, the present study provides a useful procedure for protein identification from characteristic fractions on CAME.
ACKNOWLEDGMENTS
The authors appreciate the technical support of Junya Odake, Mai Kimono, Mei Yamamoto, and Aymi Takai.
Grant sponsor: Bunkyo Gakuin University Research Fund; Grant sponsor: Japan Society for the Promotion of Science Grant‐in‐Aid for Young Scientists (B); Grant number: 23790627.
REFERENCES
- 1. Santucci L, Candiano G, Bruschi M, et al. Urinary proteome in a snapshot: Normal urine and glomerulonephritis. J Nephrol 2013;26:610–616. [DOI] [PubMed] [Google Scholar]
- 2. Rodríguez‐Suárez E, Siwy J, Zürbig P, Mischak H. Urine as a source for clinical proteome analysis: From discovery to clinical application. Biochim Biophys Acta 2014;1844:884–898. [DOI] [PubMed] [Google Scholar]
- 3. Gopalan G, Rao VS, Kakkar VV. An overview of urinary proteomics applications in human diseases. Int J High Throughput Screen 2010;1:189–192. [Google Scholar]
- 4. Suzuki M, Wiers K, Brooks EB, et al. Initial validation of a novel protein biomarker panel for active pediatric lupus nephritis. Pediatr Res 2009;65:530–536. [DOI] [PMC free article] [PubMed] [Google Scholar]
- 5. Rosser CJ, Chang M, Dai Y, et al. Urinary protein biomarker panel for the detection of recurrent bladder cancer. Cancer Epidemiol Biomarkers Prev 2014;23:1340–1345. [DOI] [PMC free article] [PubMed] [Google Scholar]
- 6. Shaheen SP, Levinson SS. Serum free light chain analysis may miss monoclonal light chains that urine immunofixation electrophoreses would detect. Clin Chim Acta 2009;406:162–166. [DOI] [PubMed] [Google Scholar]
- 7. Hiratsuka N, Shiba K, Shinomura K, Hosaki S. Rapid and highly sensitive colloidal silver staining on cellulose acetate membrane for analysis of urinary proteins. J Clin Lab Anal 1996;10:403–406. [DOI] [PubMed] [Google Scholar]
- 8. Machii R, Kubota R, Hiratsuka N, et al. Urinary protein fraction in healthy subjects using cellulose acetate membrane electrophoresis followed by colloidal silver staining. J Clin Lab Anal 2004;18:231–236. [DOI] [PMC free article] [PubMed] [Google Scholar]
- 9. Sakatsume M, Kubota R, Ogawa A, et al. Rapid and sensitive electrophoresis of urinary protein clearly reveals the pathophysiological feature of renal diseases. Nephrology (Carlton) 2007;12:191–196. [DOI] [PubMed] [Google Scholar]
- 10. Machii R, Sakatume M, Kubota R, Kobayashi S, Gejyo F, Shiba K. Examination of the molecular diversity of alpha1 antitrypsin in urine: Deficit of an alpha1 globulin fraction on cellulose acetate membrane electrophoresis. J Clin Lab Anal 2005;19:16–21. [DOI] [PMC free article] [PubMed] [Google Scholar]
- 11. Machii R, Matsuda K, Hiratsuka N, et al. Analysis of an expanded width of albumin fraction by cellulose acetate membrane electrophoresis in IgA nephropathy urine before treatment. J Clin Lab Anal 2003;17:37–43. [DOI] [PMC free article] [PubMed] [Google Scholar]
- 12. Kubota R, Ishii M, Kameko M, et al. A semiautomatic analyzer for urinary protein assay and a software program for classifying renal injury using cellulose acetate electrophoresis. J Electrophoresis 2010;54:13–18. [Google Scholar]
- 13. Kanamori K, Hagihara M. Tojo N, Shiba K, Semba J. Examination of urinary protein fractions using high‐sensitivity silver staining. Japanese J Med Tec 2005;54:248–252. [Google Scholar]
- 14. Kubota R, Machii R, Hiratsuka N, et al. Cellulose acetate membrane electrophoresis in the analysis of urinary proteins in patients with tubulointerstitial nephritis. J Clin Lab Anal 2003;17:44–51. [DOI] [PMC free article] [PubMed] [Google Scholar]
- 15. Nakayama A, Sakatsume M, Kasama T, et al. Molecular heterogeneity of urinary albumin in glomerulonephritis: Comparison of cardiovascular disease with albuminuria. Clin Chim Acta 2009;402:94–101. [DOI] [PubMed] [Google Scholar]
- 16. Lim SC, Liying DQ, Toy WC, et al. Adipocytokine zinc α2 glycoprotein (ZAG) as a novel urinary biomarker for normo‐albuminuric diabetic nephropathy. Diabet Med 2012;29:945–949. [DOI] [PubMed] [Google Scholar]
- 17. Somparn P, Hirankarn N, Leelahavanichkul A, Khovidhunkit W, Thongboonkerd V, Avihingsanon Y. Urinary proteomics revealed prostaglandin H(2)D‐isomerase, not Zn‐α2‐glycoprotein, as a biomarker for active lupus nephritis. J Proteomics 2012;18:3240–3247. [DOI] [PubMed] [Google Scholar]
- 18. Goo YA, Tsai YS, Liu AY, Goodlett DR, Yang CC. Urinary proteomics evaluation in interstitial cystitis/painful bladder syndrome: A pilot study. Int Braz J Urol 2010;36:464–478. [DOI] [PubMed] [Google Scholar]
- 19. Taranta‐Janusz K, Wasilewska A, Dębek W, Filonowicz R, Michaluk‐Skutnik J. Urinary angiotensinogen as a novel marker of obstructive nephropathy in children. Acta Paediatr 2013;102:e429–433. [DOI] [PubMed] [Google Scholar]
- 20. Rowling MJ, Kemmis CM, Taffany DA, Welsh J. Megalin‐mediated endocytosis of vitamin D binding protein correlates with 25‐hydroxycholecalciferol actions in human mammary cells. J Nutr 2006;136:2754–2759. [DOI] [PMC free article] [PubMed] [Google Scholar]
- 21. Tian XQ, Zhao LM, Ge JP, Zhang Y, Xu YC. Elevated urinary level of vitamin D‐binding protein as a novel biomarker for diabetic nephropathy. Exp Ther Med 2014;7:411–416. [DOI] [PMC free article] [PubMed] [Google Scholar]
- 22. Kalantari S, Rutishauser D, Samavat S, et al. Urinary prognostic biomarkers and classification of IgA nephropathy by high resolution mass spectrometry coupled with liquid chromatography. PLoS One 2013;8:e80830. [DOI] [PMC free article] [PubMed] [Google Scholar]
- 23. Lingenhel A, Lhotta K, Neyer U, et al. Role of the kidney in the metabolism of apolipoprotein A‐IV: Influence of the type of proteinuria. J Lipid Res 2006;47:2071–2079. [DOI] [PubMed] [Google Scholar]
- 24. Boes E, Fliser D, Ritz E, et al. Apolipoprotein A‐IV predicts progression of chronic kidney disease: The mild to moderate kidney disease study. J Am Soc Nephrol 2006;17;528–536. [DOI] [PubMed] [Google Scholar]
- 25. Vivekanandan‐Giri A, Slocum JL, Buller CL, et al. Urine glycoprotein profile reveals novel markers for chronic kidney disease. Int J Proteomics 2011;2011:214715. [DOI] [PMC free article] [PubMed] [Google Scholar]
- 26. Moestrup SK, Schousboe I, Jacobsen C, Leheste JR, Christensen EI, Willnow TE. Beta2‐glycoprotein‐I (apolipoprotein H) and beta2‐glycoprotein‐I‐phospholipid complex harbor a recognition site for the endocytic receptor megalin. J Clin Invest 1998;102:902–909. [DOI] [PMC free article] [PubMed] [Google Scholar]