

Abstract
Discriminating between auditory signals of different affective value is critical for the survival and success of social interaction of an individual. Anatomical, electrophysiological, imaging, and optogenetics approaches have established that the auditory cortex (AC) by providing auditory information to the lateral amygdala (LA) via long-range excitatory glutamatergic projections has an impact on sound-driven aversive/fear behavior. Here we test the hypothesis that the LA also receives GABAergic projections from the cortex. We addressed this fundamental question by taking advantage of optogenetics, anatomical, and electrophysiology approaches and directly examining the functional effects of cortical GABAergic inputs to LA neurons of the mouse (male/female) AC. We found that the cortex, via cortico-lateral-amygdala somatostatin neurons (CLA-SOM), has a direct inhibitory influence on the output of the LA principal neurons. Our results define a CLA long-range inhibitory circuit (CLA-SOM inhibitory projections → LA principal neurons) underlying the control of spike timing/generation in LA and LA–AC projecting neurons, and attributes a specific function to a genetically defined type of cortical long-range GABAergic neurons in CLA communication.
SIGNIFICANCE STATEMENT It is very well established that cortical auditory inputs to the lateral amygdala are exclusively excitatory and that cortico-amygdala neuronal activity has been shown to be involved in sound-driven aversive/fear behavior. Here, for the first time, we show that the lateral amygdala receives long-range GABAergic projection from the auditory cortex and these form direct monosynaptic inhibitory connections onto lateral amygdala principal neurons. Our results define a cellular basis for direct inhibitory communication from auditory cortex to the lateral amygdala, suggesting that the timing and ratio of excitation and inhibition, two opposing forces in the mammalian cerebral cortex, can dynamically affect the output of the lateral amygdala, providing a general mechanism for fear/aversive behavior driven by auditory stimuli.
Keywords: amygdala, auditory cortex, circuits, fear/aversive behavior, long-range GABAergic, somatostatin
Introduction
Fear is an advantageous response to danger (Blanchard and Blanchard, 1969a,b). Discriminating between auditory signals of different affective value is critical for the survival and success of social interaction of an individual. The transformation of auditory signals to an appropriate behavioral output is achieved by the dynamic interaction of specific neuronal circuits that process this information through different cell types (Bajo and King, 2012; Aizenberg et al., 2015; Xiong et al., 2015; Williamson and Polley, 2019) embedded in specific circuits across the brain.
Amygdala neuronal activity has been shown to be involved in sound-driven aversive/fear behavior (Davis, 1997; Fanselow and LeDoux, 1999; LeDoux, 2014), and lateral amygdala (LA) been the major input nucleus of the amygdala. In absence of the LA and its projections to the basal and central nucleus, the auditory signals cannot gain control of aversive/fear responses. It is therefore crucial to understand the cortical connectivity pattern and dynamics that shape the flow of information in the LA. It is very well established that cortical neurons regulate the activity of neurons in the LA through long-range glutamatergic/excitatory projections, whereas inhibition is mediated by local feedforward and feedback circuits (for review, see Letzkus et al., 2011). It is however worth to note that long-range GABAergic neurons are important circuit elements in many brain areas such as the spiny projection neurons in the striatum and the Purkinje neurons in the cerebellum. Although the existence of cortical long-range GABAergic neurons has been proven anatomically (Seress and Ribak, 1983; Ribak et al., 1986; Tóth and Freund, 1992; Tóth et al., 1993; Freund and Buzsáki, 1996; for review, see Caputi et al., 2013; Tremblay et al., 2016), previous studies have primarily focused on the local cortical circuit organization of GABAergic interneurons (Buzsáki, 1984; Ali et al., 1999; Holmgren et al., 2003; Maccaferri and Lacaille, 2003; Pouille and Scanziani, 2004; Silberberg and Markram, 2007; Pouille et al., 2009, 2013; Stokes and Isaacson, 2010; Hayut et al., 2011; Pfeffer et al., 2013; Crandall and Connors, 2016), and inhibition is frequently described as being exclusively local. Corticofugal long-range subtypes have been described in several cortical areas, including the auditory cortex (AC; Rock et al., 2016, 2018). Current studies suggest that between 1 and 10% of the cortical GABAergic neurons in rodents, cats, and monkeys are categorized as long-range cortical projections (McDonald and Burkhalter, 1993; Tomioka et al., 2005; Higo et al., 2007, 2009; Tomioka and Rockland, 2007). A growing body of evidence from our laboratory and others suggests that many of these projections arise from somatostatin-expressing neurons (Jinno and Kosaka, 2004; Tomioka et al., 2005; Higo et al., 2007, 2009; Tomioka and Rockland, 2007; McDonald et al., 2012; Melzer et al., 2012; Rock et al., 2016), parvalbumin-expressing neurons (Lee et al., 2014; Melzer et al., 2017), and more recently from vasoactive intestinal peptide-expressing neurons (Francavilla et al., 2018).
In this study, we test the hypothesis that the AC has a direct, monosynaptic, inhibitory influence on the neurons of the LA. We addressed this fundamental question using both anterograde and retrograde anatomical methods in conjunction with in vitro optogenetics and electrophysiology. Using these techniques, we demonstrated the existence of somatostatin-expressing neurons in the AC with GABAergic projections to the LA. To directly examine the functional effects of cortical long-range GABAergic inputs on LA neurons, we measured the response of LA principal neurons to optogenetic activation of cortico-lateral-amygdala somatostatin neuron (CLA-SOM) axons. Our in vitro approach is crucial to simplifying and facilitating the targeted mechanistic investigation of CLA-SOM, LA-AC neurons, and synapse in the AC→LA and LA→AC circuit from most of the extrinsic circuitry present in fully intact brain.
Our results describe a previously unknown CLA direct inhibitory circuit (CLA-SOM inhibitory projections → LA principal neurons) underlying the control of spike timing/generation in LA pyramidal neurons and attribute a specific function to a genetically defined type of cortical long-range GABAergic neurons in CLA communication. Overall this suggests that the timing and ratio of cortical excitatory and inhibitory inputs to the LA, by shaping the activity pattern of principal neurons, determines sound-driven aversive/fear behavioral outcomes. Moreover, our whole-brain mapping of the input onto the CLA-SOM neurons reveal that the LA provides inputs to these neurons, which suggests that this connectivity pattern (CLA-SOM inhibitory projections ↔ LA principal neurons) is likely a feature of the CLA inhibitory loop.
Materials and Methods
All animal procedures were approved by the Institutional Animal Care and Use Committee at the University of Texas at San Antonio. Procedures followed animal welfare guidelines set by the National Institutes of Health. Mice used in this experiment were housed in a vivarium maintaining a 12 h light/dark schedule and given ad libidum access to mouse chow and water.
Transgenic mouse lines
The following mouse lines were used in this study:
SOM-Cre: Ssttm2.1(cre)Zjh /J (The Jackson Laboratory, stock #013044); ROSA-tdTomato reporter: B6.CG.Gt(ROSA)26Sortm14(CAG-tdTomato)Hze/J (The Jackson Laboratory, stock #007914); ROSA-eYFP reporter: B6.129X1-Gt(ROSA)26Sortm1(EYFP)Cos/J (The Jackson Laboratory, stock #006148); SOM-Cre homozygous male mice were crossed with ROSA-tdTomato or ROSA-eYFP reporter homozygous female mice to generate SOMCre/tdTomato or SOM-Cre/eYFP (somatostatin-containing neurons expressing both Cre and tdTomato/eYFP) line, respectively.
Viral vectors
AAV1-CaMKII0.4-eGFP-WPRE-rBG, 6.03 × 10¹³ GC/ml (Addgene viral prep #105541-AAV1). AAV1-CAG-FLEX-EGFP-WPRE, titer 3.1 × 10¹³ VG/ml (Addgene viral prep #51502-AAV1).
AAV1-Syn-Flex-ChrimsonR-tdTomato, titer 4.1 × 10¹² GC/ml (UNC Vector Core, AV6554B). AAV1-EF1a-FLEX-GTB, titer 1.82 × 10¹⁰ GC/ml (GT3 core, Salk Institute, Addgene plasmid #26197). RV-EnvA-G-ChR2-mCherry, 2.29 × 10⁸ TU/ml (GT3 core, Salk Institute, Addgene plasmid #32646). AAV9-CAG-hChR2-tdTomato, titer 4 × 10¹² VG/ml (UNC Vector Core, AV4582).
Stereotaxic injections
Basic surgical procedures.
Mice were initially anesthetized with isoflurane (3%; 1 L/min O2 flow) in preparation for the stereotaxic injections detailed in the next section. The mice were head-fixed on a stereotaxic frame (model 1900, Kopf Instruments) using non-rupture ear bars. Anesthesia was maintained at 1–1.5% isoflurane for the duration of the surgery. A warming pad was used to maintain body temperature during the procedure. Standard aseptic technique was followed for all surgical procedures. Injections were performed using a pressure injector (Nanoject III, Drummond Scientific) mounted on the stereotaxic frame. Injections were delivered through a borosilicate glass injection pipette (Wiretrol II, Drummond Scientific) with a taper length of ∼30 mm and a tip diameter of ∼50 μm. The pipette remained in place for 5 min before to start injecting at 1 nl/s rate, 15 s waiting period after each nl, and was left in place for 5 min after the injection to avoid viral backflow along the injection tract. Both male and female mice, P35–P40 at the time of the injection, were used in these experiments.
Anterograde labeling of excitatory and inhibitory projections from AC to LA.
A mixture of AAV1-CaMKII0.4-eGFP-WPRE-rBG and AAV1-Syn-Flex-ChrimsonR-tdTomato stereotaxically injected into the right AC of SOM-Cre mice. The injection pipette was positioned over the right AC (2.5 mm posterior and 4.25–4.35 mm lateral to bregma) and advanced to 0.9–1.1 mm below the surface of the brain. The pipette remained in place for 5 min before the injection began. Fifty nanoliters of a mixture of AAV1-CaMKII0.4-eGFP-WPRE-rBG and AAV1-Syn-Flex-ChrimsonR-tdTomato was delivered over a period of 5–10 min. The pipette was allowed to remain in place for 5 min before being slowly withdrawn.
Anterograde labeling of CLA-SOM neurons.
CLA-SOM neurons in the AC were labeled using AAV1-Syn-Flex-ChrimsonRtdTomato (UNC Vector Core, AV6554B) stereotaxically injected into the right AC of SOM-Cre mice. The injection pipette was positioned over the right AC (2.6 mm posterior and 4.5 mm lateral to bregma) and advanced to 0.9–1.1 mm below the surface of the brain. The pipette remained in place for 5 min before the injection began. Approximately 50 nl of AAV1Syn-Flex-ChrimsonR-tdTomato was delivered over a period of 5–10 min. The pipette was allowed to remain in place for 5 min before being slowly withdrawn.
Retrograde labeling of CLA-SOM neurons.
CLA-SOM neurons in the AC were retrogradely labeled using AAV.GFP.Flex or red Retrobeads (Lumafluor) stereotaxically injected into the right LA of SOM-Cre (n = 9 animals from n = 3 litters) and SOM-Cre-tdTomato mice (n = 4 animals from n = 2 litters). Injections were performed as described before, with the following modifications: stereotaxic coordinates for the LA injection site were 1.4 mm posterior and 3.45 mm lateral to bregma. Approximately 15 nl of AAV.GFP.Flex was delivered at the depth of 3.65 mm below the surface of the brain.
Retrograde labeling of LA-AC neurons.
LA–AC neurons in the LA cortex were labeled using CTB-488 (ThermoFisher Scientific, catalog #C22841) or red Retrobeads stereotaxically injected into the right AC of SOM-Cre mice. Injections were performed in the same manner as previous injections in the AC and using the same AC stereotaxic coordinates.
Anterograde transfection of CLA-SOM neurons with Chrimson.
CLA-SOM neurons in the AC were transfected with Chrimson using AAV.Syn.Flex.Chrimson-tdTomato (UNC Vector Core, AV6554B) stereotaxically injected into the right AC of SOM-Cre mice (n = 6 animals from n = 3 litters). Injections were performed in the same manner as previous injections in the AC and using the same AC stereotaxic coordinates.
Retrograde AAV-RV tracing of monosynaptic input to the CLA-SOM neurons.
For monosynaptic tracing experiments, 100 nl of AAV1-EF1a-FLEX-GTB were injected into the right AC of Som-Cre mice. After 3 weeks, 20 nl of RV-EnvA-ΔG-ChR2-mCherry were injected in the right LA, and animals were transcardially perfused and processed for immunohistochemistry after additional 6 d (n = 3 animals from n = 1 litter).
Quantification of AAV.Chrimson.flex.tdTomato and AAV.CamkII.GFP in AC
Images of the injection site in AC were collected to analyze the distribution of neurons specifically transfected by AAV.Chrimson.Flex.tdTomato in Som-Cre mice compared with nonspecific transfection by AAV.GFP. Tile scan images to cover the entire injection site in a coronal brain slice were acquired at 20× magnification and 16 bit depth with ZEN software (Zeiss) using a Zeiss LSM-710 confocal microscope. Using ImageJ, the area of the virus spread was quantified across the anterior posterior axis from 200-μm-thick coronal slices that contained transfected somata in AC. Background areas of AC not containing visible somata were also defined as regions-of-interest. Using the histogram function of ImageJ, the gray values of the pixels were quantified. The mean and SD of the gray values of the background regions were also quantified. Fluorescent signals in the injection site were defined as those pixels with a gray value 3 SD above the mean of the background region-of-interest in the injection site. Figure 2 shows the average area quantified from 5 to 9 slices containing AAV.Chriimson.Flex.tdTomato and AAV.GFP in the AC (n = 3 animals, n = 1 litter).
Figure 2.

Quantification of the anteroposterior and dorsal-ventral spread of the injection site of AAV.CaMKII.GFP and AAV.flex.Chrimson.tdTomato in the right AC of SOM-Cre transgenic mice. A, Bright-field (top row) and epifluorescence (bottom rows) images of the slices of the injection site of a representative SOM-Cre mouse with AAV.CaMKII.GFP (green) and AAV.flex.Chrimson.tdTomato (red). B, Plot of anterior–posterior spread (left) and dorsoventral medial-lateral spread area (right) of CaMKII.GFP and Chrimson.flex.tdTomato injection in AC. *p < 0.005, t test.
In vitro slice preparation and recordings
We allowed 4–6 weeks for expression of Chrimson or GFP. Mice were anesthetized with isoflurane and decapitated. Coronal slices (300 μm) containing the area of interest (AC, LA) were sectioned on a vibratome (VT1200S, Leica) in a chilled cutting solution containing the following (in mm): 100 choline chloride, 25 NaHCO3, 25 d-glucose, 11.6 sodium ascorbate, 7 MgSO4 3.1 sodium pyruvate, 2.5 KCl, 1.25 NaH2PO4, 0.5 CaCl2. These slices were incubated in oxygenated artificial CSF (ACSF) in a submerged chamber at 35–37°C for 30 min and then room temperature (21–25°C) until recordings were performed. ACSF contained the following (in mm): 126 NaCl, 26 NaHCO3, 10 d-glucose, 2.5 KCl, 2 CaCl2, 1.25 NaH2PO4, 1 MgCl2; osmolarity was ∼290 Osm/L.
Whole-cell recordings were performed in 31–33°C ACSF. Thin-walled borosilicate glass pipettes (Warner Instruments) were pulled on a vertical pipette puller (PC-10, Narishige) and typically were in the range of 3–5MΩ resistance when filled with a cesium-based intracellular solution, which contained the following (in mm): 110 CsOH, 100 d-gluconic acid, 10 CsCl2, 10 HEPES, 10 phosphocreatine, 1 EGTA, 1 ATP, and 0.3–0.5% biocytin. IPSCs were recorded in the voltage-clamp configuration with a holding potential of 0 mV (the calculated reversal potential for glutamatergic excitatory conductances). Intrinsic properties were recorded in the current-clamp configuration using a potassium-based intracellular solution at 31–33°C. Potassium-based intracellular solution contained the following (in mm): 120 potassium gluconate, 20 KCl, 10 HEPES, 10 phosphocreatine, 4 ATP, 0.3 GTP, 0.2 EGTA, and 0.3–0.5% biocytin).
Signals were sampled at 10 kHz and filtered (low-pass filtered) at 4 kHz. Pharmacological blockers used were as follows: CPP (5 μm; Tocris Bioscience), NBQX (10 μm; Abcam), and gabazine (25 μm; Abcam). Hardware control and data acquisition were performed by Ephus (https://www.ephus.org; Suter et al., 2010).
Allen Mouse Brain Atlas map of electrophysiological recording sites of LA principal neurons.
Location of LA principal neurons recorded in Figure 7 was determined by taking a 4× photograph of the position of the glass pipette in LA while performing a whole-cell patch-clamp recording. Recording sites of the amygdala spanned across three 300 μm coronal slices to cover the entire LA. These 4× photographs where then aligned to the corresponding Nissl-stained coronal slice in the Allen Brain Mouse Atlas (−1.430, −1.790, −2.150 mm from bregma) to define the specific location of the somata of the recorded neuron in the atlas. Both voltage- and current-clamp experiments where mapped in different set of atlases.
Figure 7.

Allen Mouse Brain Atlas map of LA principal neurons recording sites. Nissl stain coronal slices from the Allen Mouse Brain Atlas with voltage-clamp (top) and current-clamp (bottom) recordings of individual soma locations of principal neurons in LA (black dots). Bottom shows examples of alignment of 4× images of recording pipette in the slice with the Allen Mouse Brain Atlas to determine the location of the soma of the recorded neuron.
Chrimson photostimulation
CLA-SOM neurons transfected with Chrimson showed Chrimson-tdTomato-positive axons in the LA. Because of variability both in Chrimson expression levels (number of Chrimson molecules per transfected neuron) and transfection efficiency (number of Chrimson-expressing neurons per animal), to minimize the variability from experiment to experiment we performed the electrophysiological recording in the same LA slices (identified by specific landmarks as slice −1, 0, and +1) and with the highest density of Chrimson transfected axons. We recorded IPSCs from putative principal neurons in the LA during photoactivation of the CLA-SOM Chrimson-positive axon terminals. A 615 nm wavelength red LED (CoolLED pE excitation system) and a 60× water-immersion objective was used to photo-activate CLA-SOM Chrimson-positive axon terminals. For retrograde labeling of LA–AC projecting neurons, this paradigm was combined with the injection of 50 nl of red Retrobeads in the right AC 2–4 d before the experiment (n = 7 animals, n = 3 litters).
Delay/silencing of first action potential in LA principal neurons
We recorded from putative principal neurons in the LA in an area containing Chrimson-tdTomato-positive CLA-SOM axons. In current-clamp configuration, a step of current was injected to cause the LA principal neuron to fire 1–3 action potentials. To determine the effect of CLA-SOM projections on the output of LA principal neurons, we photo-activated CLA-SOM Chrimson-positive axons by flashing red light (615 nm) for 3 ms starting 10–50 ms before the first action potential. Combining current injection with photoactivation of CLA-SOM projections delayed the current-evoked action potentials in amygdala principal neurons. The action potential delay due to the combined current injection with photoactivation of CLA-SOM projections was normalized to the onset of the first action potential measured during the current injection alone.
Histology
During whole-cell recordings, neurons were filled with an internal solution containing 0.3–0.5% biocytin. Filled neurons were held for at least 20 min, and then the slices were fixed in a formalin solution (neutral buffered, 10% solution; Sigma-Aldrich) for several days at 4°C. The slices were washed well in PBS (6 times, 10 min per wash) and placed in a 4% streptavidin (AlexaFluor 488, 594, or 680 conjugate; Life Technologies) solution (498 μl of 0.3% Triton X-100 in PBS, 2 μl streptavidin per slice). Slices were allowed to incubate in this solution at 4°C overnight, then washed well in PBS (6 times, 10 min per wash) and mounted with Fluoromount-G (SouthernBiotech) on a glass microscope slide. Confocal images were taken with a Zeiss LSM710 microscope at varying magnifications (3–63×). The identities of neurons recorded in the LA were confirmed by the presence of spines on their dendritic processes when imaged at 40–63× magnification. Individual high-magnification images were stitched together, when necessary, using XuvStitch software (XuvTools). Image adjustment was performed in ImageJ (National Institutes of Health) for brightness/contrast corrections and pseudocoloring. Neurons were morphologically reconstructed in three dimensions using the Simple Neuritr Tracer plugin on ImageJ software (Schindelin et al., 2012).
Immunohistochemistry
Mice were transcardially perfused with 4% paraformaldehyde, brains were dissected, postfixed overnight at 4°C, and coronal sections (100 μm thick) were obtained with a vibratome (VT1200S, Leica). Immunohistochemical procedures were performed on free-floating sections using: rabbit anti-RFP (for tdTomato, 1:500; Rockland, catalog #600-401-379), rabbit anti-GFP AlexaFluor 488 conjugated (for YFP, 1:500; ThermoFisher, catalog #A21311), rat anti-somatostatin (1:200; Millipore, catalog #MAB354), chicken anti-GFP (1:1000; Abcam, ab13970) primary antibodies, followed by AlexaFluor 633 goat anti-rabbit IgG (1:500; Life Technologies), AlexaFluor 633 goat anti-rat (1:500; Life Technologies), and AlexaFluor 488 goat anti-chicken IgG (1:500; Abcam) secondary antibodies.
Experimental design and statistical analysis
Figure error bars represent SEM. Data analysis was performed offline using custom MATLAB (MathWorks) routines. Group comparisons were made using the Student's t test if data were normally distributed and the rank sum test if not, with significance defined as p < 0.05. Statistical analyses were conducted using standard MATLAB (MathWorks) functions.
Results
Anatomical and electrophysiological properties of CLA somatostatin neurons
To visualize long-range GABAergic projections originating in the cortex and terminating in the LA, we injected a combination of AAV.Chrimson-tdTomato.Flex and AAV.CaMKII.GFP into the right AC of SOM-Cre transgenic mice. In this way, we conditionally expressed Chrimson-tdTomato in SOM GABAergic neurons while simultaneously nonspecifically labeling all pyramidal neurons in the AC with GFP (Fig. 1A–D).
Figure 1.

Distribution of AC excitatory and inhibitory projections to the LA. A, Schematic depicting injection site using the SOM-Cre transgenic mouse line to transfect CLA-SOM and excitatory projections to the LA with Chrimson.tdTomato and GFP respectively. B, Top, Bright-field image of a slice containing the AC injection site of AAV.Chrimson.tdTomato.Flex and AAV.CaMKII.GFP in the SOM-Cre transgenic mouse line. Middle, tdTomato fluorescence in the injection site. Bottom, GFP fluorescence in the injection site. C, Left, Top, Epifluorescence image of tdTomato-expressing SOM neurons in the AC. Left, Bottom, Epifluorescence image of GFP-expressing pyramidal neurons (CaMKII-positive) in the AC. Right, Overlay of GFP and tdTomato images. D, Left, Higher-magnification image of GFP-expressing fluorescent axons in the LA. Middle, Higher-magnification image of CLA-SOM tdTomato-expressing fluorescent axons in the LA. Right, Higher-magnification image overlay of GFP and tdTomato images. The dashed line indicates the approximate LA boundaries.
Between the two viruses we found a larger area of transfection, quantified as the distance from the injection site to the most posterior slice showing either GFP- or tdTomato-expressing somata (anteroposterior spread, GFP: 1267 ± 133 μm; tdTomato: 866 ± 133 μm; area, GFP: 2667 ± 379 μm2; tdTomato: 645 ± 168 μm2; p = 2.06 × 10⁻⁴, t test; Fig. 2B). Although our analysis suggests that the spread of Chrimson. tdTomato covers a smaller area than CaMKII.GFP (Fig. 2A,B), we were able to detect Chrimson and CaMKII-positive axons across the entire anterior posterior extent of LA (Fig. 1). Particularly, this method allowed us to visualize the contribution of both long-range excitatory (GFP-expressing axons) and inhibitory (Chrimson-tdTomato-expressing axons) projections originating in the cortex and terminating in the LA (Fig. 1D). The boundaries for the LA were approximated based on bright-field image landmarks and comparison to the Allen Institute for Brain Science coronal mouse atlas.
Although, in our experience, AAV1.Flex viral vectors (Atasoy et al., 2008) exhibited both anterograde and retrograde (Rothermel et al., 2013; Rock et al., 2016, 2018; Zurita et al., 2018) transfection capabilities, when we injected the AAV.Chrimson-tdTomato.Flex virus in the cortex we only observed anterograde labeling of SOM neurons (i.e., no SOM somata transfected in LA; see Fig. 5C). In contrast, when we injected the AAV.CAG.FLEX.EGFP.WPRE virus into the LA, we observed transfected SOM somata both in the injected LA (Fig. 1D, left) and in the ipsilateral AC (Fig. 3B,C). To determine the layer of origin for the long-range CLA-SOM neurons, we injected the AAV.GFP.Flex virus into the right LA of SOM-Cre transgenic mice expressing td-Tomato in all the somatostatin neurons (Taniguchi et al., 2011; Fig. 3A–C). This approach allowed us to visually identify and record from CLA-SOM neurons using whole-cell patch-clamp (Fig. 3D). Confocal images of biocytin-filled CLA-SOM neurons showed that they are similar to SOM GABAergic neurons in their morphology and send an axonal projection into the subcortical white matter as well as to layer 1 [Figs. 3E (morphological-reconstructed CLA-SOM neuron), 4]. We verified their identity based on the comparison with electrophysiological properties of SOM GABAergic neurons (Ma et al., 2006). These properties include a wide action potential and low rheobase (the smallest current step evoking an action potential; Fig. 3D, bottom; action potentials in CLA-SOM neurons, shown in black, are wider than those from fast-spiking GABAergic neurons, example in red). The responses to current steps in CLA-SOM neurons were typical for SOM GABAergic neurons (Fig. 3D). Basic electrophysiological properties for CLA-SOM neurons (n = 15) included (Fig. 3D): resting membrane potential, −62.8 ± 2.4 mV; input resistance, 245.8 ± 43.9 MΩ; membrane time constant, 0.72 ± 0.09 ms; rheobase, 70 ± 16.4 pA (data not shown); action potential threshold, −42.4 ± 1.1 mV; action potential height, 62.9 ± 2.6 mV; action potential half-width, 0.42 ± 0.03 ms; F/I slope, 0.33 ± 0.03 Hz/pA step data not shown. Using the combination of this virus approach and whole-cell patch-clamp, allowed us to determine also the laminar location of CLA-SOM neurons. Particularly, their somata were spanning all the layers but primarily present in layers 5 and 6 of the AC (17 of 25, 68% of the CLA neurons in layers 5 and 6; Fig. 3F,G).
Figure 5.

Photostimulation of auditory CLA-SOM projections elicits direct inhibition and modulates action potentials in LA principal neurons. A, Schematic depicting injection site using the SOM-Cre transgenic mouse line to transfect CLA-SOM projections to the LA with Chrimson. Top, AC: AAV.Chrimson.flex injection site. Bottom, Lateral amygdala: red, CLA-SOM Chrimson-tdTomato-positive axons. B, Experimental paradigm for photo-stimulating Chrimson-positive CLA-SOM projections while recording from LA neurons. C, Left, Epifluorescence images of a slice containing the LA showing expression of Chrimson-tdTomato following injection of AAV.Chrimson.Flex into the AC plus biocytin-labeled LA principal neurons. Middle, High-resolution epifluorescence image of a biocytin-labeled principal neuron in the LA. The dashed box indicates the location of the image on the right. Right, High-resolution epifluorescence image of spines from the biocytin-labeled principal neuron in the LA. D, Example of IPSCs recorded at 0 mV from a principal neuron before (red trace) and after application of ionotropic glutamate receptor antagonists (NBQX, 10 μm; CPP, 5 μm; magenta trace) and GABAA receptor antagonist (gabazine, 25 μm: black trace). E, Left, Plot of onset latencies recorded in LA principal neurons using three different red LED power (n = 18) including group averages (± SEM). Middle, Plot of IPSCs peaks calculated for LA principal neurons using three different red LED powers, including group averages (±SEM). Right, Plot of IPSCs charge transfer calculated for individual IPSCs for LA principal neurons using three different red LED powers, including group averages (±SEM). *p < 0.05, t test. F, Response of a principal neurons in the whole-cell current-clamp configuration to current injection (130 pA, 100 ms; n = 9; black trace). Response of the principal neuron (red trace) to current injection with photostimulation of CLA-SOM projections (red bar; 1–10 ms). G, Response of a principal neurons in the whole-cell current-clamp configuration to current injection (150 pA, 1000 ms; n = 5; black trace). Response of the principal neuron (red trace) to current injection with photostimulation of CLA-SOM projections (red bar; 1–10 ms). H, Summary of Chrimson-mediated delay of action potential generation in LA principal neurons (n = 9) during current injection combined with photostimulation of the Chrimson CLA-SOM projections. Delay was relative to the onset of the first action potential measured during the current injection alone.
Figure 3.

Morphological characteristics, electrical, and molecular properties of long-range CLA-SOM neurons in the mouse AC. A, Schematic depicting injection site using the SOM-Cre-tdTomato transgenic mouse line to identify CLA-SOM neurons in the AC. Bottom, LA: green, CLA-SOM GFP-positive axons; red, SOM tdTomato-positive interneurons. Top, AC: AAV.GFP.Flex injection site; yellow, CLA-SOM somata coexpressing GFP and tdTomato. B, Epifluorescence images of SOM GFP-positive neurons. Left, Top, Bright-field image of a slice containing the LA injection site of AAV.GFP.Flex in the SOM-Cre.tdTomato transgenic mouse line. Left, Middle, tdTomato-expressing SOM neurons in the SOM-Cre-tdTomato transgenic mouse line. Left, Bottom, GFP-positive SOM neurons in the LA containing the viral injection of AAV.GFP.Flex in the SOM-Cre-tdTomato transgenic mouse line. The dashed line indicates the LA boundaries containing the LA injection site of AAV.GFP.Flex. Top, Right Higher-magnification of bright-field image of a slice containing the LA injection site of AAV.GFP.Flex in the Som-Cre.tdTomato transgenic mouse line. Right, Middle, Higher-magnification image of tdTomato-expressing SOM neurons in the SOM-Cre-tdTomato transgenic mouse line. Right, Bottom, Higher-magnification image of GFP-positive SOM neurons in the LA containing the viral injection of AAV.GFP.Flex in the SOM-Cre-tdTomato transgenic mouse line. C, Left, Overlay image of GFP-positive SOM neurons in the AC identified by viral injection of AAV.GFP.Flex and SOM neurons in the LA of SOM-Cre-tdTomato transgenic mouse line. The dashed box and the arrows indicate the location of the somata of CLA-SOM neurons. Top, Right, GFP-positive CLA-SOM neurons in the AC retrogradely identified by viral injection of AAV.GFP.Flex in the LA of SOM-Cre-tdTomato transgenic mouse line. Middle, Right, tdTomato-expressing SOM neurons in the SOM-Cre-tdTomato transgenic mouse line. Bottom, Left, Overlay of GFP and tdTomato images. The arrow indicates the location of the CLA-SOM neurons. D, Top, Summary plot of the following: Vrest, resting membrane potential; Ri, input resistance; Tau, membrane time constant; rheobase, the smallest current step evoking an action potential; AP height, action potential height; AP half-width, action potential half-width from CLA-SOM neurons (n = 15), including group averages (±SEM). Bottom, Train of action potentials recorded in a GFP-positive CLA-SOM neuron during step current injection (1.0 s, 100 pA pulse). Top, Single action potential from GFP-positive CLA-SOM neuron (black); compare to an action potential from a fast-spiking interneuron (red). E, Morphological reconstruction of one CLA-SOM neuron (dendrites, black; axons, red). F, Plot shows the group average soma location (±SEM) of CLA-SOM neurons. The black circles mark the absolute distances from the pia to the soma (CLA-SOM, n = 25, animals, n = 12). G, Plot shows the dorsoventral soma location of CLA-SOM neurons (CLA-SOM, n = 18, animals, n = 8). H, Schematic depicting the injection site of red RetroBeads using the SOM-Cre-eYFP transgenic mouse line to identify CLA-SOM neurons in the AC. I, Overlay image of red-positive neurons in the AC identified by injection of retrograde beads in LA and SOM eYFP neurons in the SOM-Cre-eYFP transgenic mouse line. J, High-magnification epifluorescence images of SOM red-beads-positive neurons. Top, Left, eYFP-positive SOM neurons in the AC in the SOM-Cre-tdTomato transgenic mouse line. Middle, Left, CLA-SOM neurons identified by anatomical retrograde labeling in the SOM-Cre-eYFP transgenic mouse line. Bottom, Left, Overlay of eYFP and retrograde beads labeled CLA-SOM neurons. The arrows indicate the location of the read beads in the CLA-SOM neurons. Top, Right, CLA-SOM neurons immunostained with anti-SOM. Middle, Left, CLA-SOM neurons identified by anatomical retrograde labeling in the SOM-Cre-eYFP transgenic mouse line. Bottom, Right, Overlay of CLA-SOM neurons immunostained with anti-SOM and retrograde beads labeled CLA-SOM neurons. The arrows indicate the location of the read beads in the CLA-SOM neurons.
Figure 4.

Single-cell reconstruction of the dendritic arborization of biocytin-filled retrograde labeled CLA-SOM neurons. All neurons are oriented toward pia (top).
In a different set of experiments, to visualize long-range SOM projections originating in the AC and terminating in the LA, we injected well established non-viral retrograde tracers (Fig. 3H), such as the red RetroBeads, into the LA of SOM-Cre-YFP transgenic mice and analyzed retrograde-labeled cells in the AC. The injection site was centered primarily in the dorsal region of the LA. From the center of the injection, the spread of the tracer was ∼600 μm in the anteroposterior plane and ∼300 μm in the dorsoventral plane. For all of our injections (n = 4 animals), there was no evidence and/or negligible of tracer deposit or spillover in the striatum or the basal amygdala. These are two brain areas bordering the LA, and are known to receive corticofugal projections from the AC (Winer, 2006). Using this method, we found that, in CLA-SOM neurons, YFP was colocalized with red RetroBeads in the AC (Fig. 3J, left) and were spanning from layers 2–6 of the AC in the hemisphere ipsilateral to the injection site (Fig. 3I). Moreover, retrogradely labeled CLA-SOM neurons were identified throughout the entire AC, including the dorsal, primary, and ventral areas. We further characterized the CLA-SOM by confirming their expression of the neuropeptide somatostatin (Fig. 3J, right).
These multiple complementary datasets confirm that, in the entire AC, long-range CLA-SOM GABAergic neurons send a direct projection to the LA (CLA-SOM inhibitory projections → LA principal neurons).
Do CLA somatostatin neurons inhibit LA neurons?
To determine the connectivity pattern of CLA-SOM neurons onto neurons in the LA, we used an optogenetic approach in which we conditionally expressed Chrimson in SOM neurons by injecting AAV.Chrimson.Flex into the right AC of SOM-Cre transgenic mice (Fig. 5A,B; injection site as in Fig. 1B). After 4–6 weeks, we recorded from the right LA, in which Chrimson-positive axons could be observed (Fig. 5C). As already reported for ChR2-positive axons (Petreanu et al., 2007; Rock and Apicella, 2015), Chrimson-positive axons remain photo-excitable even when severed from their parent somata. To determine the synaptic properties of CLA-SOM projections onto LA neurons, we photo-activated CLA-SOM Chrimson-positive axons by flashing red light (615 nm) for 3 ms at three different powers (0.2, 0.7, and 1.3 W/cm2) during whole-cell recordings from LA neurons. IPSCs (Fig. 5D, red trace) were isolated by applying a command potential of 0 mV (the calculated reversal potential for glutamatergic excitatory conductance). The IPSCs onset of the photo-evoked response was 3.5 ± 0.2 ms (0.2 W/cm2; n = 18), 2.8 ± 0.1 ms (0.7 W/cm2; n = 19), and 2.6 ± 0.1 ms (1.3 W/cm2; n = 20), respectively (Fig. 5E, left). Our quantification revealed that the onset of the photo-evoked responses was significantly faster at the 1.3 W/cm2 LED power compared with those at 0.2 W/cm2 (p = 2.25 × 10⁻⁴, t test) and significantly faster at 0.7 W/cm2 LED power compared with those at 0.2 W/cm2 (p = 0.0025, t test; Fig. 5E, left).
This latency is consistent with the IPSCs being the result of a monosynaptic inhibitory input from the cortex and not a local LA feedback inhibitory network recruited by cortical projections. Blocking excitatory neurotransmission by application of glutamate receptor antagonists NBQX and CPP did not abolish the CLA-SOM-Chrimson-evoked synaptic IPSCs (Fig. 5D, magenta trace; n = 5). In contrast, blocking inhibitory neurotransmission by application of gabazine (Fig. 5D, black trace; n = 5) completely abolished the CLA-SOM-Chrimson-evoked synaptic IPSCs, confirming they were elicited by direct cortical inhibitory transmission. Basic biophysical properties for CLA-SOM-Chrimson-evoked synaptic IPSCs (n = 20) included (Fig. 5E): peak: 61.8 ± 11.7 pA (0.2 W/cm2), 75.7 ± 13.3 pA (0.7 W/cm2), 80.1 ± 12.9 pA (1.3 W/cm2); charge: 1.4 ± 0.3 pC (0.2 W/cm2), 2.1 ± 0.4 pC (0.7 W/cm2), 2.4 ± 0.4 pC (1.3 W/cm2). Biocytin-filled neurons were post hoc morphologically identified as principal neurons by the presence of dendritic spines (Figs. 5C, right, white arrows, 6). Fifteen of 18 neurons were recovered after patching and were processed for imaging; all 15 of these neurons showed a high density of dendritic spines at 40–63× magnification (Fig. 6). These data reveal that a large proportion of LA principal neurons (Fig. 7) receive direct inhibitory input driven by CLA-SOM neurons but does not exclude the possibility that other LA neurons also receive inhibitory input from these projections.
Figure 6.

Single-cell reconstruction of the dendritic arborization of biocytin-filled LA principal neurons. Each neuron displays high-density dendritic spines, as showed in the corresponding high resolution confocal images. Dashed boxes indicate the location of the confocal images for each neuron.
To determine how CLA-SOM neurons affect the output of LA neurons, we took advantage of the same viral approach described above. We obtained whole-cell recordings from principal neurons while injecting a step of current causing the neurons to spike between 1 and 3 action potentials (Fig. 5F,G, black traces). We then photo-activated CLA-SOM Chrimson-positive axons by flashing red light (615 nm) for 3 ms starting 10–50 ms before the first action potential. Combining current injection with photoactivation of CLA-SOM Chrimson-positive axons, we observed a delay of the first action potential (Fig. 5F,G, red traces), with an average delay of 23.6 ± 3.3 ms (n = 9; Fig. 5H). Overall, these results indicate that CLA-SOM projections act directly on LA principal neurons and have the ability to affect spike generation and timing in these neurons.
CLA somatostatin neurons inhibit LA–AC projecting neurons
The LA is characterized by principal neurons that project locally and outside the amygdala (McDonald, 1998). Recently, Yang et al. (2016) identified a previous unexplored pathway from the LA to the AC (LA–AC projecting neurons) and found that these connections are associated with fear memory. We examined how activity of CLA-SOM neurons regulates activity in LA–AC pathway. To address this question, we used an optogenetic approach in SOM-Cre transgenic mice (Fig. 8A,B) in which LA–AC projecting neurons are retrogradelly labeled by injecting red RetroBeads in the right AC (Fig. 8C). In these mice, AAV.Chrimson.Flex injected in the AC induces Chrimson expression in CLA-SOM neurons (Fig. 8D,E). To determine the CLA-SOM synaptic connections onto the LA–AC projecting neurons, we recorded in coronal brain slices from LA–AC neurons in the LA ipsilateral to the injection site. Three of 8 neurons were recovered after patching and were processed for imaging; all 3 of these neurons showed a high density of dendritic spines at 40–63× magnification. CLA-SOM-Chrimson-evoked synaptic IPSCs were not blocked by application of NBQX and CPP, but completely blocked by application of gabazine (Fig. 8F). The peak (69.2 ± 20.7 pA, 0.2 W/cm2; 96.4 ± 22.9 pA, 0.7 W/cm2; 99.7 ± 21.1 pA, 1.3 W/cm2) and charge (1.9 ± 0.4 pC, 0.2 W/cm2; 2.6 ± 0.6 pC, 0.7 W/cm2; 2.7 ± 0.5 pC, 1.3 W/cm2) of the maximal IPSCs were used as measures of the strength of the CLA-SOM projections to LA–AC neurons (n = 8; Fig. 8G). Our quantification also revealed that the onset of the photo-evoked responses was significantly faster at the 1.3 W/cm2 LED power compared with those at 0.2 W/cm2 (p = 0.0011, t test) and significantly faster at 0.7 W/cm2 LED power compared with those at 0.2 W/cm2 (p = 0.0127, t test; Fig. 8G, left).
Figure 8.

Auditory CLA-SOM neurons innervate LA–AC projecting neurons. A, Schematic depicting injection site using the SOM-Cre transgenic mouse line to transfect CLA-SOM projections to the LA with Chrimson and retrogradely label LA–AC projecting neurons. Top, AC: AAV.Chrimson.flex and red RetroBeads injection site. Bottom, LA: red CLA-SOM Chrimson-tdTomato-positive axons and retrograde labeled LA–AC projecting neurons. B, Experimental paradigm for photo-stimulating Chrimson-positive CLA-SOM projections while recording from retrogradely identified LA–AC projecting neurons. C, Bright-field (left) and epifluorescence (right) images of a slice containing the AC injection site for AAV.Chrimson.Flex and red RetroBeads. D, Epifluorescence (left) image of a slice containing the LA showing expression of Chrimsom-tdTomato (red) and LA–AC principal neurons (green, dashed box) following injection of AAV.Chrimsom.Flex and red RetroBeads into the AC. The dashed line indicates the approximate LA boundaries. E, Left, High-resolution epifluorescence image of Chrimson-positive CLA-SOM projections. Middle, High-resolution epifluorescence image of biocytin-labeled LA-AC projecting neurons. Right, High-resolution epifluorescence image of a LA-AC red-beads-positive neuron. F, Example of IPSCs recorded at 0 mV from a LA–AC neuron before (red trace) and after application of ionotropic glutamate receptor antagonists (NBQX, 10 μm; CPP 5 μm; magenta trace) and GABAA receptor antagonist (gabazine, 25 μm; black trace). G, Left, Plot of onset latencies recorded in LA–AC neurons using three different red LED power (n = 8 neurons, n = 6 animals) including group averages (± SEM). Middle, Plot of IPSCs peaks calculated for LA–AC neurons using three different red LED powers, including group averages (±SEM). Right, Plot of IPSCs charge transfer calculated for individual IPSCs for LA–AC principal neurons using three different red LED powers, including group averages (±SEM). *p < 0.05, t test.
Together, these results indicate that CLA-SOM neurons innervate LA–AC projecting neurons in the LA (CLA-SOM inhibitory projections → LA–AC principal neurons).
In vivo monosynaptic circuit mapping through Cre-dependent targeting of CLA-SOM neurons
To determine whether CLA-SOM receive reciprocal innervation from LA–AC principal neurons, as well as from other brain areas, we applied a monosynaptic retrograde tracing approach (Oh et al., 2014). We first injected the right AC of SOM-Cre animals with AAV1-EF1a-flex-GTB helper virus, which encodes for the fluorescent reporter GFP (as a reporter), the TVA800 avian receptor (for pseudotyped rabies virus entry), and rabies G-protein (for rabies virus cell exits in a retrograde fashion), in a Cre-dependent manner. The subsequent injection of pseudotyped rabies virus (RV) EnvA-ΔG-ChR2-mCherry virus in the right LA allowed the infection of local CLA-SOM axons through the TVA receptor (Fig. 9A). CLA-SOM neurons (starter neurons) in the right AC can therefore be identified by the double expression of GFP and mCherry, and could spread newly synthetized RV-ΔG-ChR2-mCherry virions to their presynaptic partners, which in turn will be identified by the expression of mCherry only (Fig. 9B). A brain-wide analysis revealed that the vast majority of CLA-SOM presynaptic neurons are localized in AC, and a small fraction in LA (Fig. 9C), MGB, and non-auditory cortical areas (data not shown). As additional control, RV-EnvA-ΔG-ChR2-mCherry was injected in a SOM-Cre mouse: after 6 d, no mCherry-expressing cells were observed, neither in the proximity of the injection site, nor in more distal regions, indicating that the RV could infect cells only when in combination with TVA-expressing neurons. This indicates that a portion of LA–AC neurons is synaptically connected with CLA-SOM neurons in the AC.
Figure 9.

Retrograde AAV-RV tracing of monosynaptic input to the CLA-SOM neurons. A, Design of viral vectors for AAV-RV-mediated monosynaptic retrograde tracing and experimental timeline for unilateral injections of the helper AAV in the AC and the pseudotyped RV in the LA of SOM-Cre transgenic mice. B, Schematic illustration of the of the CLA-SOM starter neuron(green/red) transfected with AAV.TVA.G-protein (green) and RV (red) to retrograde trans-synaptically label the monosynaptic input neurons (red only). C, Bright-field (top left) and epifluorescence (top middle and right) images of a slice containing the AC showing the CLA-SOM (starter) neurons and the local input neurons. The dashed box and the arrows indicate the location of the somata of CLA-SOM neurons and the local input neurons. Bottom left, Bright-field and epifluorescence (bottom middle and right) images of a slice showing LA presynaptic neurons (dashed box) to the CLA-SOM neurons. The dashed line indicates the approximate LA boundaries.
Discussion
Previous studies have extensively characterized the neuronal circuits underlying fear conditioning (Janak and Tye, 2015). The auditory signals reach the LA via the auditory thalamus and AC, then transfer to the basolateral and the central amygdala, which in turn projects to the brainstem that controls fear/aversive behavior (McDonald, 1998). Particularly, by using anatomical, electrophysiological, imaging, and optogenetics approaches these studies have established that cortical neurons have an impact on sound-driven aversive/fear behavior by regulating the activity of neurons in the LA through long-range glutamatergic/excitatory projections, whereas inhibition is mediated by local feedforward and feedback circuits (for review, see Letzkus et al., 2011; Janak and Tye, 2015). In this study, we have identified a previously unexplored CLA long-range inhibitory circuit (CLA-SOM inhibitory projections → LA principal neurons) underlying the control of LA principal neurons output (Fig. 10). We also established that the CLA-SOM neurons innervate LA principal neurons that are a component of a new feedback pathway from LA to the AC (CLA-SOM inhibitory projections → LA–AC projecting neurons), and (LA–AC projecting neurons → CLA-SOM inhibitory projections), that it is important for the expression of fear memory (Yang et al., 2016).
Figure 10.
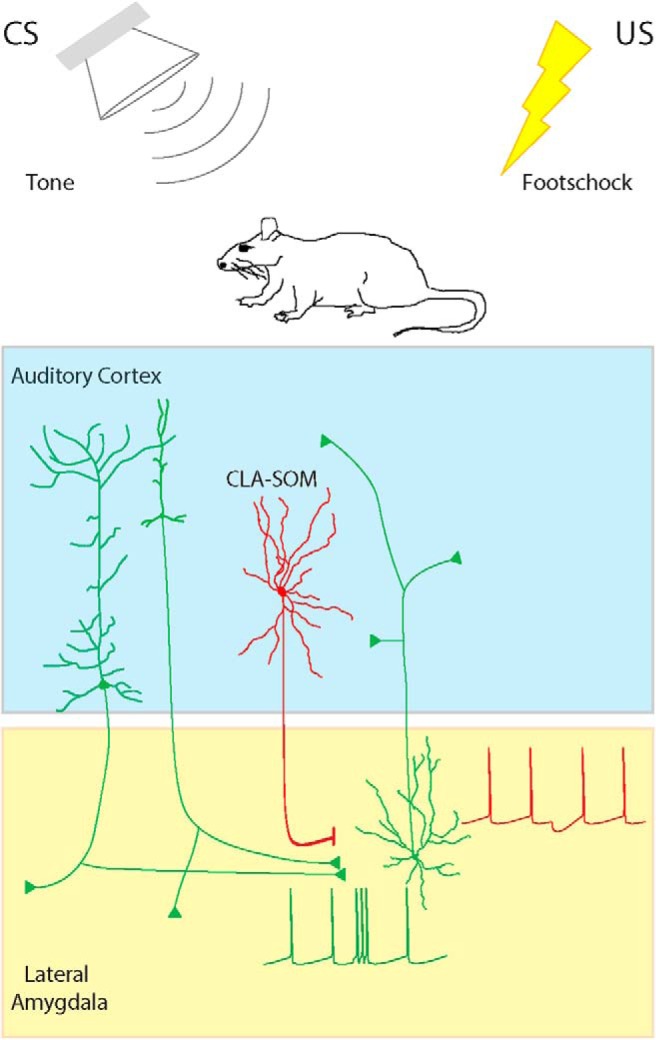
Summary diagram: CLA-SOM neurons directly inhibit principal neurons and LA–AC projecting neurons in the LA. Auditory CLA-SOM projections modulate the activity of LA–AC and principal neurons by direct monosynaptic inhibition. Green lines, Excitatory inputs from pyramidal neurons; red line, inhibitory input from CLA-SOM neurons.
Discriminating between auditory signals of different affective value is critical for the survival and success of social interaction of an individual. Auditory fear conditioning has been used as a behavioral task in which animals learn to associate a neutral stimulus (sound) with an aversive stimulus (footshock), that lead the animal to exhibit a fear response to the sound presentation alone. The amygdala is the key brain region critical for the formation of auditory fear memory (Goosens and Maren, 2001). Particularly, auditory fear conditioning is recognized to involve a Hebbian plasticity mechanism within the LA, whereby a non-strong auditory input [conditioned stimulus (CS)] on LA neurons are potentiated by simultaneous strong depolarization produced by the somatosensory input processing the unconditioned stimulus. The so obtained potentiation of the auditory input increases the probability that the LA neurons will increase the cell firing when an auditory CS signals is presented again. This model is supported by work both in vitro (Rumpel et al., 2005; Clem and Huganir, 2010) and in vivo (Quirk et al., 1995; Rogan and LeDoux, 1995). For long time, it has been assumed that memories are encoded by modification of synaptic strength via two principal cellular mechanisms such as long-term potentiation (LTP) and long-term depression. Only lately, Nabavi et al. (2014) were able to show the causal link between these synaptic processes and memory by conditioning an animal to associate a footshock with optogenetic stimulation of auditory projections to the amygdala.
Recently, Yang et al. (2016) demonstrated that a pathway from the LA to the AC leads to structural rearrangements of presynaptic boutons and postsynaptic spines of auditory cortical pyramidal neurons. Particularly, this amygdala-cortical projection is important to fear memory expression. Moreover, Namburi et al. (2015) found that the LA projecting neurons have the ability to differentially mediate the acquisition of associative memories of stimuli that predict positive and negative outcomes. Since, the acquisition of fear (Miserendino et al., 1990) has been show to induce LTP of synapses onto LA neurons, by increasing the postsynaptic AMPA receptor-mediated currents in an NMDA-dependent manner that required the simultaneous release of glutamate and depolarization of the postsynaptic neurons. Namburi et al. (2015) found that optogenetic silencing of LA neurons during the conditioned–unconditioned behavioral paradigm impaired the conditioned freezing by blocking the NMDAR-dependent LTP mechanism to occur.
In an additional study, Chen et al. (2015) demonstrated that motor learning is characterized by structural rearrangements of presynaptic boutons of cortical SOM interneurons, whereas Kato et al. (2015) demonstrated that local SOM neurons gate cortical information flow based on the behavioral relevance of the stimulus. Only recently, Gillet et al. (2017) showed that learning related changes in SOM cell activity may help to regulate CS+ and CS− sensory representations during fear memory retrieval. Further experiments are needed to understand the functional significance of this direct cortical inhibition to the LA, but in combination with the above mentioned studies it invites to speculate that CLA-SOM neurons might play a role in mechanisms underlying spine dynamics by inducing a specific reorganization of dendritic excitatory synapses of LA principal neurons, including the LA–AC projecting neurons and have consequences on learning and/or memory retrieval.
Our results establish a previously unknown cortico-amygdala long-range inhibitory circuit (CLA-SOM inhibitory projections → amygdala principal neurons) underlying the control of spike timing/generation in LA and LA–AC neurons and attribute a specific function to a genetically defined type of cortical neuron in cortico-amygdala communication. We have shown that the LA principal neurons, as well the LA–AC projecting neurons, receive not only glutamatergic excitatory inputs from the cortex, but also inhibitory inputs. This may suggest that the timing and ratio of excitation and inhibition, two opposing forces in the mammalian cerebral cortex, can dynamically affect the output of the LA, providing a general mechanism for fear/aversive behavior driven by auditory stimuli.
Footnotes
This work was supported by the NIH. We thank G. Gaufo for help with confocal imaging.
The authors declare no competing financial interests.
References
- Aizenberg M, Mwilambwe-Tshilobo L, Briguglio JJ, Natan RG, Geffen MN (2015) Bidirectional regulation of innate and learned behaviors that rely on frequency discrimination by cortical inhibitory neurons. PLoS Biol 13:e1002308. 10.1371/journal.pbio.1002308 [DOI] [PMC free article] [PubMed] [Google Scholar]
- Ali AB, Bannister AP, Thomson AM (1999) IPSPs elicited in CA1 pyramidal cells by putative basket cells in slices of adult rat hippocampus. Eur J Neurosci 11:1741–1753. 10.1046/j.1460-9568.1999.00592.x [DOI] [PubMed] [Google Scholar]
- Atasoy D, Aponte Y, Su HH, Sternson SM (2008) A FLEX switch targets channelrhodopsin-2 to multiple cell types for imaging and long-range circuit mapping. J Neurosci 28:7025–7030. 10.1523/JNEUROSCI.1954-08.2008 [DOI] [PMC free article] [PubMed] [Google Scholar]
- Bajo VM, King AJ (2012) Cortical modulation of auditory processing in the midbrain. Front Neural Circuits 6:114. 10.3389/fncir.2012.00114 [DOI] [PMC free article] [PubMed] [Google Scholar]
- Blanchard RJ, Blanchard DC (1969a) Crouching as an index of fear. J Comp Physiol Psychol 67:370–375. 10.1037/h0026779 [DOI] [PubMed] [Google Scholar]
- Blanchard RJ, Blanchard DC (1969b) Passive and active reactions to fear-eliciting stimuli. J Comp Physiol Psychol 68:129–135. 10.1037/h0027676 [DOI] [PubMed] [Google Scholar]
- Buzsáki G. (1984) Feed-forward inhibition in the hippocampal formation. Prog Neurobiol 22:131–153. 10.1016/0301-0082(84)90023-6 [DOI] [PubMed] [Google Scholar]
- Caputi A, Melzer S, Michael M, Monyer H (2013) The long and short of GABAergic neurons. Curr Opin Neurobiol 23:179–186. 10.1016/j.conb.2013.01.021 [DOI] [PubMed] [Google Scholar]
- Chen SX, Kim AN, Peters AJ, Komiyama T (2015) Subtype-specific plasticity of inhibitory circuits in motor cortex during motor learning. Nat Neurosci 18:1109–1115. 10.1038/nn.4049 [DOI] [PMC free article] [PubMed] [Google Scholar]
- Clem RL, Huganir RL (2010) Calcium-permeable AMPA receptor dynamics mediate fear memory erasure. Science 330:1108–1112. 10.1126/science.1195298 [DOI] [PMC free article] [PubMed] [Google Scholar]
- Crandall SR, Connors BW (2016) Diverse ensembles of inhibitory interneurons. Neuron 90:4–6. 10.1016/j.neuron.2016.03.022 [DOI] [PubMed] [Google Scholar]
- Davis M. (1997) Neurobiology of fear responses: the role of the amygdala. J Neuropsychiatry Clin Neurosci 9:382–402. 10.1176/jnp.9.3.382 [DOI] [PubMed] [Google Scholar]
- Fanselow MS, LeDoux JE (1999) Why we think plasticity underlying Pavlovian fear conditioning occurs in the basolateral amygdala. Neuron 23:229–232. 10.1016/S0896-6273(00)80775-8 [DOI] [PubMed] [Google Scholar]
- Francavilla R, Villette V, Luo X, Chamberland S, Muñoz-Pino E, Camiré O, Wagner K, Kis V, Somogyi P, Topolnik L (2018) Connectivity and network state-dependent recruitment of long-range VIP-GABAergic neurons in the mouse hippocampus. Nat Commun 9:5043. 10.1038/s41467-018-07162-5 [DOI] [PMC free article] [PubMed] [Google Scholar]
- Freund TF, Buzsáki G (1996) Interneurons of the hippocampus. Hippocampus 6:347–470. [DOI] [PubMed] [Google Scholar]
- Gillet SN, Kato HK, Justen MA, Lai M, Isaacson JS (2017) Fear learning regulates cortical sensory representations by suppressing habituation. Front Neural Circuits 11:112. 10.3389/fncir.2017.00112 [DOI] [PMC free article] [PubMed] [Google Scholar]
- Goosens KA, Maren S (2001) Contextual and auditory fear conditioning are mediated by the lateral, basal, and central amygdaloid nuclei in rats. Learn Mem 8:148–155. 10.1101/lm.37601 [DOI] [PMC free article] [PubMed] [Google Scholar]
- Hayut I, Fanselow EE, Connors BW, Golomb D (2011) LTS and FS inhibitory interneurons, short-term synaptic plasticity, and cortical circuit dynamics. PLoS Comput Biol 7:e1002248. 10.1371/journal.pcbi.1002248 [DOI] [PMC free article] [PubMed] [Google Scholar]
- Higo S, Udaka N, Tamamaki N (2007) Long-range GABAergic projection neurons in the cat neocortex. J Comp Neurol 503:421–431. 10.1002/cne.21395 [DOI] [PubMed] [Google Scholar]
- Higo S, Akashi K, Sakimura K, Tamamaki N (2009) Subtypes of GABAergic neurons project axons in the neocortex. Front Neuroanat 3:25. 10.3389/neuro.05.025.2009 [DOI] [PMC free article] [PubMed] [Google Scholar]
- Holmgren C, Harkany T, Svennenfors B, Zilberter Y (2003) Pyramidal cell communication within local networks in layer 2/3 of rat neocortex. J Physiol 551:139–153. 10.1113/jphysiol.2003.044784 [DOI] [PMC free article] [PubMed] [Google Scholar]
- Janak PH, Tye KM (2015) From circuits to behaviour in the amygdala. Nature 517:284–292. 10.1038/nature14188 [DOI] [PMC free article] [PubMed] [Google Scholar]
- Jinno S, Kosaka T (2004) Parvalbumin is expressed in glutamatergic and GABAergic corticostriatal pathway in mice. J Comp Neurol 477:188–201. 10.1002/cne.20246 [DOI] [PubMed] [Google Scholar]
- Kato HK, Gillet SN, Isaacson JS (2015) Flexible sensory representations in auditory cortex driven by behavioral relevance. Neuron 88:1027–1039. 10.1016/j.neuron.2015.10.024 [DOI] [PMC free article] [PubMed] [Google Scholar]
- LeDoux JE. (2014) Coming to terms with fear. Proc Natl Acad Sci U S A 111:2871–2878. 10.1073/pnas.1400335111 [DOI] [PMC free article] [PubMed] [Google Scholar]
- Lee AT, Vogt D, Rubenstein JL, Sohal VS (2014) A class of GABAergic neurons in the prefrontal cortex sends long-range projections to the nucleus accumbens and elicits acute avoidance behavior. J Neurosci 34:11519–11525. 10.1523/JNEUROSCI.1157-14.2014 [DOI] [PMC free article] [PubMed] [Google Scholar]
- Letzkus JJ, Wolff SB, Meyer EM, Tovote P, Courtin J, Herry C, Lüthi A (2011) A disinhibitory microcircuit for associative fear learning in the auditory cortex. Nature 480:331–335. 10.1038/nature10674 [DOI] [PubMed] [Google Scholar]
- Ma Y, Hu H, Berrebi AS, Mathers PH, Agmon A (2006) Distinct subtypes of somatostatin containing neocortical interneurons revealed in transgenic mice. J Neurosci 26:5069–5082. 10.1523/JNEUROSCI.0661-06.2006 [DOI] [PMC free article] [PubMed] [Google Scholar]
- Maccaferri G, Lacaille JC (2003) Interneuron diversity series: hippocampal interneuron classifications—making things as simple as possible, not simpler. Trends Neurosci 26:564–571. 10.1016/j.tins.2003.08.002 [DOI] [PubMed] [Google Scholar]
- McDonald AJ. (1998) Cortical pathways to the mammalian amygdala. Prog Neurobiol 55:257–332. 10.1016/S0301-0082(98)00003-3 [DOI] [PubMed] [Google Scholar]
- McDonald AJ, Mascagni F, Zaric V (2012) Subpopulations of somatostatin-immunoreactive nonpyramidal neurons in the amygdala and adjacent external capsule project to the basal forebrain: evidence for the existence of GABAergic projection neurons in the cortical nuclei and basolateral nuclear complex. Front Neural Circuits 6:46. 10.3389/fncir.2012.00046 [DOI] [PMC free article] [PubMed] [Google Scholar]
- McDonald CT, Burkhalter A (1993) Organization of long-range inhibitory connections with rat visual cortex. J Neurosci 13:768–781. 10.1523/JNEUROSCI.13-02-00768.1993 [DOI] [PMC free article] [PubMed] [Google Scholar]
- Melzer S, Michael M, Caputi A, Eliava M, Fuchs EC, Whittington MA, Monyer H (2012) Long range-projecting GABAergic neurons modulate inhibition in hippocampus and entorhinal cortex. Science 335:1506–1510. 10.1126/science.1217139 [DOI] [PubMed] [Google Scholar]
- Melzer S, Gil M, Koser DE, Michael M, Huang KW, Monyer H (2017) Distinct corticostriatal GABAergic neurons modulate striatal output neurons and motor activity. Cell Rep 19:1045–1055. 10.1016/j.celrep.2017.04.024 [DOI] [PMC free article] [PubMed] [Google Scholar]
- Miserendino MJ, Sananes CB, Melia KR, Davis M (1990) Blocking of acquisition but not expression of conditioned fear-potentiated startle by NMDA antagonists in the amygdala. Nature 345:716–718. 10.1038/345716a0 [DOI] [PubMed] [Google Scholar]
- Nabavi S, Fox R, Proulx CD, Lin JY, Tsien RY, Malinow R (2014) Engineering a memory with LTD and LTP. Nature 511:348–352. 10.1038/nature13294 [DOI] [PMC free article] [PubMed] [Google Scholar]
- Namburi P, Beyeler A, Yorozu S, Calhoon GG, Halbert SA, Wichmann R, Holden SS, Mertens KL, Anahtar M, Felix-Ortiz AC, Wickersham IR, Gray JM, Tye KM (2015) A circuit mechanism for differentiating positive and negative associations. Nature 520:675–678. 10.1038/nature14366 [DOI] [PMC free article] [PubMed] [Google Scholar]
- Oh SW, Harris JA, Ng L, Winslow B, Cain N, Mihalas S, Wang Q, Lau C, Kuan L, Henry AM, Mortrud MT, Ouellette B, Nguyen TN, Sorensen SA, Slaughterbeck CR, Wakeman W, Li Y, Feng D, Ho A, Nicholas E, et al. (2014) A mesoscale connectome of the mouse brain. Nature 508:207–214. 10.1038/nature13186 [DOI] [PMC free article] [PubMed] [Google Scholar]
- Petreanu L, Huber D, Sobczyk A, Svoboda K (2007) Channelrhodopsin-2-assisted circuit mapping of long-range callosal projections. Nat Neurosci 10:663–668. 10.1038/nn1891 [DOI] [PubMed] [Google Scholar]
- Pfeffer CK, Xue M, He M, Huang ZJ, Scanziani M (2013) Inhibition of inhibition in visual cortex: the logic of connections between molecularly distinct interneurons. Nat Neurosci 16:1068–1076. 10.1038/nn.3446 [DOI] [PMC free article] [PubMed] [Google Scholar]
- Pouille F, Scanziani M (2004) Routing of spike series by dynamic circuits in the hippocampus. Nature 429:717–723. 10.1038/nature02615 [DOI] [PubMed] [Google Scholar]
- Pouille F, Marin-Burgin A, Adesnik H, Atallah BV, Scanziani M (2009) Input normalization by global feedforward inhibition expands cortical dynamic range. Nat Neurosci 12:1577–1585. 10.1038/nn.2441 [DOI] [PubMed] [Google Scholar]
- Pouille F, Watkinson O, Scanziani M, Trevelyan AJ (2013) The contribution of synaptic location to inhibitory gain control in pyramidal cells. Physiol Rep 1:e00067. 10.1002/phy2.67 [DOI] [PMC free article] [PubMed] [Google Scholar]
- Quirk GJ, Repa C, LeDoux JE (1995) Fear conditioning enhances short-latency auditory responses of lateral amygdala neurons: parallel recordings in the freely behaving rat. Neuron 15:1029–1039. 10.1016/0896-6273(95)90092-6 [DOI] [PubMed] [Google Scholar]
- Ribak CE, Seress L, Peterson GM, Seroogy KB, Fallon JH, Schmued LC (1986) A GABAergic inhibitory component within the hippocampal commissural pathway. J Neurosci 6:3492–3498. 10.1523/JNEUROSCI.06-12-03492.1986 [DOI] [PMC free article] [PubMed] [Google Scholar]
- Rock C, Apicella AJ (2015) Callosal projections drive neuronal-specific responses in the mouse auditory cortex. J Neurosci 35:6703–6713. 10.1523/JNEUROSCI.5049-14.2015 [DOI] [PMC free article] [PubMed] [Google Scholar]
- Rock C, Zurita H, Wilson C, Apicella AJ (2016) An inhibitory corticostriatal pathway. eLife 5:e15890. 10.7554/eLife.15890 [DOI] [PMC free article] [PubMed] [Google Scholar]
- Rock C, Zurita H, Lebby S, Wilson CJ, Apicella AJ (2018) Cortical circuits of callosal GABAergic neurons. Cereb Cortex 28:1154–1167. 10.1093/cercor/bhx025 [DOI] [PubMed] [Google Scholar]
- Rogan MT, LeDoux JE (1995) LTP is accompanied by commensurate enhancement of auditory evoked responses in a fear conditioning circuit. Neuron 15:127–136. 10.1016/0896-6273(95)90070-5 [DOI] [PubMed] [Google Scholar]
- Rothermel M, Brunert D, Zabawa C, Díaz-Quesada M, Wachowiak M (2013) Transgene expression in target-defined neuron populations mediated by retrograde infection with adeno-associated viral vectors. J Neurosci 33:15195–15206. 10.1523/JNEUROSCI.1618-13.2013 [DOI] [PMC free article] [PubMed] [Google Scholar]
- Rumpel S, LeDoux J, Zador A, Malinow R (2005) Postsynaptic receptor trafficking underlying a form of associative learning. Science 308:83–88. 10.1126/science.1103944 [DOI] [PubMed] [Google Scholar]
- Schindelin J, Arganda-Carreras I, Frise E, Kaynig V, Longair M, Pietzsch T, Preibisch S, Rueden C, Saalfeld S, Schmid B, Tinevez JY, White DJ, Hartenstein V, Eliceiri K, Tomancak P, Cardona A (2012) Fiji: an open-source platform for biological-image analysis. Nat Methods 9:676–682. 10.1038/nmeth.2019 [DOI] [PMC free article] [PubMed] [Google Scholar]
- Seress L, Ribak CE (1983) GABAergic cells in the dentate gyrus appear to be local circuit and projection neurons. Exp Brain Res 50:173–182. 10.1007/bf00239181 [DOI] [PubMed] [Google Scholar]
- Silberberg G, Markram H (2007) Disynaptic inhibition between neocortical pyramidal cells mediated by Martinotti cells. Neuron 53:735–746. 10.1016/j.neuron.2007.02.012 [DOI] [PubMed] [Google Scholar]
- Stokes CC, Isaacson JS (2010) From dendrite to soma: dynamic routing of inhibition by complementary interneuron microcircuits in olfactory cortex. Neuron 67:452–465. 10.1016/j.neuron.2010.06.029 [DOI] [PMC free article] [PubMed] [Google Scholar]
- Suter BA, O'Connor T, Iyer V, Petreanu LT, Hooks BM, Kiritani T, Svoboda K, Shepherd GM (2010) Ephus: multipurpose data acquisition software for neuroscience experiments. Front Neural Circuits 4:100. 10.3389/fncir.2010.00100 [DOI] [PMC free article] [PubMed] [Google Scholar]
- Taniguchi H, He M, Wu P, Kim S, Paik R, Sugino K, Kvitsani D, Fu Y, Lu J, Lin Y, Miyoshi G, Shima Y, Fishell G, Nelson SB, Huang ZJ (2011) A resource of cre driver lines for genetic targeting of GABAergic neurons in cerebral cortex. Neuron 71:995–1013. 10.1016/j.neuron.2011.07.026 [DOI] [PMC free article] [PubMed] [Google Scholar]
- Tomioka R, Rockland KS (2007) Long-distance corticocortical GABAergic neurons in the adult monkey white and gray matter. J Comp Neurol 505:526–538. 10.1002/cne.21504 [DOI] [PubMed] [Google Scholar]
- Tomioka R, Okamoto K, Furuta T, Fujiyama F, Iwasato T, Yanagawa Y, Obata K, Kaneko T, Tamamaki N (2005) Demonstration of long-range GABAergic connections distributed throughout the mouse neocortex. Eur J Neurosci 21:1587–1600. 10.1111/j.1460-9568.2005.03989.x [DOI] [PubMed] [Google Scholar]
- Tóth K, Freund TF (1992) Calbindin D28k-containing nonpyramidal cells in the rat hippocampus: their immunoreactivity for GABA and projection to the medial septum. Neuroscience 49:793–805. 10.1016/0306-4522(92)90357-8 [DOI] [PubMed] [Google Scholar]
- Tóth K, Borhegyi Z, Freund TF (1993) Postsynaptic targets of GABAergic hippocampal neurons in the medial septum-diagonal band of Broca complex. J Neurosci 13:3712–3724. 10.1523/JNEUROSCI.13-09-03712.1993 [DOI] [PMC free article] [PubMed] [Google Scholar]
- Tremblay R, Lee S, Rudy B (2016) GABAergic interneurons in the neocortex: from cellular properties to circuits. Neuron 91:260–292. 10.1016/j.neuron.2016.06.033 [DOI] [PMC free article] [PubMed] [Google Scholar]
- Williamson RS, Polley DB (2019) Parallel pathways for sound processing and functional connectivity among layer 5 and 6 auditory corticofugal neurons. eLife 8:e42974. 10.7554/eLife.42974 [DOI] [PMC free article] [PubMed] [Google Scholar]
- Winer JA. (2006) Decoding the auditory corticofugal systems. Hear Res 212:1–8. 10.1016/j.heares.2005.06.014 [DOI] [PubMed] [Google Scholar]
- Xiong XR, Liang F, Zingg B, Ji XY, Ibrahim LA, Tao HW, Zhang LI (2015) Auditory cortex controls sound-driven innate defense behaviour through corticofugal projections to inferior colliculus. Nat Commun 6:7224. 10.1038/ncomms8224 [DOI] [PMC free article] [PubMed] [Google Scholar]
- Yang Y, Liu DQ, Huang W, Deng J, Sun Y, Zuo Y, Poo MM (2016) Selective synaptic remodeling of amygdalocortical connections associated with fear memory. Nat Neurosci 19:1348–1355. 10.1038/nn.4370 [DOI] [PubMed] [Google Scholar]
- Zurita H, Feyen PLC, Apicella AJ (2018) Layer 5 callosal parvalbumin-expressing neurons: a distinct functional group of GABAergic neurons. Front Cell Neurosci 12:53. 10.3389/fncel.2018.00053 [DOI] [PMC free article] [PubMed] [Google Scholar]