

Abstract
Accumulating studies have implicated the role of long non-coding RNAs (lncRNAs) in the pathogenesis of hepatocellular carcinoma (HCC) through the regulating transcription and mRNA stability. A recent report has linked Rac GTPase-activating protein 1 (RACGAP1) to the early recurrence of HCC. The current study aimed to ascertain whether MAGI2 antisense RNA 3 (MAGI2-AS3) influences the development of HCC by regulating RACGAP1. MAGI2-AS3 expression was initially quantified in both the HCC tissues and cell lines. In order to elucidate the role of MAGI2-AS3 in the development of HCC, MAGI2-AS3 was overexpressed or silenced in HCC cells after which cell proliferation, apoptosis, invasion, and migration were evaluated. Chromatin immunoprecipitation (ChIP), RNA immunoprecipitation (RIP), and biotin-labeled RNA pull-down assays were conducted to determine the interactions among MAGI2-AS3, KDM1A, and RACGAP1. Finally, the effects of MAGI2-AS3 and RACGAP1 on the tumorigenesis of transplanted HCC cells in nude mice were evaluated. MAGI2-AS3 was found to be under-expressed in HCC tissues and cell lines. The restoration of MAGI2-AS3 was identified to markedly inhibit HCC cell growth, migrating ability, and invasiveness, and promote cell apoptosis. Interaction between MAGI2-AS3 and KDM1A was identified. KDM1A recruited by MAGI2-AS3 was found to promote H3K4me2 demethylation at the RACGAP1 promoter, which ultimately decreased the expression of RACGAP1. We also identified that RACGAP1 knockdown eliminated the stimulatory effects of MAGI2-AS3 silencing on the malignant phenotypes of HCC cells. Additionally, the expression of MAGI2-AS3 reduced tumor weight and size in HCC transplanted nude mice. Taken together, the key observations of the current study demonstrate the potential of MAGI2-AS3 as a tumor suppressor and a promising target for HCC treatment.
Keywords: hepatocellular carcinoma, MAGI2-AS3, KDM1A, RACGAP1, demethylation, H3K4me2
Introduction
Hepatocellular carcinoma (HCC) is widely recognized as a notable contributor to the significant morbidity and mortality rates of patients diagnosed with cirrhosis. Studies have suggested that HCC accounts for approximately 75%–85% of all primary liver cancers.1, 2 The risk factors associated with HCC include excessive alcohol consumption, infection with hepatitis viruses, as well as various rare genetic diseases and metabolic syndromes.3 At present, there are numerous therapeutic approaches for patients with HCC, including medical and surgical therapies; however, the prognosis for patients with advanced stage HCC is often poor largely because of the aggressive malignant nature of the disease.4, 5 Therefore, further investigation is required in order to enhance our understanding of the genetic factors associated with the progression of HCC.
Long non-coding RNAs (lncRNAs) represent non-protein-coding transcripts with length greater than 200 nt, with studies reporting them to be heterogeneous, as well as indicating their divergent functions.6, 7 More recently, lncRNAs have also been identified to be crucial factors in tumorigenesis and cancer progression.8, 9 Various studies continue to investigate the molecular functions and pathological implications of lncRNAs in HCC.10, 11 MAGI2 antisense RNA 3 (MAGI2-AS3), a novel lncRNA, has been recently reported to serve as a tumor suppressor for bladder cancer and breast cancer.12, 13 However, the role of MAGI2-AS3 in the development of HCC remains unknown.
Rac GTPase-activating protein 1 (RACGAP1) has been suggested to exert its functions in a variety of tumors, which is exemplified by the elevated expression of RACGAP1, which accelerates the progression of human meningiomas.14 RACGAP1 has the potential to induce tumor malignancy and acts as an indicator for lymph node metastasis and a prognostic factor in colorectal cancer.15 A close correlation has been identified between the elevated expression of RACGAP1 and the early recurrence of human HCC.16 However, the mechanism by which RACGAP1 is regulated in the progression of HCC has yet to be adequately investigated. Histone modification has been considered to be an important method by which the structure of chromatin and gene transcription are regulated, with studies highlighting its dysregulation in the development of cancer.17 Besides, histone methylation is recognized to be reversible owing to the identification of histone demethylases.18 Nevertheless, whether histone modifications happen in the RACGAP1 gene locus has yet to be fully elucidated. Lysine-specific demethylase 1A (KDM1A), also named LSD1, represents the first discovered histone-specific demethylase and has been reported to be able to demethylase H3K4me1/2 and H3K9me1/2.19 In the present study, we aimed to ascertain whether lncRNA MAGI2-AS3 regulates the expression of HCC-related genes, such as RACGAP1, and to determine whether histone methylation and demethylase, such as KDM1A, are involved in the regulation of RACGAP1 expression. We subsequently set out to identify the effects of MAGI2-AS3 and RACGAP1 on HCC development in HCC cells and a mouse model, in order to determine the potential of MAGI2-AS3 as an antitumor target.
Results
MAGI2-AS3 Is Expressed at a Low Level in HCC
In order to evaluate the differentially expressed lncRNAs associated with HCC, we analyzed the expression profiles from the GEO database and found that the expression of MAGI2-AS3 was decreased in HCC, which was evidenced by the datasets GEO: GSE45267 and GSE62232 (Figures 1A and 1B). Furthermore, the data from the Gene Expression Profiling Interactive Analysis (GEPIA) database (http://gepia.cancer-pku.cn/index.html) additionally revealed that MAGI2-AS3 was markedly downregulated in HCC (Figure 1C). Further analysis of the expression of MAGI2-AS3 using qRT-PCR revealed that the expression of MAGI2-AS3 in the HCC tissues was drastically lower than that of their normal counterparts (p < 0.05; Figure 1D). The Kaplan-Meier method was used to analyze the correlation between MAGI2-AS3 expression and overall survival (OS) of patients. The results showed that patients with high MAGI2-AS3 expression showed longer OS than those with low MAGI2-AS3 expression, highlighting a relationship between low expression of MAGI2-AS3 and poor prognoses (p < 0.05; Figure 1D). We also analyzed the correlations between MAGI2-AS3 expression and clinicopathological characteristics, which revealed correlations of the expression of MAGI2-AS3 with tumor size, clinical stage, and lymph node metastasis, but not with age, gender, and hepatitis (Table S1). Besides, the expression of MAGI2-AS3 in the HCC cells (HuH-7, HCCLM3, HepG2, BEL-7402, SK-HEP-1, and SMMCC-7721 cells) was significantly lower than that in QSG-7701 normal liver cells, particularly in the HepG2 cells (p < 0.05; Figure 1E). Hence, we concluded that the expression of MAGI2-AS3 was downregulated in HCC, and HepG2 cells were used for further MAGI2-AS3 overexpression experiments. The HCCLM3 cell line had the highest expression of MAGI2-AS3 among the six HCC cell lines, and the HCCLM3 cell line was selected for MAGI2-AS3 knockdown experiments (Supplemental Information).
Figure 1.

The Expression of MAGI2-AS3 Is Reduced in HCC Tissues and Cell Lines
(A and B) The datasets GEO: GSE45267 (A) and GSE62232 (B) illustrate the differentially expressed genes in HCC and MAGI2-AS3. The horizontal axis shows the sample number, and the right ordinate displays the names of differentially expressed genes. The strips above show the sample types; blue represents normal tissue, whereas pink represents tumor tissue. The color bar in the right refers to the level of gene expression; red indicates high expression, and gray indicates low expression. (C) The expression level of MAGI2-AS3 from the GEPIA database; pink indicates tumor tissue, whereas gray indicates normal tissue. *p < 0.05. (D) The relative expression of MAGI2-AS3 in HCC tissues (n = 58) and normal liver tissues (n = 20) determined by qRT-PCR and the correlation between MAGI2-AS3 expression and patients’ overall survival analyzed by the Kaplan-Meier method. (E) The expression of MAGI2-AS3 in HCC cell lines and normal cell line as determined by qRT-PCR. *p < 0.05 versus normal liver tissues; #p < 0.05 versus the QSG-7701 cell line. (F) Localization of MAGI2-AS3 in HCC cells analyzed in the lncATLAS website. (G) FISH staining shows the subcellular localization of MAGI2-AS3 in HepG2 cells (original magnification ×200). (H) Nuclear and cytoplasmic fractionation followed by qPCR reveals the localization of MAGI2-AS3 in HepG2 cells. The experiments except for (D) were repeated three times independently. *p < 0.05 versus the normal liver tissues; #p < 0.05 versus the QSG-7701 cells. Data between two groups were analyzed using an unpaired t test, and data among multiple groups were analyzed using one-way ANOVA.
The analysis of the lncATLAS website (http://lncatlas.crg.eu/) indicated that MAGI2-AS3 was mainly located in the nucleus of HepG2 cells (Figure 1F). We then confirmed the localization of MAGI2-AS3 in HepG2 cells by fluorescence in situ hybridization (FISH) with the expression of MAGI2-AS3 found to be predominantly localized in the nucleus of HepG2 cells (Figure 1G). In accordance with this, the majority of MAGI2-AS3 was detected in the nuclear fractions, with little in the cytoplasmic fractions, which is similar to the nucleus-resident 45S rRNA (Figure 1H).
MAGI2-AS3 Suppresses the Malignant Phenotypes of HCC Cells
Next, we set out to determine whether MAGI2-AS3 influences the proliferation and apoptosis of HepG2 cells. HepG2 cells were infected with a lentivirus harboring MAGI2-AS3 sequence. As quantified by qRT-PCR, the oe-MAGI2-AS3 group displayed higher expression of MAGI2-AS3 when compared with the oe-NC group (p < 0.05; Figure 2A). The results of the 5-ethynyl-2′-deoxyuridine (EdU) experiment revealed that the number of EdU-positive cells decreased remarkably after overexpression of MAGI2-AS3 (p < 0.05; Figure 2B). Terminal deoxyribonucleotidyl transferase (TDT)-mediated dUTP-digoxigenin nick end labeling (TUNEL) staining results displayed that the number of apoptotic cells increased prominently by overexpressing MAGI2-AS3 (p < 0.05; Figure 2C).
Figure 2.

MAGI2-AS3 Exhibits Suppressive Effects on the Malignant Phenotypes of HCC Cells
(A) HepG2 cells were infected with lentivirus harboring MAGI2-AS3 sequence (oe-MAGI2-AS3) or negative control sequence (oe-NC), and the expression of MAGI2-AS3 was determined by qRT-PCR. (B) The proliferation of HepG2 cells was detected by EdU staining after infection (original magnification ×200). (C) TUNEL staining assessed the apoptosis of HepG2 cells after infection (original magnification ×200). (D and E) Cell migration (D) and invasion (E) measured by Transwell assay (original magnification ×200). The experiments were repeated three times independently. *p < 0.05 versus the oe-NC group. Data were analyzed using an unpaired t test.
Next, as depicted by the Transwell assay data in Figures 2D and 2E, the numbers of migrating and invasive cells were both significantly decreased following infection with lentivirus harboring MAGI2-AS3 (p < 0.05). These results suggest that MAGI2-AS3 may play an inhibitory role in malignant phenotypes of HCC cells.
MAGI2-AS3 Regulates RACGAP1 Expression and Interacts with Demethylase KDM1A
As illustrated in Figure 3A, three intersected genes, Lcn2, PDZK1IP1, and RACGAP1, were found to be highly expressed in HCC and subsequently screened from the gene expression profiles GEO: GSE45267, GSE49515, and GSE62232. A negative correlation was detected between MAGI2-AS3 and RACGAP1 expression (Figure 3B). RACGAP1 is a cytokinesis-regulatory protein that is highly expressed in a wide range of tumors, with studies indicating its stimulatory role from a HCC cellular proliferation perspective.20 In the following experiment, in order to elucidate the interaction between MAGI2-AS3 with RACGAP1 in HCC cells, bioinformatics prediction, immunohistochemistry, qRT-PCR, western blot analysis, chromatin immunoprecipitation (ChIP), RNA immunoprecipitation (RIP) assay, and biotin-labeled RNA pull-down assay were performed. The BLAST alignment results demonstrated that MAGI2-AS3 may bind to the sequence of RACGAP1 promoter in a RNA-DNA manner (Figure 3D). The immunohistochemistry results revealed that RACGAP1 was highly expressed in HCC tissues when compared with that of the normal liver tissues (p < 0.05; Figure 3C). As illustrated by qRT-PCR and western blot analysis, the expression of RACGAP1 in HepG2 cells was markedly higher than that in QSG-7701 cells (p < 0.05; Figure 3E). In HepG2 cells, overexpression of MAGI2-AS3 prominently decreased the expression of RACGAP1 (p < 0.05; Figures 3F and 3G). Based on the aforementioned data, we asserted that MAGI2-AS3 might regulate RACGAP1 expression by binding to the promoter of RACGAP1.
Figure 3.

MAGI2-AS3 Regulates RACGAP1 Expression and Interacts with KDM1A
(A) Venn analysis of highly expressed genes in HCC gene expression profiles GEO: GSE45267, GSE49515, and GSE62232. (B) Correlation analysis between MAGI2-AS3 and RACGAP1 expression revealed from the GEO: GSE62232 dataset. (C) The expression of RACGAP1 in normal liver tissues (n = 20) and HCC tissues (n = 58) examined by immunohistochemistry staining (original magnification ×200). (D) The sequence analysis between MAGI2-AS3 and RACGAP1 promoter region by BLAST alignment. (E) The expression of RACGAP1 in QSG-7701 and HepG2 cells as determined by qRT-PCR. (F) The effect of MAGI2-AS3 overexpression on RACGAP1 expression as detected by qRT-PCR. (G) The effect of MAGI2-AS3 overexpression on RACGAP1 expression as detected by western blot analysis. (H) The evaluation of H3K4me2 enrichment in the RACGAP1 promoter region by the WashU Epigenome Browser. (I) Enrichment of H3K4me2 in the RACGAP1 promoter region identified by ChIP. (J) The KDM1A protein expression measured by western blot assay after RIP using an antibody to KDM1A. (K) MAGI2-AS3 expression in the co-immunoprecipitated RNA-protein complex determined by qRT-PCR. (L) RNA pull-down assay revealed the binding of KDM1A to MAGI2-AS3. (M) Prediction of RNA-binding residues (RBRs) in KDM1A by RBRDetector. The 3D structure was visualized by Jmol (http://jmol.sourceforge.net/). The experiments except for (B) and (C) were repeated three times independently. *p < 0.05 versus the normal liver tissues or QSG-7701 cells; &p < 0.05 versus the oe-NC group; #p < 0.05 versus the IgG group. Data between two groups were analyzed using an unpaired t test.
Further, we sought to elucidate the mechanism by which MAGI2-AS3 potentially regulates the expression of RACGAP1 in detail. The evaluation of histone-modified orbits by the WashU Epigenome Browser was performed, and the results displayed that extensive H3K4me2 enrichment peaks were found in the RACGAP1 promoter region (Figure 3H). ChIP also revealed the enrichment of H3K4me2 in the RACGAP1 promoter region (p < 0.05; Figure 3I). KDM1A was first discovered to specifically demethylase lysine 4 and lysine 9 of histone H3.21 The RNA-Protein Interaction Prediction (RPIseq) database (http://pridb.gdcb.iastate.edu/RPISeq/) analysis revealed that MAGI2-AS3 could bind to KDM1A. In accordance with the results of the RIP test, data were obtained indicating that the specific antibody to KDM1A can efficiently capture KDMA1 protein (Figure 3J). After extracting RNA from the RNA-protein complex, the qRT-PCR results demonstrated that the enrichment level of MAGI2-AS3 in the KDM1A antibody experimental group was significantly higher than that in the immunoglobulin G (IgG) control group (Figure 3K). Reversely, biotin-labeled RNA pull-down was performed and KDM1A was pulled down by MAGI2-AS3 (Figure 3L). MAGI2-AS3 nucleic acid sequence was downloaded from NCBI, and the 3D structure model was established using homology modeling programs, which displayed the interaction between MAGI2-AS3 and RACGAP1 (Figure 3M). The data obtained demonstrated that KDM1A could bind to MAGI2-AS3.
Taken together, our results suggested that MAGI2-AS3 could regulate RACGAP1 expression, which may potentially be achieved through recruiting KDM1A, influencing the histone methylation of the RACGAP1 promoter region.
MAGI2-AS3 Modulates H3K4me2 Demethylation of RACGAP1 via Recruiting KDM1A
Our data revealed that MAGI2-AS3 could interact with KDM1A, and the enrichment of H3K4me2 was identified in the RACGAP1 promoter region. We subsequently set out to ascertain whether MAGI2-AS3 interacts with KDM1A to promote histone demethylation in the RACGAP1 promoter region.
The overexpression of KDM1A and silencing of MAGI2-AS3 in HepG2 cells were conducted via lentivirus infection, with the expression levels determined by qRT-PCR (Figures 4A and 4B). ChIP detection then revealed that knockdown of MAGI2-AS3 could promote the enrichment of H3K4me2 in the RACGAP1 promoter region, whereas overexpression of MAGI2-AS3 inhibited the enrichment of H3K4me2, which indicated the demethylation of the RACGAP1 promoter region (p < 0.05; Figure 4C). In addition, ChIP data showed that KDM1A could be detected in the RACGAP1 promoter region (p < 0.05; Figure 4D). Taken together, based on the aforementioned results, we concluded that MAGI2-AS3 could recruit KDM1A to the RACGAP1 promoter to promote the demethylation of H3K4me2 in this region, thus inhibiting the transcription of RACGAP1.
Figure 4.

MAGI2-AS3 Reduces H3K4me2 Methylation of the RACGAP1 Promoter via Recruiting KDM1A
(A) The expression of KDM1A in HCCLM3 cells infected with lentivirus harboring KDM1A sequence as detected by qRT-PCR. (B) MAGI2-AS3 expression in HCCLM3 cells infected with sh-MAGI2-AS3 as detected by qRT-PCR. (C) The enrichment of H3K4me2 in the RACGAP1 promoter region of HepG2 cells after MAGI2-AS3 overexpression or knockdown as detected by ChIP. (D) The enrichment of H3K4me2 in the RACGAP1 promoter region after KDM1A overexpression or knockdown as detected by ChIP. *p < 0.05 versus oe-NC group; #p < 0.05 versus sh-NC group; p < 0.05 versus IgG group. The experiments were repeated three times independently, and the data were analyzed using unpaired t test or one-way ANOVA.
MAGI2-AS3 Modulates HCC Cell Phenotypes Dependent on RACGAP1 Expression and Also Mediates KDM1A Function
In order to enhance our understanding regarding the mechanism by which RACGAP1 expression regulates MAGI2-AS3 and KDM1A influences HCC development, we analyzed the effects of MAGI2-AS3 and KDM1A on RACGAP1 expression to determine how they modulate the malignant phenotypes of HepG2 cells.
The RACGAP1 mRNA expression was successfully inhibited by infection with lentivirus expressing sh-RACGAP1 (Figure 5A). Upon MAG12-AS3 knockdown, RACGAP1 protein expression was increased (p < 0.05), but overexpression of KDM1A showed no effect on RACGAP1 expression in the presence of sh-MAG12-AS3 (p > 0.05) (Figure 5B). The effects of KDM1A and MAGI2-AS3 on RACGAP1 expression were then examined. The HepG2 cells were treated with tranylcypromine (TCP), a classic KDM1A inhibitor, and we observed that the inhibition of KDM1A led to a marked upregulation of the expression of the RACGAP1 protein (p < 0.05; Figure 5C).
Figure 5.

MAGI2-AS3 Exerts Effects on HCC Cells Dependent on RACGAP1 Expression and Mediates the Function of KDM1A
(A) HepG2 cells were infected with lentivirus harboring sh-RACGAP1, and the expression of RACGAP1 was detected by qRT-PCR. (B) HepG2 cells were infected with lentivirus harboring sh-MAGI2-AS3 or KDM1A sequence, and the expression of RACGAP1 was analyzed by western blots (left) and followed by quantification (right). (C) HepG2 cells were treated with DMSO or KDM1A inhibitor TCP, and the expression of RACGAP1 was analyzed by western blots (left), followed by quantification (right). (D–G) HepG2 cells were infected with lentivirus harboring sh-NC, MAGI2-AS3 sequence, sh-RACGAP1, or KDM1A sequence, and cell proliferation (D), apoptosis (E), migration (F), and invasion (G) were evaluated (original magnification ×200). *p < 0.05 versus sh-NC group; #p < 0.05 versus sh-MAGI2-AS3 group. The experiments were repeated three times independently. Data between two groups were analyzed using an unpaired t test, and data among multiple groups were analyzed using one-way ANOVA.
Next, we aimed to determine whether the regulation of MAGI2-AS3 and KDM1A on RACGAP1 expression could influence the malignant phenotypes of HepG2 cells. The application of an EdU assay demonstrated that the number of EdU-positive cells was significantly elevated following the knockdown of MAGI2-AS3 (p < 0.05). Knockdown of RACGAP1 was found to dramatically inhibit the stimulatory effect of MAGI2-AS3 silencing on the proliferation of HepG2 cells (p < 0.05), whereas the overexpression of KDM1A exhibited no effects on the proliferation of HepG2 cells in the presence of sh-MAGI2-AS3 (p > 0.05; Figure 5D). TUNEL results demonstrated that the number of apoptotic cells was dramatically decreased following the knockdown of MAGI2-AS3 (p < 0.05). Knockdown of RACGAP1 was identified to considerably inhibit the anti-apoptotic effects associated with MAGI2-AS3 silencing on HepG2 cells (p < 0.05), whereas overexpression of KDM1A displayed no significant effects on the inhibition of HepG2 cell apoptosis after silencing of MAGI2-AS3 (p > 0.05; Figure 5E). Transwell assay results in Figures 5F and 5G revealed that the numbers of invasive and migrating cells were elevated prominently after knockdown of MAGI2-AS3 (p < 0.05). Knockdown of RACGAP1 was identified to markedly inhibit the aforementioned elevations of HepG2 cell invasion and migration induced by MAGI2-AS3 silencing (p < 0.05), whereas the upregulation of KDM1A had no effect on the induction of cell invasion and migration after silencing of MAGI2-AS3 (p > 0.05).
Altogether, our results demonstrated that MAGI2-AS3 influenced cellular functions by regulating RACGAP1 expression, and additionally suggested that KDM1A could also take part in this processing via interacting with MAGI2-AS3.
MAGI2-AS3 Overexpression or RACGAP1 Silencing Inhibits Tumor Growth In Vivo
In order to further explore whether MAGI2-AS3 or RACGAP1 participates in the development of HCC in vivo, we studied the effect of MAGI2-AS3 overexpression or RACGAP1 knockdown on tumor formation. HepG2 cells infected with lentivirus harboring the MAGI2-AS3 sequence or sh-RACGAP1 were injected into nude mice. As depicted in Figures 6A and 6B, the volume and weight of tumors were dramatically reduced by MAGI2-AS3 overexpression or RACGAP1 silencing (p < 0.05), highlighting that the overexpression of MAGI2-AS3 or RACGAP1 silencing could inhibit HCC cell tumorigenesis in vivo.
Figure 6.

MAGI2-AS3 Overexpression or RACGAP1 Silencing Inhibits HCC Development in Nude Mice
HepG2 cells infected with lentivirus harboring MAGI2-AS3 sequence or shRACGAP1 were injected into nude mice. (A) The growth curve shows a volume of transplanted tumors in nude mice after MAGI2-AS3 overexpression or RACGAP1 silencing. (B) The representative images show the size of tumors at day 35 and the weight of tumors at day 35 after overexpression of MAGI2-AS3 or silencing of RACGAP1. *p < 0.05 versus the oe-NC group; #p < 0.05 versus the sh-NC group. n = 12 for each group. Data obtained at different time points were analyzed using repeated-measures ANOVA, and data at a unique time point were analyzed using one-way ANOVA.
Discussion
At present, the treatment approaches available to early-stage HCC patients are capable of extending life expectancy due to their curative ability. However, this is not an option available to patients diagnosed with intermediate or advanced stage disease; thus, the majority of the patients will die within 3–6 months after diagnosis.22, 23 Increasing evidence has suggested the essential roles of lncRNAs in cancer development, making lncRNAs the potential biomarkers and therapeutic targets for HCC treatment.24 The current study placed a particular emphasis on elucidating the mechanism by which MAGI2-AS3 could potentially influence the malignancy of HCC in HCC cells and a mouse model, with our results highlighting the role of MAGI2-AS3 as a potential anti-tumor regulator in HCC. MAGI2-AS3 may recruit demethylase KDM1A and subsequently promote demethylation of H3K4me2 at the RACGAP1 promoter, which ultimately suppresses the expression of RACGAP1 and inhibits tumorigenesis (Figure 7).
Figure 7.
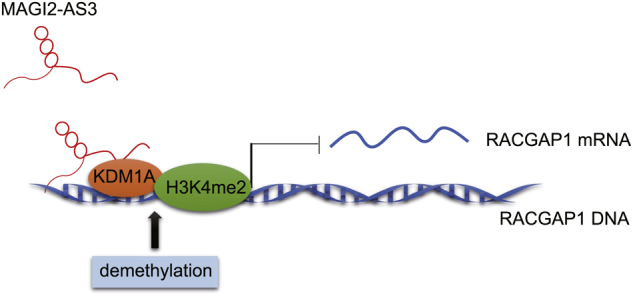
A Schematic Map Showing the Role and Mechanism MAGI2-AS3 Enacts to Prevent the Progression of HCC
MAGI2-AS3 recruits demethylase KDM1A and subsequently promotes demethylation of H3K4me2 at the RACGAP1 promoter, thus inhibiting tumorigenesis.
Based on our observations, MAGI2-AS3 exhibited poor expression in HCC, which was consistent with the findings of a previous study that concluded that MAGI2-AS3 is downregulated in certain cancers, such as non-small-cell lung cancer and breast cancer.13, 25 An integrated analysis highlighted the crucial role potentially played by MAGI2-AS3 in the disease progression of bladder cancer.26 In this regard, we subsequently set out to investigate if MAGI2-AS3 influences the malignant phenotype of HCC cells. The data obtained suggested that MAGI2-AS3 was capable of impeding cell proliferation, invasiveness, and migrating potential, and enhancing cell apoptosis, further supporting the notion of the inhibitory role played by MAGI2-AS3 in HCC. In addition, MAGI2-AS3 remarkably restrained tumorigenesis in the HCC mouse model, indicative of an anti-tumor ability, which is consistent with the capacity of suppressing bladder cancer growth in vivo.12
A key finding of the present study revealed that RACGAP1 was markedly upregulated in HCC, which was consistent with the findings of a previous study that asserted that the upregulation of RACGAP1 is strongly correlated with the early recurrence of human HCC.16 RACGAP1 is highly expressed in various types of cancers, including uterine carcino-sarcoma, gastric cancer, and bladder cancer, with studies highlighting its oncogenic function.27, 28, 29 The current study demonstrated that RACGAP1 silencing could inhibit the tumorigenesis of HepG2 cells in vivo. Silencing of RACGAP1 in HCC cells is capable of triggering cell apoptosis and is responsible for inhibited levels of proliferation.20 Reduced RACGAP1 expression achieved by small interfering RNA (siRNA) in colorectal cancer cells exhibits markedly decreased cellular proliferative and invasive abilities.15 Importantly, a negative correlation between RACGAP1 and MAGI2-AS3 was revealed in our present study. Furthermore, MAGI2-AS3 was identified as an upstream regulator of RACGAP1, evidenced by our data, which indicated that MAGI2-AS3 inhibited the expression of RACGAP1 and that silencing of RACGAP1 could eliminate the stimulatory effects associated with MAGI2-AS3 knockdown on the malignant phenotypes of HCC cells.
Importantly, our results elucidated the mechanism by which MAGI2-AS3 influences RACGAP1 expression. The functions of the great majority of lncRNAs remain generally ambiguous and have been identified to function in a diverse range of mechanisms. As previously reported, lincRNAs were reported to act as scaffolds, decoys, or sponges of miRNAs, or even through antisense interference.30 We subsequently performed a BLAST alignment and discovered that MAGI2-AS3 could potentially bind to the promoter of RACGAP1, with the interaction between MAGI2-AS3 and KDM1A confirmed by immunoprecipitation and RNA pull-down assay. Our findings indicate that MAGI2-AS3 might serve as a scaffold protein to recruit KDM1A to the promoter of RACGAP1. Epigenetic alteration is a conspicuous feature of cancers that often leads to dysregulated gene expression. Dynamic histone H3K4 methylation is of crucial importance in regulating transcription. For example, human LSD2/KDM1b/AOF1, a human homolog of KDM1A, represents a H3K4me1/2 demethylase that specifically regulates histone H3K4 methylation.31 During our study, we identified that H3K4me2 was enriched in the promoter of RACGAP1, and that the overexpression of KDM1A could act to diminish H3K4me2 at the promoter of RACGAP1. KDM1A has been previously reported to demethylase the promotor of TIMP3 and promote non-small-cell lung cancer metastasis.32 KDM1A has been speculated to play a role in the progression of different cancers by regulating the epigenetic modification of tumor-associated genes.33 Thus, MAGI2-AS3 inhibited the transcription of RACGAP1 by recruiting KDM1A to mediate the development of HCC.
To conclude, the key findings of our study suggest that MAGI2-AS3 could facilitate histone demethylation of the RACGAP1 promoter through recruiting demethylase KDM1A and diminishing the expression of RACGAP1 in HCC, whereby MAGI2-AS3 inhibits the development of HCC, highlighting its potential as a therapeutic target for future HCC treatment. Research on the other histone methylation marks, for example, H3K4me1 and H3K4me3, or other histone demethylases, such as LSD2, might be attractive. Meanwhile, we would like to test our findings by performing experiments in an enlarged clinical sample size.
Materials and Methods
Ethics Statement
Written informed consents were signed by all participating patients. The study was approved by the Ethics Committee of Affiliated Hospital of Youjiang Medical University for Nationalities and conducted in strict accordance with the Declaration of Helsinki. All animal experiments were performed in accordance with the approval of the Animal Ethics Committee of Affiliated Hospital of Youjiang Medical University for Nationalities.
Bioinformatics Prediction
The GEO database (https://www.ncbi.nlm.nih.gov/geo) was explored to identify differentially expressed gene profiles of HCC (GEO: GSE45267, GSE49515, and GSE62232), after which the relevant annotation files were downloaded. The analysis was conducted using R software with limma package. |logFC| > 1 and p < 0.05 were set as the threshold to screen the differentially expressed genes. Then the gene expression heatmap was drawn with the heatmap package of R software.
Study Subjects
A total of 58 HCC patients, including 49 males and 9 females (mean age of 50.14 ± 13.63 years) who received surgical resection at the Department of Hepatobiliary Surgery of Affiliated Hospital of Youjiang Medical University for Nationalities from July 2016 to January 2017, were enrolled in the experiment. The surgically resected nodules from patients were confirmed to be HCC by means of histopathological examination. All participating patients were yet to receive any treatment prior to the surgery. All nodules were completely resected with non-neoplastic tissue on the surface identified by histopathological examination. Complete clinicopathological characteristics and follow-up data of patients were collected. Patients who died of non-liver diseases or accidents were excluded from the study. Based on Edmondson’s classification, there were 35 cases at stage I-II and 23 cases at stage III-IV. Based on the TNM staging criteria, 16 cases were at clinical stage I, 24 cases were at clinical stage II, and 18 cases were at clinical stage III. Besides, normal liver tissues were collected from 20 healthy donors after liver transplantation.
Cell Culture and Treatment
Human normal liver cell line QSG-7701 and human HCC cell lines HuH-7, HCCLM3, HepG2, BEL-7402, SK-HEP-1, and SMMC-7721 were purchased from Shanghai Institute of Life Sciences, Chinese Academy of Sciences (Shanghai, China) (http://www.cellbank.org.cn/index.asp). SK-HEP-1 and HepG2 cells were cultured in minimum essential medium (MEM) containing 10% fetal bovine serum (FBS). HuH-7 cells were cultured in DMEM containing 10% FBS. QSG-7701, BEL-7402, and SMMC-7721 cells were cultured in RPMI 1640 medium containing 10% FBS. All media utilized in the experiment were purchased from GIBCO (Gaithersburg, MD, USA). The cells were cultured in the 37°C incubator with 5% CO2.
KDM1A inhibitor TCP (Enzo Life Sciences, Farmingdale, NY, USA) was dissolved in DMSO. HCC cells were plated into 60 × 15 mm flasks, 1.5 × 10⁵ cells/flask, and treated with 0.5% DMSO containing 1 mM TCP for 24 h or with 0.5% DMSO solution alone for 24 h. The medium was then renewed, after which the cells were cultured for 7 days before RNA extraction.
Recombinant Lentivirus Construction and Infection
The sequence of MAGI2-AS3 and cDNA sequence of KDM1A and RACGAP1 were cloned into lentivirus vector LV-GFP-N to generate recombinant lentiviruses overexpressing MAGI2-AS3, KDM1A and RACGAP1 oe-MAGI2-AS3, oe-KDM1A, and oe-RACGAP1. The short hairpin RNA (shRNA) sequence of MAGI2-AS3 or RACGAP1 was inserted into the pLKO.1-GFP vector (Invitrogen, Waltham, MA, USA) in order to generate sh-MAGI2-AS3 and sh-RACGAP1 plasmids. sh-MAGI2-AS3, sh-RACGAP1, and sh-NC were constructed by Shanghai GenePharma (Shanghai, China).
The lentivirus package was conducted using 293T cells, which were cultured in RPMI 1640 medium containing 10% FBS and passaged every other day. The aforementioned lentiviruses were employed for infection purposes.
For lentivirus infection, HCC cells in the logarithmic growth phase were collected and suspended at a density of 5 × 10⁴ cells/mL. Cells were plated into six-well plates with a volume of 2 mL/well. The next day, the cells were infected with lentivirus (1 × 10⁸ transducing units [TU]/mL) with the expression efficiency indicated by GFP fluorescence analyzed under a fluorescence microscope 48 h after infection.
qRT-PCR
The total RNA of the HCC cells and that of the tissues were extracted using TRIzol reagent (Sigma-Aldrich Chemical Company, St. Louis, MO, USA). After quality confirmation and concentration determination using UV-visible spectrophotometry, the RNA was reversely transcribed into cDNA using PrimeScript RT reagent (TaKaRa, Tokyo, Japan). Next, real-time qPCR was performed using the SYBR Premix Ex Taq II (Tli RNaseH Plus) kit (TaKaRa, Tokyo, Japan) with cDNA obtained above regarded as the template, and the reaction was conducted in Thermal Cycler Dice Real Time System (TP800; TaKaRa Bio, Tokyo, Japan). The primers used are listed in Table S2, all of which were designed using Primer Express 2.0 software and synthesized by RiboBio (Guangzhou, Guangdong, China). The fold changes of target genes relative to β-actin were calculated by means of relative quantification (2−ΔΔCt method).
Western Blot Analysis
Next, the cells were collected, washed with PBS, and lysed in protein lysis buffer containing proteinase and alkaline phosphatase inhibitors at 4°C for 30 min. The protein was separated by 10% SDS-PAGE and then transferred onto a polyvinylidene fluoride (PVDF) membrane. Then the membrane was blocked with 5% skimmed milk for 1 h and incubated with primary antibodies diluted in Tris-buffered saline containing Tween 20 (TBST) buffer at 4°C overnight. The following antibodies were used: anti-KDM1A (ab90966, 1:1,000; Abcam, Cambridge, MA, USA), anti-RACGAP1 (ab2270, 1:1,000; Abcam, Cambridge, MA, USA), and anti-GAPDH (ab8245, 1:5,000; Abcam, Cambridge, MA, USA). After three TBST washes, the membrane was incubated with horseradish peroxidase (HRP)-conjugated secondary antibody for 1 h. After additional TBST washes, the membrane was incubated with enhanced chemiluminescence (ECL) reagents before scanning. The gray values were analyzed using ImageJ software with the expression level calculated based on the ratio of gray values of the target protein band to the GAPDH band.
FISH Assay
FISH technology was adopted to detect the subcellular localization of MAGI2-AS3 in HCC cells. In order to achieve this, the cells were plated into a 24-well plate containing coverslip at a density of 5 × 10³ cells/well. After 24 h, cells were washed with PBS, then fixed with PBS containing 4% paraformaldehyde and permeabilized with PBS containing 0.5% Triton X-100. After that, cells were blocked with a pre-hybridization solution and subsequently incubated with MAGI2-AS3 probes at 37°C overnight. Next, the cells were rinsed with a hybridization solution at 42°C under conditions void of light and subsequently stained with DAPI (Sigma-Aldrich Chemical Company, St. Louis, MO, USA). The coverslips were mounted on slides with an anti-fade reagent, after which images were acquired under a laser confocal microscope.
Nuclear and Cytoplasmic RNA Fractionation
Nuclear and cytoplasmic fractionation followed by RNA isolation was conducted using the PARIS Kit (Life Technologies Corporation, Gaithersburg, MD, USA). After the HCC cells had been collected, they were then centrifuged at 4°C, 500 × g for 5 min, and washed with PBS. The cells were then suspended in cell fractionation buffer gently and placed on ice for 5–10 min, and then centrifuged at 4°C, 500 × g for 5 min. The supernatant (cytoplasm) was then collected and centrifuged at 4°C, 500 × g for an additional 5 min, with the resultant supernatant obtained as cytoplasmic fractions. The pellet (nucleus) obtained in the cell fractionation buffer was suspended in pre-cooled cell disruption buffer and vortexed vigorously until the lysate was homogeneous; then the nuclear fractions were obtained.
In regard to RNA isolation, an equal volume of 2× lysis and binding solution was added into cytoplasmic and nuclear fractions, respectively, and mixed gently at room temperature, after which 100% ethanol was added and mixed gently. The sample mixture was then added into the filter cartridge for RNA binding and centrifuged. After being washed with solutions 1 and 2/3, the filter cartridge was placed into a fresh tube and 40 μL/10 μL pre-heated (95°C–100°C) elution solution was added to elute the RNA twice. The expression of MAGI2-AS3 was detected by qRT-PCR, with 45S rRNA regarded as an internal reference of nuclear RNA and 12S rRNA as an internal reference of cytoplasmic RNA.
EdU Assay
Forty-eight hours after infection, the cells were incubated with culture medium containing EdU (25 μmol/L) for 2 h. After being fixed with 4% paraformaldehyde for 30 min and permeabilized with 0.5% Triton X-100 for 10 min, the cells were stained with Apollo dye solution in the dark. After the nucleus was stained with DAPI, the cells were subjected to image acquisition and quantification analysis.
TUNEL Assay
The HCC cells were plated and cultured in the dish containing coverslips for 24 h. After the cells had been fixed with 4% paraformaldehyde for 60 min, the cells were permeabilized with PBS containing 0.1% Triton X-100 and placed on ice for 2 min. The cells were treated with TUNEL staining solution at 37°C for 60 min under dark conditions. After three PBS washes, the cells were sealed and observed under a fluorescence microscope (Olympus FV1000; Tokyo, Japan) with the excitation wavelength from 450 to 500 nm and the emission wavelength from 515 to 565 nm. The fluorescence was identified in the apoptotic cells.
Transwell Assay
Next, the evaluation of cell migration was conducted by initially performing cell digestion with trypsin, followed by two PBS washes and suspension with serum-free medium. The cell density was then adjusted to 1 × 10⁵ cells/mL. Next, 150 μL cell suspension was added into the apical chamber and 500 μL medium containing 20% serum was added into the basolateral chamber. After 48 h, the chambers were then removed and washed with aseptic PBS. The cells in the inner layer of the microporous membrane were carefully wiped using cotton swabs, fixed with 95% ethanol for 6 min, and then stained with 4 g/L crystal violet solution. After that, the migrated cells were observed and counted under an inverted microscope. The mean values of the cell number in five randomly selected fields were calculated. The experiment was repeated three times independently. The procedures for cell invasion assessment were similar except that the basement membrane of the apical chamber was pre-coated with Matrigel before cells.
Immunohistochemistry
The transplanted tumors in nude mice were dissected, fixed in 4% paraformaldehyde, embedded in paraffin, and made into 5-μm-thick sections. After dewaxing, the sections were subjected to microwave antigen retrieval. The Histostain SP-9000 immunohistochemical staining kit (Zymed, San Francisco, CA, USA) was employed for immunohistochemistry staining. The sections were then rinsed with PBS and blocked with normal goat serum. The sections were then incubated with RACGAP1 antibody (ab2270; Abcam, Cambridge, MA, USA) at 4°C overnight. After rewarming and PBS washing, the sections were incubated with horseradish-labeled goat anti-rabbit IgG (ab6721; Abcam) under conditions void of light at 37°C for 30 min. The sections were then developed with diaminobenzidine (DAB) for 5–10 min. The sections were then counterstained with hematoxylin for 1 min, with the sections sealed with gum and analyzed under a microscope.
RIP Assay
Upon reaching 90% confluence, 1 × 10⁷ HCC cells were lysed using RIP lysis buffer as per the instruction of the Magna RIP Kit (Millipore, Billerica, MA, USA). The supernatant was then collected and divided into two equal parts. The inputs were used for total protein detection by western blot analysis and RNA assessment by qRT-PCR. Another part of the cell lysate was incubated with RIP buffer containing magnetic beads (pre-coated with normal mouse IgG or rabbit polyclonal antibody to KDM1A [ab17721, 1:1,000; Abcam]) at 4°C overnight. After incubation and rapid centrifugation, the centrifuge tube was placed on a magnetic separator with the supernatant subsequently discarded. The magnetic beads were washed six times with RIP wash buffer, after which the loading buffer was added for elution. The eluted samples were incubated with Proteinase K at 55°C for 30 min to allow protein to be detached. Afterward, TRIzol-chloroform was used to isolate the immunoprecipitated RNA, in which the enrichment of MAGI2-AS3 was detected by qRT-PCR.
Biotin-Labeled RNA Pull-Down Assay
Biotin-labeled RNAs were generated by in vitro transcription using Biotin RNA labeling mix (Roche Diagnostics, Mannheim, Germany) and T7 RNA polymerase (Promega). The transcribed RNAs were treated with RNase-free DNase I (Promega) and then purified with RNeasy Mini Kit (QIAGEN). A total of 3 μg biotin-labeled RNAs was incubated at 90°C for 2 min, placed on ice for 2 min, and then allowed to incubate with RNA structure buffer (10 mM Tris [pH 7.0], 0.1 M KCl, and 10 mM MgCl2) at room temperature for 20 min. Afterward, 1 × 10⁷ HCC cells were suspended with 2 mL PBS and lysed with 2 mL nuclear separation buffer and 6 mL H2O on ice for 20 min, followed by centrifugation at 2,500 × g for 15 min. The nuclear fraction was then suspended with 1 mL RIP buffer and homogenized 15–20 times. After the nuclear debris had been removed, Streptavidin-agarose beads (InEnthigy) were incubated with the supernatant at room temperature for 1 h. The agarose beads were then washed five times with PBS and incubated with 5× loading buffer at 95°C for 5 min in order to allow elution. Finally, the eluted protein was analyzed by western blots.
ChIP Assay
ChIP assay was performed using Magna ChIP and EZ-Magna ChIP Kit (Millipore) as previously reported.34 In brief, HCC cells at the logarithmic growth phase were collected and cross-linked with 1% formaldehyde for 10 min, which was then halted by incubation with 125 mM glycine at room temperature for 5 min. The cell suspension was then sonicated in order to break the DNA chains into small fragments. The sonicated DNA was then incubated with rabbit polyclonal antibody to H3K4me2 (ab7766; Abcam), rabbit polyclonal antibody to KDM1A (ab17721; Abcam), or control rabbit IgG (ab172730; Abcam) overnight for immunoprecipitation. In the immunoprecipitated complex, the DNA fragments were quantified by qPCR. The qPCR signals of the immunoprecipitated DNA were normalized to input and subsequently compared with the signal of the control IgG group.
Nude Mouse Models of HCC In Vivo
The experiment was performed as previously reported.35 In brief, 48 specific pathogen-free (SPF) female nude mice (aged 4–6 weeks and weighing 21–30 g) were divided into four groups. A total of 6 × 10⁶ HepG2 cells were infected with lentivirus harboring NC sequence, MAGI2-AS3 sequence, sh-NC, or shRACGAP1 for 24 h, collected, and diluted with Matrigel of equal volume. Next, 0.2 mL cell suspension (3 × 10⁶ cells) was injected into the right axilla of each nude mouse. The body weight and tumor size of mice were measured every other day, with the volume of the tumor calculated using the following formula: V (mm3) = 1/2 L × D2 (L referred to maximum length; D referred to minimum diameter). Four weeks later, the mice were euthanized, and the tumor tissues were resected and weighed.
Statistical Analysis
All statistical analyses were conducted using SPSS 21 software (IBM, Armonk, NY, USA). The data were presented as mean ± SD. Normal distribution and homogeneity of variance were examined. Data between two groups with normal distribution and homogeneity of variance were compared using an unpaired t test, whereas those among multiple groups were compared using one-way ANOVA or repeated-measures ANOVA. A p value <0.05 was considered to be reflective of statistical significance.
Author Contributions
J.P., J.W., H.W., and T.L. designed the study. X.W., Y.W., and Z.S. collated the data, designed and developed the database, carried out data analyses, and produced the initial draft of the manuscript. J.P., J.W., H.W., C.L., and Y.L. contributed to drafting the manuscript. All authors have read and approved the final submitted manuscript.
Conflicts of Interest
The authors declare no competing interests.
Acknowledgments
We would like to acknowledge the helpful comments on this paper received from our reviewers. This work was supported by the Guangxi Science and Technology Project (AD17129025) and Guangxi Medical and Health Appropriate Technology Development and Application Project (S201653).
Footnotes
Supplemental Information can be found online at https://doi.org/10.1016/j.omtn.2019.08.020.
Supplemental Information
References
- 1.Goldberg D.S., Taddei T.H., Serper M., Mehta R., Dieperink E., Aytaman A., Baytarian M., Fox R., Hunt K., Pedrosa M. Identifying barriers to hepatocellular carcinoma surveillance in a national sample of patients with cirrhosis. Hepatology. 2017;65:864–874. doi: 10.1002/hep.28765. [DOI] [PubMed] [Google Scholar]
- 2.Bray F., Ferlay J., Soerjomataram I., Siegel R.L., Torre L.A., Jemal A. Global cancer statistics 2018: GLOBOCAN estimates of incidence and mortality worldwide for 36 cancers in 185 countries. CA Cancer J. Clin. 2018;68:394–424. doi: 10.3322/caac.21492. [DOI] [PubMed] [Google Scholar]
- 3.Welzel T.M., Graubard B.I., Quraishi S., Zeuzem S., Davila J.A., El-Serag H.B., McGlynn K.A. Population-attributable fractions of risk factors for hepatocellular carcinoma in the United States. Am. J. Gastroenterol. 2013;108:1314–1321. doi: 10.1038/ajg.2013.160. [DOI] [PMC free article] [PubMed] [Google Scholar]
- 4.Bruix J., Gores G.J., Mazzaferro V. Hepatocellular carcinoma: clinical frontiers and perspectives. Gut. 2014;63:844–855. doi: 10.1136/gutjnl-2013-306627. [DOI] [PMC free article] [PubMed] [Google Scholar]
- 5.Kulik L., El-Serag H.B. Epidemiology and Management of Hepatocellular Carcinoma. Gastroenterology. 2019;156:477–491.e471. doi: 10.1053/j.gastro.2018.08.065. [DOI] [PMC free article] [PubMed] [Google Scholar]
- 6.Quinn J.J., Chang H.Y. Unique features of long non-coding RNA biogenesis and function. Nat. Rev. Genet. 2016;17:47–62. doi: 10.1038/nrg.2015.10. [DOI] [PubMed] [Google Scholar]
- 7.Marchese F.P., Raimondi I., Huarte M. The multidimensional mechanisms of long noncoding RNA function. Genome Biol. 2017;18:206. doi: 10.1186/s13059-017-1348-2. [DOI] [PMC free article] [PubMed] [Google Scholar]
- 8.Ling H., Fabbri M., Calin G.A. MicroRNAs and other non-coding RNAs as targets for anticancer drug development. Nat. Rev. Drug Discov. 2013;12:847–865. doi: 10.1038/nrd4140. [DOI] [PMC free article] [PubMed] [Google Scholar]
- 9.Prensner J.R., Chinnaiyan A.M. The emergence of lncRNAs in cancer biology. Cancer Discov. 2011;1:391–407. doi: 10.1158/2159-8290.CD-11-0209. [DOI] [PMC free article] [PubMed] [Google Scholar]
- 10.Wong C.M., Tsang F.H., Ng I.O. Non-coding RNAs in hepatocellular carcinoma: molecular functions and pathological implications. Nat. Rev. Gastroenterol. Hepatol. 2018;15:137–151. doi: 10.1038/nrgastro.2017.169. [DOI] [PubMed] [Google Scholar]
- 11.Yang Y., Chen L., Gu J., Zhang H., Yuan J., Lian Q., Lv G., Wang S., Wu Y., Yang Y.T. Recurrently deregulated lncRNAs in hepatocellular carcinoma. Nat. Commun. 2017;8:14421. doi: 10.1038/ncomms14421. [DOI] [PMC free article] [PubMed] [Google Scholar]
- 12.Wang F., Zu Y., Zhu S., Yang Y., Huang W., Xie H., Li G. Long noncoding RNA MAGI2-AS3 regulates CCDC19 expression by sponging miR-15b-5p and suppresses bladder cancer progression. Biochem. Biophys. Res. Commun. 2018;507:231–235. doi: 10.1016/j.bbrc.2018.11.013. [DOI] [PubMed] [Google Scholar]
- 13.Yang Y., Yang H., Xu M., Zhang H., Sun M., Mu P., Dong T., Du S., Liu K. Long non-coding RNA (lncRNA) MAGI2-AS3 inhibits breast cancer cell growth by targeting the Fas/FasL signalling pathway. Hum. Cell. 2018;31:232–241. doi: 10.1007/s13577-018-0206-1. [DOI] [PubMed] [Google Scholar]
- 14.Ke H.L., Ke R.H., Li S.T., Li B., Lu H.T., Wang X.Q. Expression of RACGAP1 in high grade meningiomas: a potential role in cancer progression. J. Neurooncol. 2013;113:327–332. doi: 10.1007/s11060-013-1121-7. [DOI] [PubMed] [Google Scholar]
- 15.Imaoka H., Toiyama Y., Saigusa S., Kawamura M., Kawamoto A., Okugawa Y., Hiro J., Tanaka K., Inoue Y., Mohri Y., Kusunoki M. RacGAP1 expression, increasing tumor malignant potential, as a predictive biomarker for lymph node metastasis and poor prognosis in colorectal cancer. Carcinogenesis. 2015;36:346–354. doi: 10.1093/carcin/bgu327. [DOI] [PubMed] [Google Scholar]
- 16.Wang S.M., Ooi L.L., Hui K.M. Upregulation of Rac GTPase-activating protein 1 is significantly associated with the early recurrence of human hepatocellular carcinoma. Clin. Cancer Res. 2011;17:6040–6051. doi: 10.1158/1078-0432.CCR-11-0557. [DOI] [PubMed] [Google Scholar]
- 17.McCabe M.T., Mohammad H.P., Barbash O., Kruger R.G. Targeting Histone Methylation in Cancer. Cancer J. 2017;23:292–301. doi: 10.1097/PPO.0000000000000283. [DOI] [PubMed] [Google Scholar]
- 18.Kooistra S.M., Helin K. Molecular mechanisms and potential functions of histone demethylases. Nat. Rev. Mol. Cell Biol. 2012;13:297–311. doi: 10.1038/nrm3327. [DOI] [PubMed] [Google Scholar]
- 19.Hosseini A., Minucci S. A comprehensive review of lysine-specific demethylase 1 and its roles in cancer. Epigenomics. 2017;9:1123–1142. doi: 10.2217/epi-2017-0022. [DOI] [PubMed] [Google Scholar]
- 20.Yang X.M., Cao X.Y., He P., Li J., Feng M.X., Zhang Y.L., Zhang X.L., Wang Y.H., Yang Q., Zhu L. Overexpression of Rac GTPase Activating Protein 1 Contributes to Proliferation of Cancer Cells by Reducing Hippo Signaling to Promote Cytokinesis. Gastroenterology. 2018;155:1233–1249.e1222. doi: 10.1053/j.gastro.2018.07.010. [DOI] [PubMed] [Google Scholar]
- 21.Nicholson T.B., Chen T. LSD1 demethylates histone and non-histone proteins. Epigenetics. 2009;4:129–132. doi: 10.4161/epi.4.3.8443. [DOI] [PubMed] [Google Scholar]
- 22.Bruix J., Reig M., Sherman M. Evidence-Based Diagnosis, Staging, and Treatment of Patients With Hepatocellular Carcinoma. Gastroenterology. 2016;150:835–853. doi: 10.1053/j.gastro.2015.12.041. [DOI] [PubMed] [Google Scholar]
- 23.Llovet J.M., Villanueva A., Lachenmayer A., Finn R.S. Advances in targeted therapies for hepatocellular carcinoma in the genomic era. Nat. Rev. Clin. Oncol. 2015;12:436. doi: 10.1038/nrclinonc.2015.121. [DOI] [PubMed] [Google Scholar]
- 24.de Oliveira J.C., Oliveira L.C., Mathias C., Pedroso G.A., Lemos D.S., Salviano-Silva A., Jucoski T.S., Lobo-Alves S.C., Zambalde E.P., Cipolla G.A., Gradia D.F. Long non-coding RNAs in cancer: Another layer of complexity. J. Gene Med. 2019;21:e3065. doi: 10.1002/jgm.3065. [DOI] [PubMed] [Google Scholar]
- 25.Luo C.L., Xu Z.G., Chen H., Ji J., Wang Y.H., Hu W., Wang K., Zhang W.W., Yuan C.H., Wang F.B. LncRNAs and EGFRvIII sequestered in TEPs enable blood-based NSCLC diagnosis. Cancer Manag. Res. 2018;10:1449–1459. doi: 10.2147/CMAR.S164227. [DOI] [PMC free article] [PubMed] [Google Scholar]
- 26.Zhu N., Hou J., Wu Y., Liu J., Li G., Zhao W., Ma G., Chen B., Song Y. Integrated analysis of a competing endogenous RNA network reveals key lncRNAs as potential prognostic biomarkers for human bladder cancer. Medicine (Baltimore) 2018;97:e11887. doi: 10.1097/MD.0000000000011887. [DOI] [PMC free article] [PubMed] [Google Scholar]
- 27.Mi S., Lin M., Brouwer-Visser J., Heim J., Smotkin D., Hebert T., Gunter M.J., Goldberg G.L., Zheng D., Huang G.S. RNA-seq Identification of RACGAP1 as a Metastatic Driver in Uterine Carcinosarcoma. Clin. Cancer Res. 2016;22:4676–4686. doi: 10.1158/1078-0432.CCR-15-2116. [DOI] [PubMed] [Google Scholar]
- 28.Saigusa S., Tanaka K., Mohri Y., Ohi M., Shimura T., Kitajima T., Kondo S., Okugawa Y., Toiyama Y., Inoue Y., Kusunoki M. Clinical significance of RacGAP1 expression at the invasive front of gastric cancer. Gastric Cancer. 2015;18:84–92. doi: 10.1007/s10120-014-0355-1. [DOI] [PubMed] [Google Scholar]
- 29.Ge Q., Lu M., Ju L., Qian K., Wang G., Wu C.L., Liu X., Xiao Y., Wang X. miR-4324-RACGAP1-STAT3-ESR1 feedback loop inhibits proliferation and metastasis of bladder cancer. Int. J. Cancer. 2019;144:3043–3055. doi: 10.1002/ijc.32036. [DOI] [PubMed] [Google Scholar]
- 30.Tsai M.C., Manor O., Wan Y., Mosammaparast N., Wang J.K., Lan F., Shi Y., Segal E., Chang H.Y. Long noncoding RNA as modular scaffold of histone modification complexes. Science. 2010;329:689–693. doi: 10.1126/science.1192002. [DOI] [PMC free article] [PubMed] [Google Scholar]
- 31.Fang R., Barbera A.J., Xu Y., Rutenberg M., Leonor T., Bi Q., Lan F., Mei P., Yuan G.C., Lian C. Human LSD2/KDM1b/AOF1 regulates gene transcription by modulating intragenic H3K4me2 methylation. Mol. Cell. 2010;39:222–233. doi: 10.1016/j.molcel.2010.07.008. [DOI] [PMC free article] [PubMed] [Google Scholar]
- 32.Kong L., Zhang P., Li W., Yang Y., Tian Y., Wang X., Chen S., Yang Y., Huang T., Zhao T. KDM1A promotes tumor cell invasion by silencing TIMP3 in non-small cell lung cancer cells. Oncotarget. 2016;7:27959–27974. doi: 10.18632/oncotarget.8563. [DOI] [PMC free article] [PubMed] [Google Scholar]
- 33.Ismail T., Lee H.K., Kim C., Kwon T., Park T.J., Lee H.S. KDM1A microenvironment, its oncogenic potential, and therapeutic significance. Epigenetics Chromatin. 2018;11:33. doi: 10.1186/s13072-018-0203-3. [DOI] [PMC free article] [PubMed] [Google Scholar]
- 34.Gong Y., Li Y., Abdolmaleky H.M., Li L., Zhou J.R. Tanshinones inhibit the growth of breast cancer cells through epigenetic modification of Aurora A expression and function. PLoS ONE. 2012;7:e33656. doi: 10.1371/journal.pone.0033656. [DOI] [PMC free article] [PubMed] [Google Scholar]
- 35.Wei Y., Yang Q., Zhang Y., Zhao T., Liu X., Zhong J., Ma J., Chen Y., Zhao C., Li J. Plumbagin restrains hepatocellular carcinoma angiogenesis by suppressing the migration and invasion of tumor-derived vascular endothelial cells. Oncotarget. 2017;8:15230–15241. doi: 10.18632/oncotarget.14774. [DOI] [PMC free article] [PubMed] [Google Scholar]
Associated Data
This section collects any data citations, data availability statements, or supplementary materials included in this article.