

Abstract
Background
Hepcidin‐25 regulates iron homeostasis by binding the iron transporter ferroportin, causing its degradation. Increased hepcidin‐25 causes decreased intestinal iron absorption and release from intracellular stores. Our objective in this study was to measure hepcidin‐25 levels in patients with chronic kidney disease (CKD) to determine if they might contribute to the anemia of CKD.
Methods
We used a hepcidin‐25‐specific enzyme‐linked immunosorbent assay to measure hepcidin‐25 in 103 CKD patients and 100 healthy individuals. We assessed in CKD subjects the correlation of hepcidin‐25 with creatinine, estimated glomerular filtration rate (eGFR), hemoglobin, blood urea nitrogen, serum iron, transferrin, and ferritin.
Results
Hepcidin‐25 concentrations in CKD patients were significantly increased compared to healthy subjects (60.4 ± 6.1 μg/l vs. 3.0 ± 0.5 μg/l, P < 0.001). Hepcidin‐25 concentrations were directly correlated with creatinine (R = 0.28, P = 0.004) and inversely correlated with eGFR (R = −0.32, P = 0.001). Hepcidin‐25 levels were also correlated with transferrin (R = −0.28, P = 0.004) and ferritin (R = 0.80, P < 0.001).
Conclusion
The direct correlation of hepcidin‐25 with creatinine and its inverse correlation with eGFR suggest that hepcidin‐25 levels increase as renal function deteriorates, possibly due to decreased hepcidin‐25 renal clearance.
Keywords: anemia, ferritin, hepcidin, immunoassay, iron
INTRODUCTION
Iron homeostasis is essential in sustaining red blood cell production and subsequent oxygen distribution throughout the body. The 25‐amino acid active form of hepcidin (hepcidin‐25) is the master hormone regulating iron homeostasis in humans 1, 2 Hepcidin‐25 is synthesized and secreted by the liver and controls dietary iron absorption and release of hepatic and macrophage iron stores by binding directly to the iron transport protein ferroportin, causing it to be internalized and degraded. This results in decreased iron transport across the cell membrane, which decreases iron availability for hemoglobin production and erythropoiesis 3, 4, 5, 6, 7.
In healthy individuals, iron status regulates hepatic hepcidin synthesis and secretion to guard against anemia or iron overload 8, 9. Hepcidin deficiency has been described in hereditary hemochromatosis, a disease in which inappropriately high levels of iron are absorbed and cause iron toxicity 10, 11, 12. Hypoxia and anemia reduce serum hepcidin levels in order to facilitate iron transport and erythropoiesis 8. In anemia of chronic disease and inflammation, there is reduced iron availability for erythropoiesis 13, 14, 15. Recent data have suggested that there is a significant increase in the hepcidin levels of individuals with chronic kidney disease (CKD) 16, 17, 18. Such increases would suggest that elevated hepcidin and its consequential inhibition of iron transport may play a key role in the anemia observed in CKD.
Until recently, the lack of an immunoassay to selectively measure hepcidin‐25 in serum has left many unanswered questions around its role in the anemia of chronic disease, including CKD 19. Previous approaches have included measuring urine hepcidin and the hepcidin precursor, prohepcidin. These analytes, however, function only as surrogate measures of serum hepcidin‐25, and their associations with iron status are not well understood 20, 21, 22, 23, 24. Specific mass spectrometry assays have been used to measure serum hepcidin‐25 concentrations, however, the relatively low throughput and high amount of operator expertise required can be limiting 25. Development of an immunoassay to measure active hepcidin has been difficult due to the size of the peptide (approximately 2.7 kDa), and the fact that it contains four disulfide bonds 26, 27. To add further complexity, there are inactive N‐terminal cleavage products of hepcidin‐25 (hepcidin‐20 and hepcidin‐22) that do not appear to play a role in maintaining iron homeostasis 28. There have been reports describing serum hepcidin competitive immunoassays that use polyclonal capture antibodies, but there are inherent concerns around cross‐reactivity with hepcidin‐20 and hepcidin‐22 using this approach 29. Furthermore, recent data demonstrated that these inactive variants may be disproportionately increased in CKD subjects 25. It is therefore important that an assay specific for hepcidin‐25 be utilized to assess hepcidin levels in patients with renal disease.
Recently, our laboratory developed a dual monoclonal antibody sandwich enzyme‐linked immunosorbent assay (ELISA) that is highly specific for hepcidin‐25 in human serum 30. In this study, we utilized our assay to measure serum levels of hepcidin‐25 in 103 patients with CKD, and compared them with serum hepcidin‐25 levels of 100 healthy subjects to better understand the concentrations of hepcidin‐25 present in CKD. We hypothesized that hepcidin‐25 levels might be increased in CKD due to the inability of the kidneys to filter and clear hepcidin‐25 and that the increased levels might be at least partly responsible for the anemia observed. We then assessed the correlation of hepcidin‐25 with creatinine, estimated glomerular filtration rate (eGFR), hemoglobin, blood urea nitrogen (BUN), serum iron, transferrin, and ferritin in CKD patients.
METHODS
Human Samples (CKD Patients)
Human serum samples were collected from 103 individuals with CKD from the IU Methodist Research Institute in Indianapolis, Indiana (ages 28–90 years, average age 68 years). Of the 103 individuals, 56 were males and 47 were females. The group represented CKD stages 3–4 and end‐stage renal disease (ESRD, stage 5) without dialysis. The numbers of CKD patients at each particular stage were as follows: stage 5–51 patients, stage 4–23 patients, stage 3–29 patients. The group of CKD patients studied had a diverse range of causes resulting in CKD. These included diabetes mellitus, hypertension, polycystic kidney disease, focal segmental glomerulosclerosis, transplant rejection, and membranous nephropathy. We were unable to obtain iron supplementation data, transfusion histories, or records of erythropoietin (EPO) and other erythropoiesis‐stimulating agent (ESA) usage for these patients due to patient privacy restrictions around sample donation. Analysis of creatinine, hemoglobin, and BUN were performed using an I‐STAT blood analyzer (Abbott, Abbott Park, North Chicago, IL USA). eGFRs were determined by incorporating creatinine levels and biometric data into the Cockroft–Gault formula 31. Serum iron, transferrin, and ferritin levels were measured in the CKD patients using an automated Roche (Indianapolis, IN USA) Hitachi analyzer. After obtaining protocol approval and proper informed consent from an institutional review board, all samples were collected, stored, and de‐identified to protect patient privacy. Samples were shipped on dry ice and stored at −70°C prior to analysis of hepcidin‐25.
Human Samples (Healthy Individuals)
Hundred serum samples from healthy volunteers (ages 18–64 years, mean age 37 years) were purchased from Valley Biomedical Inc., (Winchester, VA USA). The samples were obtained from 50 female and 50 male donors. Samples were received on dry ice and stored at −70°C prior to analysis of hepcidin‐25 levels.
Hepcidin‐25 ELISA
Hepcidin‐25 levels were measured as previously described 30 with minor modifications. Briefly, a human hepcidin‐25 MesoScale Discovery (MSD) ELISA was performed using streptavidin‐coated and blocked wells that were incubated for 1 hr with biotinylated anti‐hepcidin‐25 capture antibody (2 mg/l). Afterward, wells were aspirated and washed three times with TBST (Tris‐buffered saline containing 10 mmol/l Tris pH 7.40, 150 mmol/l NaCl with 1 ml Tween 20/l). Next, 100 μl of hepcidin‐25 (Peptides International, Louisville, KY USA) standards (varying concentrations of hepcidin‐25 protein in assay buffer consisting of 50 mmol/l HEPES (4‐(2‐hydroxyethyl)‐1‐piperazineethanesulfonic acid), pH 7.40, 150 mmol/l NaCl, 10 ml/l Triton X‐100, 5 mmol/l EDTA (ethylenediaminetetraacetic acid), and 5 mmol/l EGTA (ethylene glycol tetraacetic acid)) were added to the wells to generate a standard calibration curve. Serum samples were diluted in a ratio of 1:20 in assay buffer and added to their respective wells, and the ELISA plate was incubated for 1 hr at room temperature. Following aspiration, wells were washed three times with TBST, and 100 μl of a 1:1,000 dilution of conjugate antibody (ruthenium‐labeled antihepcidin detection antibody, 1 mg/l) were added to the wells for a 1 hr incubation at room temperature. Following aspiration, wells were washed three times with TBST, and the plate was developed using a MSD reader, which recorded ruthenium electrochemiluminescence.
Data Analysis
MSD software and SigmaPlot version 8.0 were used for fitting ELISA calibration curves. For each group of subjects studied, results were expressed as the mean ± SEM. Data were plotted and graphed using version 2.98 of the program FigP (Biosoft). Comparisons of hepcidin‐25 levels with other analytes were performed using the same program. Data were analyzed by one‐way analysis of variance followed by comparisons between the means using the least significant difference test. For each correlation performed between independent analytes, statistical analysis was performed using the same program to calculate Spearman correlation coefficients. In each case, a P‐value of less than 0.05 was considered to indicate statistical significance.
RESULTS
In our current study, we utilized our previously described, sensitive and specific ELISA to assess serum hepcidin‐25 levels in patients with CKD. Routine laboratory profiles for these patients are shown in Table 1. In addition, we analyzed the sera of 100 healthy individuals in which the mean serum hepcidin‐25 level was 3.0 ± 0.5 μg/l, consistent with the concentrations of hepcidin‐25 that our laboratory has previously observed in healthy volunteer subjects 30.
Table 1.
CKD Patients’ Profiles—Results Are Shown as the Mean ± SEM for 103 CKD Patients
| Analyte | Value |
|---|---|
| Cr | 4.9 ± 0.3 mg/dl |
| eGFR | 22.0 ± 1.9 ml/min |
| BUN | 39.8 ± 2.2 mg/dl |
| Hemoglobin | 12.6 ± 0.8 g/dl |
| Serum iron | 69.4 ± 4.4 μg/dl |
| Transferrin | 1.9 ± 0.1 g/l |
| Ferritin | 671.7 ± 57.5 μg/l |
As Figure 1 demonstrates, hepcidin‐25 levels were approximately 20‐fold elevated in patients with CKD compared to healthy subjects. This marked increase in mean serum hepcidin‐25 concentrations in the CKD patients compared to healthy subjects was highly significant (60.4 ± 6.1 μg/l vs. 3.0 ± 0.5 μg/l, P < 0.001). These results are in agreement with recent findings that have reported increases in total hepcidin for patients with CKD 16, 17, 32. Our current results further indicate that concentrations of the active form of the hormone (hepcidin‐25) are dramatically elevated in CKD.
Figure 1.
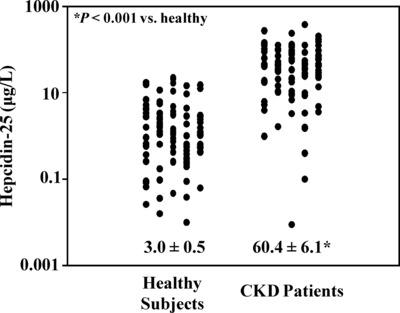
Serum hepcidin‐25 concentrations in CKD patients and normal subjects—serum samples from 100 healthy subjects and 103 patients with CKD were analyzed for hepcidin‐25 concentrations. Results are plotted as individual points with the mean ± SEM also shown. Serum hepcidin‐25 concentrations in patients with CKD were significantly increased compared to healthy subjects (60.4 ± 6.1 μg/l vs. 3.0 ± 0.5 μg/l, P < 0.001).
After obtaining these data, we next examined the correlation of hepcidin‐25 with creatinine, eGFR, BUN, hemoglobin, serum iron, transferrin, and ferritin in the patients with CKD. Creatinine levels were first analyzed to assess the status of renal function in the CKD patients and were compared to hepcidin‐25 concentrations. As expected, creatinine levels were markedly increased in serum samples from CKD patients. As shown in Figure 2A, creatinine concentrations were significantly and directly correlated with hepcidin‐25 levels in CKD patients (R = 0.28, P = 0.004). Creatinine levels were then incorporated along with biometric data into the Cockroft–Gault equation for determining the eGFR 31 in CKD patients. The eGFR was then plotted against hepcidin‐25 concentrations in the CKD patients (Fig. 2B). As Figure 2B shows, there was a significant inverse correlation between serum hepcidin‐25 concentrations and eGFR in the CKD patients (R = −0.32, P = 0.001), indicating that hepcidin‐25 levels tended to increase as the eGFR decreased.
Figure 2.
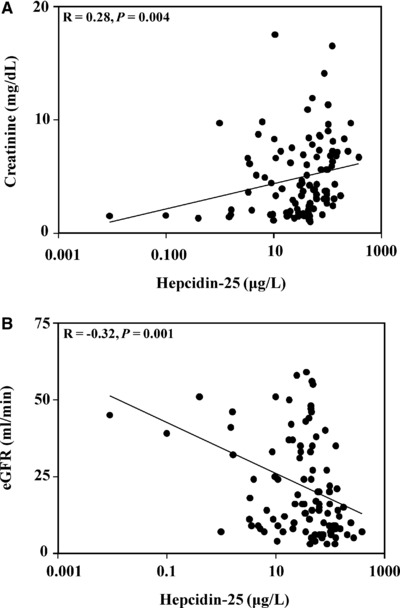
Relationship between hepcidin‐25, creatinine, and eGFR in patients with CKD. (A) Serum hepcidin‐25 and creatinine concentrations were compared in CKD patients. Hepcidin‐25 concentrations were directly correlated with creatinine levels (R = 0.28, P = 0.004). (B) Serum hepcidin‐25 concentrations and eGFR were compared in CKD patients. The two measures were significantly inversely correlated in the CKD patients (R = −0.32, P = 0.001).
One limitation of our current study is that we were unable to obtain iron supplementation data, transfusion histories, or records of ESA usage due to patient privacy restrictions around sample donation. It should be remembered, however, that iron supplementation, transfusions, and ESAs would all be expected to decrease hepcidin levels, which if anything should decrease the correlation of hepcidin‐25 to creatinine and eGFR. In spite of this limitation, we were still able to demonstrate significant correlations between hepcidin‐25 and eGFR and creatinine in the CKD patients.
In contrast, there was no significant correlation between hepcidin‐25 concentrations and BUN levels in the CKD patients (R = 0.08, P = 0.39). These results were not surprising, given that BUN can be influenced by multiple factors in CKD including altered tubular urea reabsorption and is, thus not a standard marker in the estimation of CKD stage.
We also analyzed the association between serum hepcidin‐25 levels and the hemoglobin concentration in patients with CKD. Figure 3 shows the relationship between hepcidin‐25 levels and hemoglobin concentrations in the CKD patients and demonstrates that there was no significant correlation between hepcidin‐25 concentrations and hemoglobin levels in patients regardless of CKD stage. It should be noted, however, that we were limited in our knowledge of CKD patient transfusion history, recombinant EPO (rhEPO) usage, and the use of other ESA treatments. Since both ESA usage as well as red cell transfusions would be expected to increase hemoglobin levels while lowering hepcidin‐25 concentrations 16, 33, 34, and thus disrupt any correlation between the two, this may explain why there was no significant correlation between hepcidin‐25 and hemoglobin concentrations in the CKD patients.
Figure 3.
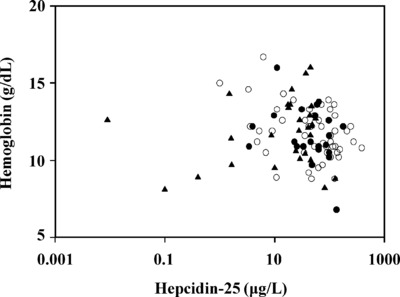
Comparison of hepcidin‐25 and hemoglobin in patients with CKD—serum hepcidin‐25 and blood hemoglobin concentrations were examined in patients with CKD. Results are plotted for patients with stage 5 CKD (open circles), stage 4 CKD (solid circles), and stage 3 CKD (solid triangles). There was no significant correlation between hepcidin‐25 and hemoglobin for any CKD stage (R = −0.14, P = 0.32 for stage 5; R = −0.33, P = 0.11 for stage 4; R = −0.12, P = 0.52 for stage 3).
We next compared hepcidin‐25 concentrations in the CKD patients to serum iron levels, transferrin, and ferritin. In the case of serum iron, as Figure 4A demonstrates, there was no significant correlation with hepcidin‐25 concentrations (R = 0.10, P = 0.31). In contrast, as shown in Figure 4B, hepcidin‐25 concentrations were inversely correlated with serum transferrin levels (R = −0.28, P = 0.004). As Figure 4C demonstrates, ferritin levels were markedly increased in patients with CKD, and hepcidin‐25 concentrations were highly and directly correlated with the ferritin values (R = 0.80, P < 0.001).
Figure 4.
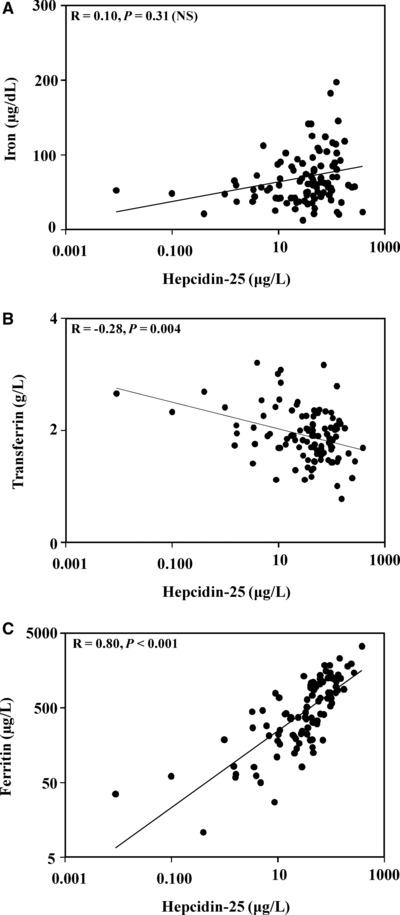
Relationship between hepcidin‐25 and iron, transferrin, and ferritin in patients with CKD. (A) Hepcidin‐25 and serum iron levels in CKD patients were compared. There was no significant correlation between the two (R = 0.10, P = 0.31). (B) Hepcidin‐25 and transferrin levels in CKD patients were compared. The two analytes were inversely correlated (R = −0.28, P = 0.004). (C) Hepcidin‐25 and serum ferritin levels in CKD patients were compared. Hepcidin‐25 was directly correlated with serum ferritin concentrations (R = 0.80, P < 0.001).
Finally, we investigated the relationship between age and hepcidin‐25 concentrations. Since most of the normal subjects that we measured hepcidin‐25 levels in were younger than the CKD patients, we wanted to rule out the possibility that a high correlation between hepcidin‐25 values and age could account for the large difference in hepcidin‐25 levels observed in the CKD patients vs. the normal subjects. As Figure 5A shows, there was no significant correlation between hepcidin‐25 concentrations and age in the normal subjects (R = −0.08, P = 0.40). Similarly, in the patients with CKD, there was also no significant correlation between age and hepcidin‐25 values (R = −0.11, P = 0.24), suggesting that the increased age of the patients with CKD did not account for the large increases in hepcidin‐25 levels compared to normal subjects.
Figure 5.
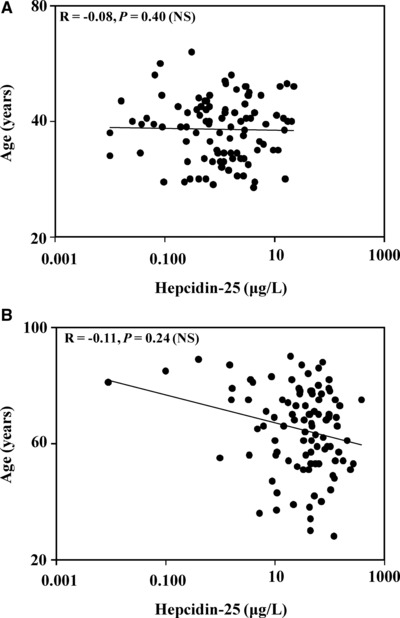
Comparison of age and hepcidin‐25 concentrations in normal subjects and in patients with CKD. (A) Hepcidin‐25 and age were compared in the normal subjects. There was no significant correlation between the two (R = −0.08, P = 0.40). (B) Hepcidin‐25 and age in CKD patients were compared. There was no significant correlation between the two (R = −0.11, P = 0.24).
DISCUSSION
In healthy individuals, diminished iron, hypoxia, and anemia decrease hepatic hepcidin synthesis and secretion in order to allow for sufficient iron export into the plasma to support erythropoiesis in the bone marrow 8. In CKD, however, patients often present with anemia also appear to have decreased erythropoiesis 2, 8. The results of our current study indicate that circulating concentrations of hepcidin‐25, the active form of the hormone, are markedly elevated in patients with CKD.
Our current data are consistent with similar findings using serum total hepcidin including competitive plasma hepcidin ELISA methods that utilize polyclonal hepcidin capture antibodies 16, 17, 35, 36. The importance of our current findings are highlighted by the fact that levels of inactive forms of hepcidin, such as hepcidin‐20 and hepcidin‐22, have been reported to be disproportionately increased in CKD, which can make data interpretation from immunoassays that react with multiple forms of hepcidin difficult 37. In contrast, our current data, which were generated using a specific sandwich assay for hepcidin‐25 30, show definitively that the active form of the hormone is markedly increased in CKD.
Creatinine is an established marker for determining renal function and GFR 31, 38. Within our CKD subject group, hepcidin‐25 concentrations showed significant direct correlation with creatinine and significant inverse correlation to eGFR. Our observations indicating that hepcidin‐25 levels were correlated with creatinine and eGFR differ somewhat from those of Peters et al., who previously reported that serum hepcidin‐25 levels in patients with CKD were independent of GFR 18. It is unclear why our results were different from those of Peters et al., but one possibility may be that the populations of CKD patients differed in the respective studies.
Contrary to the significant correlations with creatinine and eGFR, we did not observe any significant correlation between hepcidin‐25 and BUN in the CKD patients. Given the variables that can impact BUN, the lack of correlation with hepcidin‐25 is not surprising. Since urea concentrations can be influenced by several factors, including tubular urea reabsorption, BUN is typically not considered as reliable a marker for assessing renal function as creatinine 31, 38.
Recent reports have suggested a modest and significant correlation between hepcidin and hemoglobin 39, 40. While the samples from our CKD subject group collectively displayed low hemoglobin levels, we did not observe a significant correlation. Given that we did not have extensive information around patient transfusion, ESA usage, or intravenous iron administration, further studies would be necessary to better examine this relationship.
With regard to the correlation of hepcidin‐25 to other markers of iron metabolism, we found that hepcidin‐25 concentrations did not correlate with serum iron, were modestly correlated with transferrin, and highly correlated with serum ferritin levels, which themselves were markedly elevated in the CKD patients. The observation that ferritin levels are elevated in CKD patients and correlate with hepcidin‐25 levels suggests that the increased ferritin levels may be driving the increases in hepcidin‐25. Alternatively, it is also possible that the inability of the kidneys to clear hepcidin‐25 results in increases in circulating hepcidin‐25 that prevent iron export from tissues via ferroportin, thus resulting in increased tissue and ultimately serum ferritin.
In the present study, we have shown that CKD patients have markedly elevated hepcidin‐25 levels that are significantly correlated with well‐established markers of renal function including serum creatinine and eGFR. Further studies are clearly warranted to better understand the relationship between hepcidin‐25, iron status, red cell indices, and erythropoiesis in patients with diminished renal function.
ABBREVIATIONS
- BUN
blood urea nitrogen
- CKD
chronic kidney disease
- ELISA
enzyme‐linked immunosorbent assay
- ESRD
end‐stage renal disease
- EPO
erythropoietin
- ESA
erythropoiesis‐stimulating agent
- eGFR
estimated glomerular filtration rate
- MSD
MesoScale Discovery
- rhEPO
recombinant human erythropoietin
- TBST
Tris‐buffered saline plus Tween
ACKNOWLEDGMENTS
The authors thank Mark Willey for his technical assistance.
REFERENCES
- 1. Nicolas G, Bennoun M, Devaux I, et al. Lack of hepcidin gene expression and severe tissue iron overload in upstream stimulatory factor 2 (USF2) knockout mice. Proc Natl Acad Sci USA 2001;98:8780–8785. [DOI] [PMC free article] [PubMed] [Google Scholar]
- 2. Ganz T. Molecular control of iron transport. J Am Soc Nephrol 2007;18:394–400. [DOI] [PubMed] [Google Scholar]
- 3. De Domenico I, Ward DM, Langelier C, et al. The molecular mechanism of hepcidin‐mediated ferroportin down‐regulation. Mol Biol Cell 2007;18:2569–2578. [DOI] [PMC free article] [PubMed] [Google Scholar]
- 4. Nemeth E, Preza GC, Jung CL, Kaplan J, Waring AJ, Ganz T. The N‐terminus of hepcidin is essential for its interaction with ferroportin: Structure‐function study. Blood 2006;107:328–333. [DOI] [PMC free article] [PubMed] [Google Scholar]
- 5. Rivera S, Nemeth E, Gabayan V, Lopez MA, Farshidi D, Ganz T. Synthetic hepcidin causes rapid dose‐dependent hypoferremia and is concentrated in ferroportin‐containing organs. Blood 2005;106:2196–2199. [DOI] [PMC free article] [PubMed] [Google Scholar]
- 6. Nemeth E, Tuttle MS, Powelson J, et al. Hepcidin regulates cellular iron efflux by binding to ferroportin and inducing its internalization. Science 2004;306:2090–2093. [DOI] [PubMed] [Google Scholar]
- 7. Rivera S, Liu L, Nemeth E, Gabayan V, Sorensen OE, Ganz T. Hepcidin excess induces the sequestration of iron and exacerbates tumor‐associated anemia. Blood 2005;105:1797–1802. [DOI] [PubMed] [Google Scholar]
- 8. Nicolas G, Chauvet C, Viatte L, et al. The gene encoding the iron regulatory peptide hepcidin is regulated by anemia, hypoxia, and inflammation. J Clin Invest 2002;110:1037–1044. [DOI] [PMC free article] [PubMed] [Google Scholar]
- 9. Fleming RE, Sly WS. Hepcidin: A putative iron‐regulatory hormone relevant to hereditary hemochromatosis and the anemia of chronic disease. Proc Natl Acad Sci USA 2001;98:8160–8162. [DOI] [PMC free article] [PubMed] [Google Scholar]
- 10. Roetto A, Papanikolaou G, Politou M, et al. Mutant antimicrobial peptide hepcidin is associated with severe juvenile hemochromatosis. Nat Genet 2003;33:21–22. [DOI] [PubMed] [Google Scholar]
- 11. Gehrke SG, Kulaksiz H, Herrmann T, et al. Expression of hepcidin in hereditary hemochromatosis: Evidence for a regulation in response to the serum transferrin saturation and to non‐transferrin‐bound iron. Blood 2003;102:371–376. [DOI] [PubMed] [Google Scholar]
- 12. Griffiths WJ. Review article: The genetic basis of haemochromatosis. Aliment Pharmacol Ther 2007;26:331–342. [DOI] [PubMed] [Google Scholar]
- 13. Malyszko J, Mysliwiec M. Hepcidin in anemia and inflammation in chronic kidney disease. Kidney Blood Press Res 2007;30: 15–30. [DOI] [PubMed] [Google Scholar]
- 14. Theurl I, Mattle V, Seifert M, Mariani M, Marth C, Weiss G. Dysregulated monocyte iron homeostasis and erythropoietin formation in patients with anemia of chronic disease. Blood 2006;107:4142–4148. [DOI] [PubMed] [Google Scholar]
- 15. Grotto HZ. Anaemia of cancer: An overview of mechanisms involved in its pathogenesis. Med Oncol 2008;25:12–21. [DOI] [PubMed] [Google Scholar]
- 16. Ashby DR, Gale DP, Busbridge M, et al. Plasma hepcidin levels are elevated but responsive to erythropoietin therapy in renal disease. Kidney Int 2009;75:976–981. [DOI] [PubMed] [Google Scholar]
- 17. Zaritsky J, Young B, Wang HJ, et al. Hepcidin—A potential novel biomarker for iron status in chronic kidney disease. Clin J Am Soc Nephrol 2009;4:1051–1056. [DOI] [PMC free article] [PubMed] [Google Scholar]
- 18. Peters HP, Laarakkers CM, Swinkels DW, Wetzels JF. Serum hepcidin‐25 levels in patients with chronic kidney disease are independent of glomerular filtration rate. Nephrol Dial Transplant;25:848–853. [DOI] [PubMed] [Google Scholar]
- 19. Kroot JJ, Kemna EH, Bansal SS, et al. Results of the first international round robin for the quantification of urinary and plasma hepcidin assays: Need for standardization. Haematologica 2009;94:1748–1752. [DOI] [PMC free article] [PubMed] [Google Scholar]
- 20. Nemeth E, Valore EV, Territo M, Schiller G, Lichtenstein A, Ganz T. Hepcidin, a putative mediator of anemia of inflammation, is a type II acute‐phase protein. Blood 2003;101:2461–2463. [DOI] [PubMed] [Google Scholar]
- 21. Roe MA, Spinks C, Heath AL, et al. Serum prohepcidin concentration: No association with iron absorption in healthy men; and no relationship with iron status in men carrying HFE mutations, hereditary haemochromatosis patients undergoing phlebotomy treatment, or pregnant women. Br J Nutr 2007;97: 544–549. [DOI] [PubMed] [Google Scholar]
- 22. Brookes MJ, Sharma NK, Tselepis C, Iqbal TH. Serum pro‐hepcidin: Measuring active hepcidin or a non‐functional precursor? Gut 2005;54:169–170. [DOI] [PMC free article] [PubMed] [Google Scholar]
- 23. Hadley KB, Johnson LK, Hunt JR. Iron absorption by healthy women is not associated with either serum or urinary prohepcidin. Am J Clin Nutr 2006;84:150–155. [DOI] [PubMed] [Google Scholar]
- 24. Kato A, Tsuji T, Luo J, Sakao Y, Yasuda H, Hishida A. Association of prohepcidin and hepcidin‐25 with erythropoietin response and ferritin in hemodialysis patients. Am J Nephrol 2008;28:115–121. [DOI] [PubMed] [Google Scholar]
- 25. Kroot JJ, Laarakkers CM, Geurts‐Moespot AJ, et al. Immunochemical and mass‐spectrometry‐based serum hepcidin assays for iron metabolism disorders. Clin Chem 2010;56:1570–1579. [DOI] [PubMed] [Google Scholar]
- 26. Park CH, Valore EV, Waring AJ, Ganz T. Hepcidin, a urinary antimicrobial peptide synthesized in the liver. J Biol Chem 2001;276:7806–7810. [DOI] [PubMed] [Google Scholar]
- 27. Krause A, Neitz S, Magert HJ, et al. LEAP‐1, a novel highly disulfide‐bonded human peptide, exhibits antimicrobial activity. FEBS Lett 2000;480:147–150. [DOI] [PubMed] [Google Scholar]
- 28. Valore EV, Ganz T. Post‐translational processing of hepcidin in human hepatocytes is mediated by the prohormone convertase furin. Blood Cells Mol Dis 2008;40:132–138. [DOI] [PMC free article] [PubMed] [Google Scholar]
- 29. Peters HP, Laarakkers CM, Wetzels JF, Swinkels DW. Hepcidin levels in patients with renal disease. Kidney Int 2009;76:680–681. [DOI] [PubMed] [Google Scholar]
- 30. Butterfield AM, Luan P, Witcher DR, et al. A dual‐monoclonal sandwich ELISA specific for hepcidin‐25. Clin Chem 2010;56:1725–1732. [DOI] [PubMed] [Google Scholar]
- 31. Gault MH, Longerich LL, Harnett JD, Wesolowski C. Predicting glomerular function from adjusted serum creatinine. Nephron 1992;62:249–256. [DOI] [PubMed] [Google Scholar]
- 32. Ganz T, Olbina G, Girelli D, Nemeth E, Westerman M. Immunoassay for human serum hepcidin. Blood 2008;112:4292–4297. [DOI] [PubMed] [Google Scholar]
- 33. Ashby DR, Gale DP, Busbridge M, et al. Erythropoietin administration in humans causes a marked and prolonged reduction in circulating hepcidin. Haematologica 2010;95:505–508. [DOI] [PMC free article] [PubMed] [Google Scholar]
- 34. Pak M, Lopez MA, Gabayan V, Ganz T, Rivera S. Suppression of hepcidin during anemia requires erythropoietic activity. Blood 2006;108:3730–3735. [DOI] [PMC free article] [PubMed] [Google Scholar]
- 35. Taes YE, Wuyts B, Boelaert JR, De Vriese AS, Delanghe JR. Prohepcidin accumulates in renal insufficiency. Clin Chem Lab Med 2004;42:387–389. [DOI] [PubMed] [Google Scholar]
- 36. Malyszko J, Malyszko JS, Pawlak K, Mysliwiec M. Hepcidin, iron status, and renal function in chronic renal failure, kidney transplantation, and hemodialysis. Am J Hematol 2006;81:832–837. [DOI] [PubMed] [Google Scholar]
- 37. Kroot JJ, Tjalsma H, Fleming RE, Swinkels DW. Hepcidin in human iron disorders: Diagnostic implications. Clin Chem 2011;57:1650–1669. [DOI] [PubMed] [Google Scholar]
- 38. Levey AS, Bosch JP, Lewis JB, Greene T, Rogers N, Roth D. A more accurate method to estimate glomerular filtration rate from serum creatinine: A new prediction equation. Modification of Diet in Renal Disease Study Group. Ann Intern Med 1999;130:461–470. [DOI] [PubMed] [Google Scholar]
- 39. Detivaud L, Nemeth E, Boudjema K, et al. Hepcidin levels in humans are correlated with hepatic iron stores, hemoglobin levels, and hepatic function. Blood 2005;106:746–748. [DOI] [PubMed] [Google Scholar]
- 40. Origa R, Galanello R, Ganz T, et al. Liver iron concentrations and urinary hepcidin in beta‐thalassemia. Haematologica 2007;92:583–588. [DOI] [PubMed] [Google Scholar]