

Abstract
Background
Dendritic cells (DCs) and cytokines play an important role in the tumor growth and recurrence.
Methods
Sixty‐six patients with superficial transitional cell carcinoma of the bladder (STCCB) and 38 healthy controls were studied to investigate the percentages of DC subsets, monocyte‐derived DC (MoDC) function, and alterations of Th1 and Th2 cytokines. MoDCs were generated and three‐color flow cytometry was used for determining the phenotype of MoDCs and DC subsets. The ability to stimulate autologous T cells was tested in mixed leukocyte reaction (MLR). The levels of various cytokines were measured using commercially available sandwich enzyme linked immunosorbent assay (ELISA) kit.
Results
The myeloid DC (mDC) counts, MoDC surface molecular expression, and stimulatory capacity to T cells were impaired in STCCB patients than in controls. The percentage of mDC and the expression of CD80, CD83, and CD86 were lower in patients showing recurrence. The serum levels of IL‐2 and IFN‐γ were found to be significantly lower while IL‐4, IL‐6, and IL‐10 were significantly higher in STCCB patients than in controls. IL‐6 was found to be significantly higher in recurrent patients.
Conclusion
The impairment of mDC counts and MoDC function with imbalance of Th1/Th2 cytokines was closely associated with proliferation and recurrence of STCCB. J. Clin. Lab. Anal. 26:365‐371, 2012. © 2012 Wiley Periodicals, Inc.
Keywords: dendritic cells, subset, cytokines, superficial transitional cell carcinoma of the bladder, recurrence
INTRODUCTION
Superficial transitional cell carcinoma of the bladder (STCCB) constitutes 90–95% of urothelial tumors with recurrence rate of 30–90% 1, 2, 4. Approximately 80% of STCCB has a local recurrence 3, 4, effective treatment of the STCCB has been the focus of oncology researches.
Earlier reports had shown that bladder cancer patients were immunodeficient 5, 6. This immunodeficiency manifests as impaired cell‐mediated and humoral immunity. Control of tumor growth and recurrence presents a difficult problem for the host immune system. Researchers have interests about this tumor, but the role of immunological dysfunction has not been well elucidated for progression and recurrence of STCCB. Although majority of STCCB can be diagnosed at an early stage and removed easily by transurethral resection (TUR), the management of this disease is complicated due to frequent recurrences. Some researches aim to develop efficient immunotherapy to stimulate an anti‐tumor immune response. In this context, one approach toward developing an effective immunotherapeutic regime for STCCB may be through the manipulation of antigen‐presenting cells (APC), such as DCs. DCs are the strongest functional APC, which can directly activate the naive T cells. They are also capable of promoting the generation of helper T cells and cytotoxic T cells, which is the primary link in initiation, control, and maintenance of immunological responses 7, 8. The human peripheral DCs are classified into two subsets: myeloid DC (mDC) and plasmacytoid DC (pDC), based on their origins, phenotypes, and functions. It has been suggested that mDCs primarily induce Th1 differentiation, whereas pDCs mainly promote Th2 response 9, 10. The mDCs are effective T‐cell stimulators, inducing a tumor‐specific immune response. However, the function of pDCs is uncertain 11, 12. Many studies have indicated that in tumor microenvironment, DCs both decrease in quantity and are impaired in function than in healthy donors 13, 14, 15. However, little is known about the frequency or function of the two DC subsets in STCCB patients.
Cytokines play a pivotal role in the induction of cell‐mediated and humoral immunity. Cytokines secreted by tumors and immune cells can either promote tumor development and induce tumor escape immune surveillance or exert antitumor effects. According to the cytokine profile, the immune responses have been classified into two functionally distinct CD4+ T cell subsets. The cytokines produced by the Th1 and Th2 cell subsets are important for the immune function. Th1 cells produce type 1 cytokines, such as IL‐2 and IFN‐γ, which exert potent antitumor effects and activate cytotoxic lymphocyte (CTL) mediated and natural killer (NK) mediated cytolytic functions associated with effective antitumor defense mechanisms. Th2‐type cytokines such as IL‐4, IL‐6, IL‐10 could downregulate tumor‐specific immune response by directly suppressing Th1 cytokines production, thereby preventing activation of CTLs and NK cells, and by inhibiting tumor antigen presentation by APC 6, 16. Tumor cells can also manipulate DC subsets distributions and impair tumor immunity by secreting inhibitory cytokines such as IL‐4, IL‐10, IL‐6, vascular endothelial growth factor (VEGF), etc. 6, 9, 11, 12. These cytokines may directly or indirectly affect the function of DCs. Thus, quantification of cytokine response in cancer patients can give significant insights about the cellular immunologic potency against the tumor cells.
In this study, we investigated the changes of frequency of DC subsets and function of monocyte‐derived DCs (MoDCs) in 66 STCCB patients who were treated with TUR. We also investigated the levels of the cytokines IL‐2, IL‐4, IL‐6, IL‐10, and IFN‐γ in serum to examine the claim that the low proportion and impaired function of DC subsets from STCCB patients correlates with imbalance of Th1/Th2 cytokines in their serum and whether these changes have a relationship with tumor recurrence.
MATERIAL AND METHODS
Patients and Healthy Controls
Sixty‐six patients with pathologically confirmed STCCB and 38 healthy controls formed the study group. The study was approved by the ethical committee of Beijing Friendship Hospital affiliated to Capital Medical University. A written informed consent was obtained from each individual. Of the 66 patients, there were 47 men and 19 women ranging in age group from 42 to 79 years (mean ± SD, 64.73 ± 9.41), whereas healthy controls including 26 men and 12 women had a mean age of 58.53 ± 12.93 years. All patients with tumors are at stage Ta or T1 in this study. The patient and controls were of similar socioeconomic status. None of the patients had any other significant disease or malignancies except bladder cancer, and only the newly diagnosed patients with no prior chemotherapeutic or surgery treatment were included in this study. The exclusion criteria were suffering from any inflammatory or chronic disease such as diabetes, autoimmune disorders, or acute infections at the time of sampling. Blood samples were collected 1 day before surgery. TUR of tumor was followed by adjuvant intravesical chemotherapy. Patients were followed up every third month for duration of 6 months–2 years (median follow‐up of 15.4 months) with urine cytology, cystoscopy, and cystoscopic biopsy in case of recurrence. Twenty‐six patients among this group showed recurrence of tumor within 6–18 months of follow‐up (recurrence group) and the remaining 40 patients remained recurrence free throughout the follow‐up period (nonrecurrence group).
Flow Cytometry Analysis
The DCs were determined by three‐color flow cytometric analysis using monoclonal antibodies (mAbs), which were directly conjugated to fluorescein isothiocyanate (FITC), R‐phycoerythrin (PE), or PE cyanin 5 (PE‐Cy5). FITC‐conjugated lineage cocktail 1 (Lin1), containing anti‐CD3, anti‐CD14, anti‐CD16, anti‐CD19, anti‐CD20, and anti‐CD56 was purchased from BD Biosciences (San Diego, CA). PE‐conjugated anti‐human CD11c, PE‐conjugated anti‐human CD123, and PE‐Cy5‐conjugated anti‐human HLA‐DR were obtained from Biolegend. In addition, FITC‐conjugated CD83 was used for detecting DC maturation, PE‐conjugated CD80 and PE‐conjugated CD86 were used for detecting expression of costimulating molecules (Biolegend, San Diego, California). Respective mouse IgG1, IgG2a isotype matched controls (BD Biosciences) were used for negative controls in this study.
Following venous blood collection into 0.2% EDTA containing vacuum tubes, the blood samples were sent to three‐color flow cytometry. Cells were incubated with a mixture of mAbs for 30 min at room temperature in the dark. FACS lysing solution (BD Bioscience) was used to remove the red blood cells. After centrifugation, 2 ml of PBS was added, containing 0.1% FCS and 0.1% NaN3, to wash the precipitation, then cells were resuspended with 300 ml of 1% paraformaldehyde (PFA, Sigma, Germany). Samples were stored at 2–8°C in the dark for up to 6 hr before analysis. At least 50,000 events were acquired for each sample. The mDCs and pDCs in peripheral blood were identified by the expression of PE‐conjugated CD11c and CD123 among lineage‐negative HLA‐DR positive cells, respectively. Acquired data were analyzed using the CellQuest program. The numbers of DC subsets were expressed as the percentage of the total leukocytes.
Generation of DCs from Monocytes
DCs were generated from a peripheral mononuclear fraction isolated by centrifugation of cell suspensions layered on Ficoll‐Hypaque (Pharmacia, Sweden). Peripheral Blood Mononuclear Cells (PBMCs) were washed and supplemented in serum‐free RPMI 1640 (GIBCO, Carlsbad, CA). After incubation for 2 hr at 37°C in 5% CO2, nonadherent cells were removed and preserved for further experiments. The adherent cells containing monocytes were cultured for 5 days in RPMI 1640 containing heat‐inactivated 10% fetal calf serum, 2 mL glutamine, 100 U/ml penicillin, and 100 U/ml streptomycin, supplemented with GM‐CSF (500 IU/ml) and IL‐4 (500 IU/ml) (PeproTech, UK). On day 3 and 5, half of the culture medium was replaced with fresh medium containing GM‐CSF and IL‐4. For maturation, DCs were cultured for an additional 2 days in complete medium supplemented with GM‐CSF, IL‐4, TNF‐a (50 ng/ml, PeproTech). After 7 days of culture, MoDCs were defined as large granular cells by microscopy.
Expression of Cell Surface Molecules on MoDCs
Matured MoDCs were collected on the eighth day. Then MoDCs were washed with PBS containing 0.5% bovine serum albumin (PBA) and incubated with directly conjugated mAbs: lineage cocktail, HLA‐DR, CD80, CD83, and CD86 for 30 min at room temperature in the dark. As a control, cells stained with the corresponding isotype matched control mAbs were used. Cells were washed once with PBS and resuspended with 300 ml of 1% PFA. Then the cells were analyzed on a flow cytometer.
Capacity of MoDCs to Induce Autologous T‐Cell Proliferation
The allostimulatory function of MoDCs was examined by mixed leukocyte reaction (MLR). After washing, DCs were cocultured with autologous lymphocytes at a DC: lymphocytes ratio of 1:10 in 200 ml of complete medium in 96‐well culture plates (Corstar). Triplicate cultures were maintained for 4 days at 37°C in 5% CO2. Medium was supplemented with IL‐2 (PeproTech) 4 ng per well on day 2 to allow antigen‐specific T cells to grow. T cells incubated in medium with equal IL‐2 alone served as control. The cells were pulsed with 0.5 μCi of 3H‐thymidine during the last 16 hr of the culture period. Then cells were harvested onto glass fiber filters using an automated harvester, and cell‐bound radioactivity was counted in a liquid scintillation counter. The stimulatory activity was calculated by dividing the counts per minute (c.p.m).
Cytokine Determinations with ELISA
Concentrations of serum IL‐2, IL‐4, IL‐6, IL‐10, and IFN‐γ were measured by ELISA, according to the instructions on the reagent kit (BD Biosciences). The assay sensitivities for IL‐2, IL‐4, IL‐6, IL‐10, and IFN‐γ are 1 pg/ml, 2 pg/ml, 2 pg/ml, 19pg/ml, and 1 pg/ml, respectively.
Statistical Analysis
Data were described as mean ± SD. Statistical analysis was performed by Analysis of Variance (ANOVA) with Bonferroni modification. Differences were considered significant when P values < 0.05.
RESULTS
Percentage of Dendritic Cell Subsets in STCCB Patients and Healthy Controls
The percentages of mDCs and pDCs in peripheral blood are described in Figure 1. As the figure shown, mDCs represented 0.103 ± 0.066% in STCCB patients and these values were significantly lower than the 0.203 ± 0.04% in healthy controls (P < 0.001). Besides, pDCs represented 0.076 ± 0.050% in STCCB patients and 0.087 ± 0.021% in healthy controls. There is no significant difference between the two groups (P = 0.228).
Figure 1.
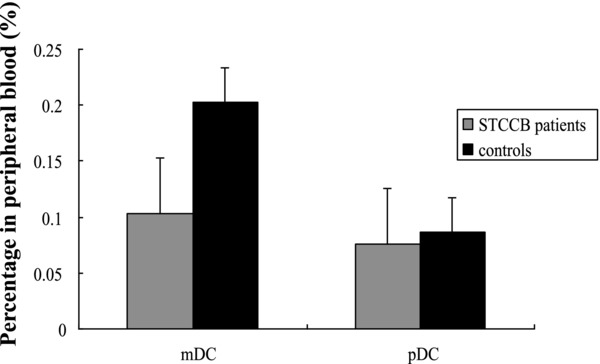
Comparison of DC subsets in STCCB patients and healthy controls. The percentages of mDCs in STCCB patients were significantly lower than those in healthy controls (P < 0.001), while the percentages of pDCs were matched between the two groups.
Phenotype and Capacity of T‐Cell Proliferation of MoDCs in STCCB Patients and Healthy Controls
We analyzed the expression of surface antigen on MoDCs in patients and controls. Significantly lower expressions of CD80, CD83, CD86, and HLA‐DR were seen in STCCB patients than in healthy controls (see Table 1; the data shown as means ± SD, P < 0.05). We assessed the potency of MoDCs prepared from STCCB patients and healthy controls in a standard MLR. MoDCs of STCCB patients were significantly less efficient in inducing T‐cell proliferation than MoDCs isolated and cultured from healthy controls (P < 0.001).
Table 1.
Expression of Surface Molecules on MoDCs and Capacity of MLR in STCCB Patients and Controls
| Group | CD80 | CD83 | CD86 | HLA‐DR | MLR. Capacity |
|---|---|---|---|---|---|
| STCCB patients | 33.8 ± 7.5 | 58.2 ± 10.5 | 41.8 ± 11.9 | 60.2 ± 6.8 | 1,386.3 ± 721.4 |
| Healthy controls | 42.9 ± 10.4 | 69.6 ± 7.0 | 52.9 ± 14.9 | 79.4 ± 5.1 | 2,458.9 ± 875.2 |
| P value | 0.028 | 0.004 | 0.034 | 0.002 | <0.001 |
Cytokine Levels in STCCB Patients and Healthy Controls
The mean value of IFN‐γ and IL‐2 were significantly reduced (P < 0.001) in STCCB patients (2.36 ± 1.24 pg/ml and 3.62 ± 1.89 pg/ml) compared with healthy controls (7.67 ± 1.19 pg/ml and 6.55 ± 1.88 pg/ml). Significantly enhanced values of IL‐4, IL‐6, and IL‐10 were observed in STCCB patients (10.42 ± 3.20, 20.57 ± 10.34, and 36.29 ± 13.89 pg/ml) compared with healthy controls (5.68 ± 2.03, 11.38 ± 7.26, and 25.12 ± 9.58 pg/ml) (P < 0.05; see Table 2).
Table 2.
Cytokine Levels (pg/ml) in STCCB Patients and Healthy Controls
| Cytokines levels | STCCB (n = 66) | normal (n = 48) | P value |
|---|---|---|---|
| IL‐2 (pg/ml) | 3.62 ± 1.89 | 6.55 ± 1.88 | <0.001 |
| IL‐4 (pg/ml) | 10.42 ± 3.20 | 5.68 ± 2.03 | <0.001 |
| IL‐6 (pg/ml) | 20.57 ± 10.34 | 11.38 ± 7.26 | <0.001 |
| IL‐10 (pg/ml) | 36.29 ± 13.89 | 25.12 ± 9.58 | 0.036 |
| IFN‐γ (pg/ml) | 2.36 ± 1.24 | 7.67 ± 1.19 | <0.001 |
Comparison of DC Subsets and Cytokine Levels between Patients with Recurrence and Nonrecurrence
Patients were followed up every third month for duration of 6 months–2 years. Twenty‐six patients among this group showed recurrence (recurrence group) and the remaining 40 patients remained recurrence free throughout the follow‐up period (nonrecurrence group). The percentage of mDCs in the recurrence group (0.089 ± 0.052%) was lower than that in the nonrecurrence group (0.105 ± 0.074%), but the difference was not statistically significant (P = 0.089), the percentages of pDCs within the two groups were similar (0.072 ± 0.039% and 0.078 ± 0.055%, P = 0.546) (see Fig. 2). The expression of CD80, CD83, and HLA‐DR in the recurrence group was significantly lower than that in the nonrecurrence group (P < 0.05). The value of CD86 was matched between the two groups (P = 0.088). The MLR capacity of MoDCs in recurrence group was lower than that in nonrecurrence group, but the difference had no statistic significance (P = 0.061) (see Table 3). IL‐6 was found to be significantly higher in recurrent patients than in nonrecurrent patients (P = 0.027) while no significant difference for other cytokines (P > 0.05) (see Table 4).
Figure 2.
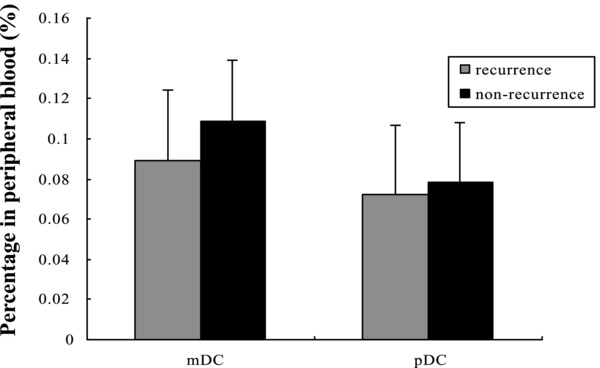
Comparison of DC subsets in recurrence and nonrecurrence patients. The percentages of mDCs in STCCB patients showing recurrence were lower than those in nonrecurrence patients (P = 0.089), the percentages of pDCs were matched between the two groups (P = 0.546).
Table 3.
Expression of Surface Molecules on MoDCs and Capacity of MLR in Recurrence and Nonrecurrence Patients
| STCCB Group | CD80 | CD83 | CD86 | HLA‐DR | MLR. Capacity |
|---|---|---|---|---|---|
| Recurrence | 29.1 ± 8.1 | 51.6 ± 10.7 | 38.5 ± 11.6 | 54.5 ± 7.2 | 998.3 ± 864.5 |
| Nonrecurrence | 39.1 ± 5.7 | 69.5 ± 7.9 | 43.7 ± 12.1 | 68.7 ± 4.4 | 1,125.6 ± 987.2 |
| P value | 0.033 | 0.032 | 0.088 | 0.027 | 0.061 |
Table 4.
Cytokine Levels in Recurrence and Nonrecurrence Patients
| Cytokines levels | recurrence (n = 26) | nonrecurrence (n = 40) | P value |
|---|---|---|---|
| IL‐2 (pg/ml) | 3.22 ± 1.56 | 3.57 ± 1.43 | 0.676 |
| IL‐4 (pg/ml) | 11.72 ± 3.85 | 10.98 ± 3.73 | 0.889 |
| IL‐6 (pg/ml) | 26.17 ± 7.26 | 18.83 ± 5.96 | 0.027 |
| IL‐10 (pg/ml) | 33.29 ± 12.16 | 30.62 ± 9.54 | 0.578 |
| IFN‐γ (pg/ml) | 2.76 ± 1.04 | 3.47 ± 1.69 | 0.657 |
DISCUSSION
The cancer immunoregulation hypothesis combines two fundamental concepts of tumor immunology: immunosurveillance and tumor immune escape to generate a microenvironment of tumor tolerance and result in tumor proliferation or recurrence. It has been well established that malignant cells are able to escape immune surveillance with various strategies, one of the strategies is represented by professional APC defection 17, also the production and secretion of soluble factors capable of interfering with the function of the various immune cell population involved in mounting specific antitumor response appears to be a major mechanism 6. Human DCs are phenotypically and functionally heterogeneous. At the same time, DCs generated from peripheral blood monocytes are mainly regarded as APCs involved in the initiation and regulation of antigen‐specific immune responses. The ability to identify and enumerate DCs subsets, evaluate DCs function and cytokines in the peripheral circulation of cancer patients appears to be fundamental for the understanding of the role of these immune components in the host antitumor response.
This study focused on the quantification of circulating DC subsets and functional evaluation of MoDCs in STCCB patients. The main findings showed that the number of circulating mDCs was decreased compared with those of healthy controls. The expression of surface molecules and the ability to proliferate autologous T lymphocytes of MoDCs in STCCB patients were significantly lower than that of healthy controls. These are in agreement with other studies 15, 18, 19. It is well known that DCs in many tumors are functionally compromised 10. This impairment might be due to the production of immunosuppressive factors by the tumor, such as transforming growth factor‐β (TGF‐β), IL‐10, VEGF, or prostaglandin E2 (PGE‐2), which caused the failure of expression of the costimulating molecular CD80 and CD86 20, 21, 22, 23. In addition, it has been suggested that malignant cells prevent the differentiation of stem cells into DCs 24 and induce apoptosis of DCs 25. The decrease of mDCs number may result in the defection of the antitumor immune response, and the low expression of costimulating molecular and efficiency of T‐cell proliferation thus correlates with tumor burden.
This study indicates that in STCCB patients decreased numbers of mDCs correlate with disease prognosis. The percentage of mDCs and function of MoDCs were decreased in patients showing recurrent as compared with those in nonrecurrent patients. The decrease of counts and function in circulating DCs may have functional consequences on the production of cytokines and on antigen presentation to naive T‐cells, which will lead to the impairment of host immunosurveillance and enhance tumor tolerance, thus resulting in tumor recurrence.
The Th1/Th2 cytokines have functions in regulating cancer immunological response. Evidence has accumulated that cancer patients have an imbalance in the Th1/Th2 axis, with the latter predominating over the former 6, 26. In our study, the serum levels of IL‐2 and IFN‐γ were found to be significantly lower while levels of IL‐4, IL‐6, and IL‐10 were significantly higher in STCCB patients than in controls. The imbalance observed in this study is in accordance with other reports 6, 26. Several studies 6, 9, 12 have demonstrated the effects of individual tumor‐derived or tumor‐induced cytokines on DC function as they relate to the immune response to malignant tumors. These changes of cytokines may be correlated with circulating DC subsets in STCCB patients, indicating a possible effect of these cytokines on DCs.
IFN‐γ can prevent bladder tumor proliferation as well as upregulate the expression of major histocompatibility complex class I and II antigens and adhesion molecules on bladder cancer cells following tumor resection 27. Also, IFN‐γ is able to induce the expression of Fas receptor on bladder cancer cells, providing a mechanism for apoptotic destruction by Fas ligand positive activated T cells 6. IL‐2 mediates its antitumor activity through complex indirect effects on the immune system. In a study done by Kaempfer et al. 28 in bladder cancer patients, it was shown that patients whose lymphocytes show a depressed ability to make IL‐2 mRNA have poor clinical response. In our study, the results of lower levels of Th1‐type cytokines (IFN‐γ and IL‐2) could decrease the probability of tumor cell antigen to be presented by DCs and recognized by the CD4+ T cells or CD8+ cytotoxic T lymphocytes, which might be responsible for augmented proliferation of bladder tumor cells. On the other hand, the decrease of mDCs will depress Th1 differentiation, which might decrease the secretion of Th1‐type cytokines. The interaction may impair the antitumor immune response further, and thus result in the tumor growth.
Early study had indicated that IL‐4 can downregulates IL‐2 production 29 by the inhibition of IL‐2 gene transcription. The IL‐4‐dependent mechanism by which CD8+ cytolytic response can be turned into noncytolytic ones 30, which probably allows the pathogen to escape elimination. Ectopic production of IL‐4 by tumor cells can influence hierarchical immunosuppression most profoundly seen in cancer patients. This can affect the type of immune response at either the local or systemic level. IL‐10 has a variety of suppressive effects that include inhibiting Th1 cytokine production, downregulating APC function, and lowering overall T‐cell proliferation. High IL‐10 levels have been detected in serum from patients with variety of tumors 31, 32. IL‐10 production contributes to malignant tumor cell survival by generating a microenvironment conducive to tumor growth and metastases. IL‐6 is closely related to the invasion and metastasis of cancer, which might play pivotal but opposing roles in the host tumor interaction that, together with other immunoregulation components, determines the outcome for the development of local tumor immunity 33. High IL‐6 levels have been detected in serum from colorectal cancer patients and shown the poor prognosis 34. Our study indicated that high levels of Th2 cytokines might have immunosuppression function in STCCB patients by suppressive effects on Th1 cytokines or inhibiting DCs function, or both together, which might result in tumor proliferation and recurrence.
Although early studies had shown the dysfunction on DCs or serum cytokines in tumor patients, most of them only focus on one of the two aspects. This study had indicated that the defect in circulating DC from STCCB patients could, at least in part, be the result of decreased frequency of mDCs with poor APC function, and cytokines may have an effect on circulating DCs. In the microenvironment of tumor patients, various sorts of immune factors may have the influence on immune status. A recent research from Eruslanov 35 had shown that the number of circulating inflammatory myeloid cells in bladder cancer patients was increased when compared to healthy individuals. These activated cells were found to be immunosuppressive and were able to inhibit in vitro T‐cell proliferation. They also produced substantial amounts of proinflammatory chemokines/cytokines and may contribute to immune dysfunction in bladder cancer. Our results were similar to theirs. We can see that in the microenvironment of bladder cancer, various immune factors may influence the immune status. The imbalance of APC, inflammatory myeloid cells, and cytokines may possibly result in the bladder tumor proliferation and recurrence. However, further study should be conducted to investigate the relationship between all these cells and chemokines/cytokines. From our results, we showed that the investigation of the variation of DCs subsets and Th cytokines are definitively helpful for further study on mechanisms of immunodeficiency in patient with STCCB. Increasing the mDC amount may improve the antigen‐presenting ability of APC and in combination with Th1‐type cytokine for immunotherapy of bladder cancer could potentially boost the clinical efficacy and reduce tumor recurrence.
REFERENCES
- 1. Sylvester RJ, van der Meijden AP, Oosterlinck W, et al. Predicting recurrence and progression in individual patients with stage Ta T1 bladder cancer using EORTC risk tables: A combined analysis of 2596 patients from seven EORTC trials. Eur Urol 2006;49:475–477. [DOI] [PubMed] [Google Scholar]
- 2. Akagashi K, Tanda H, Kato S, et al. Recurrence pattern for superficial bladder cancer. Int J Urol 2006;13:686–691. [DOI] [PubMed] [Google Scholar]
- 3. Tomoe H, Masumi S, Atsuko O, et al. A possible mechanism of intravesical BCG therapy for human bladder carcinoma: Involvement of innate effector cells for the inhibition of tumor growth. Cancer Immunol Immunother 2009;58:1245–1255. [DOI] [PMC free article] [PubMed] [Google Scholar]
- 4. Thomas CY, Theodorescu D. Molecular markers of prognosis and novel therapeutic strategies for urothelial cell carcinomas. World J Urol 2006;24(5):565–578. [DOI] [PubMed] [Google Scholar]
- 5. Metts MC, Metts JC, Milito SJ, et al. Bladder cancer: A review of diagnosis and management. J Natl Med Assoc 2000;92:285–294. [PMC free article] [PubMed] [Google Scholar]
- 6. Agarwal A, Agrawal U, Verma S, et al. Serum Th1 and Th2 cytokine balance in patients of superficial transitional cell carcinoma of bladder pre‐ and post‐intravesical combination immunotherapy. Immunopharmacol Immunotoxicol 2010;32(3):348–356. [DOI] [PubMed] [Google Scholar]
- 7. Wang Y, Whittall T, McGowan E,et al. Identification of stimulating and inhibitory epitopes within the heat shock protein 70 molecule that modulate cytokine production and maturation of dendritic cells. J Immunology 2010;174(6):3306–3316. [DOI] [PubMed] [Google Scholar]
- 8. Yilmaz A, Reiss C, Weng A, et al. Differential effects of statins on relevant functions of human monocyte‐derived dendritic cells. J Leukoc Biol 2006;79:529–538. [DOI] [PubMed] [Google Scholar]
- 9. Ishikawa M, Nishioka M, Hanaki N, et al. Hepatic resection leads to predominance of the T‐helper‐2 lymphocyte phenotype. Hepatol Res 2004;30(2):96–103. [DOI] [PubMed] [Google Scholar]
- 10. Leonie M, van Duivenvoorde, Wanda G, et al. Immunomodulatory dendritic cells inhibit Th1 responses and arthritis via different mechanisms. J Immunol 2007;179:1506–1515. [DOI] [PubMed] [Google Scholar]
- 11. Novotny AR, Emmanuel K, Ulm K, et al. Blood interleukin 12 as preoperativepredictor of fatalpostoperative sepsis after neoadjuvant radiochemotherapy. Br J Surg 2006;93:1283–1289. [DOI] [PubMed] [Google Scholar]
- 12. Masashi I, Masanori N, Norikazu H, et al. Perioperative immune responses in cancer patients undergoing digestive surgeries. World J Surg Oncol 2009;7(7):1–9. [DOI] [PMC free article] [PubMed] [Google Scholar]
- 13. Della Bella S, Gennaro M, Vaeeari M, et al. Altered maturation of peripheral blood dendritic cells in patients with breast cancer. Br J Cancer 2003;89:1463–1472. [DOI] [PMC free article] [PubMed] [Google Scholar]
- 14. Liyanage UK, Moore TT, Joo H, et al. Prevalence of regulatory T cells is increased in peripheral blood and tumor microenvironment of patients with pancreas or breast adenocarcinoma. J Immunol 2002;169:2756–2761. [DOI] [PubMed] [Google Scholar]
- 15. Sciarra A, Lichtner M, Autran G, et al. Characterization of circulating blood dendritic cell subsets DC123+ (Lymphoid) and DC11C+ (Myeloid) in prostate adenocarcinoma patients. Prostate 2007;67(9):1–7. [DOI] [PubMed] [Google Scholar]
- 16. Herber DL, Nagaraj S, Djeu JY, et al. Mechanism and therapeutic reversal of immune suppression in cancer. Cancer Res 2007;67:5067–5069. [DOI] [PMC free article] [PubMed] [Google Scholar]
- 17. Whiteside TL. Immune suppression in cancer: Effects on immune cells, mechanisms, and future therapeutic intervention. Semin Cancer Biol 2006;16(1):3–15. [DOI] [PubMed] [Google Scholar]
- 18. Ma XJ, Pan XL, Lv ZH, et al. Therapeutic influence on circulating and monocyte‐derived dendritic cells in laryngeal squamous cell carcinoma patients. Acta Oto‐laryngologica 2009;129(1):84–91. [DOI] [PubMed] [Google Scholar]
- 19. Bais AG, Beckmann I, Lindemans J, et al. A shift to peripheral Th2‐type cytokine pattern during the carcinogenesis of cervical cancer becomes manifest in CIN III lesions. J Clin Pathol 2005;58(10):1096–1100. [DOI] [PMC free article] [PubMed] [Google Scholar]
- 20. Lech‐Maranda E, Bienvenu J, Michallet AS, et al. Elevated IL‐10 plasma levels correlate with poor prognosis in diffuse large B cell lymphoma. Eur Cytokine Network 2006;17:60–66. [PubMed] [Google Scholar]
- 21. O'Garra A, Barrat FJ, Castro AG, et al. Strategies for use of IL‐10 or its antagonists in human disease. Immunol Rev 2008;223:114–131. [DOI] [PubMed] [Google Scholar]
- 22. Philip A, Tadashi M, Priscilla F, et al. Major hepatectomy induces phenotypic changes in circulating dendritic cells and monocytes. J Clin Immunol 2009;29:568–581. [DOI] [PMC free article] [PubMed] [Google Scholar]
- 23. Mimura K, Kono K, Takahashi A, et al. Vascular endothelial growth factor inhibits the function of human mature dendritic cells mediated by VEGF receptor‐2. Cancer Immunol Immunother 2007;56(6):761–770. [DOI] [PMC free article] [PubMed] [Google Scholar]
- 24. Tourkova IL, Yamabe K, Foster B, et al. Murine prostate cancer inhibits both in vivo and in vitro generation of dendritic cells from bone marrow precursors. Prostate 2004;59:203–213. [DOI] [PubMed] [Google Scholar]
- 25. Kiertscher SM, Luo J, Dubinett SM, et al. Tumors promote altered maturation and early apoptosis of monocyte‐derived dendritic cells. J Immunol 2000;164:1269–1276. [DOI] [PubMed] [Google Scholar]
- 26. Satyam A, Singh P, Badjatia N, et al. A disproportion of TH1/TH2 cytokines with predominance of TH2, in urothelial carcinoma of bladder. Urol Oncol 2011;29(1):58–65. [DOI] [PubMed] [Google Scholar]
- 27. Suttmann H, Jacobsen M, Reiss K, et al. Mechanisms of bacillus Calmette‐Guerin mediated natural killer cell activation. J Urol 2004;172:1490–1495. [DOI] [PubMed] [Google Scholar]
- 28. Kaempfer R, Gerez L, Farbstein H, et al. Prediction of response to treatment in superficial bladder carcinoma through pattern of interleukin‐2 gene expression. J Clin Oncol 1996;14(6):1778–1786. [DOI] [PubMed] [Google Scholar]
- 29. Theodorou GL, Marousi S, Ellul J, et al. T helper 1 (Th1)/Th2 cytokine expression shift of peripheral blood CD4+ and CD8+ T cells in patients at the post‐acute phase of stroke. Clin Exp Immunol 2008;152(3):456–463. [DOI] [PMC free article] [PubMed] [Google Scholar]
- 30. Moeller M, Kershaw MH, Cameron R, et al. Sustained antigen‐specific antitumor recall response mediated by gene‐modified CD4+ T helper‐1 and CD8+ T cells. Cancer Res 2007;67(23):11428–11437. [DOI] [PubMed] [Google Scholar]
- 31. Sharma A, Rajappa M, Saxena A, et al. Cytokine profile in Indian women with cervical intraepithelial neoplasia and cancer cervix. Int J Gynecol Cancer 2007;17:879–885. [DOI] [PubMed] [Google Scholar]
- 32. Li C, Huang Q, Kung H. Cytokine and immuno‐gene therapy for solid tumors. Cell Mol Immunol 2005;2:81–91. [PubMed] [Google Scholar]
- 33. Tsai JP, Chen HW, Cheng ML, et al. Analysis of host versus tumor interaction in cancer patients: opposing role of transforming growth factor‐beta1 and interleukin‐6 in the development of in situ tumor immunity. Immunobiology 2005;210(9):661–671. [DOI] [PubMed] [Google Scholar]
- 34. Eldesoky A, Shouma A, Mosaad Y, et al. Clinical relevance of serum vascular endothelial growth factor and interleukin‐6 in patients with colorectal cancer. Saudi J Gastroenterol 2011;17(3):170–173. [DOI] [PMC free article] [PubMed] [Google Scholar]
- 35. Eruslanov E, Neuberger M, Daurkin I, et al. Circulating and tumor‐infiltrating myeloid cell subsets in patients with bladder cancer. Int J Cancer 2012;130(5):1109–1119. [DOI] [PubMed] [Google Scholar]