

Abstract
Elevated C‐reactive protein (CRP) levels have been found in patients with several malignancies. The aim of the present study was to analyze the diagnostic and prognostic values of CRP levels measurement in esophageal cancer (EC) patients in relation to its different histological subtypes (squamous cell carcinoma—ESCC and adenocarcinoma—AC of esophagus) and compared them with classic tumor markers—carcinoembryonic antigen (CEA) and squamous cell cancer antigen (SCC‐Ag). The diagnostic sensitivity, specificity, and the areas under receiver operating characteristic curves (AUC) for all the proteins tested were defined. Serum CRP levels were statistically higher in EC, ESCC, and AC patients compared to healthy subjects and significantly increased in EC and ESCC patients with the presence of lymph node and distant metastases. The percentage of elevated CRP results in all the analyzed subgroups (EC, ESCC, and AC) was higher than CEA and SCC‐Ag, similarly as AUC for CRP in comparison to SCC‐Ag. Serum CRP level was a significant predictor of EC and ESCC patients’ survival in univariate analysis. In conclusion, these results indicate that CRP can be used as an adjunct in evaluating the tumor markers—CEA and SCC‐Ag and may improve the clinical diagnosis and follow‐up of EC patients, especially for ESCC subgroup.
Keywords: C‐reactive protein, esophageal cancer, tumor markers
INTRODUCTION
Esophageal cancer (EC) is a highly aggressive malignancy due to rapid progression, late stage of diagnosis, and poor prognosis of patients’ survival. Therefore, the mortality rate of EC patients is similar to the rate of the incidence 1, 2. It has been shown that 95% of EC account for two histological subtypes of EC—squamous cell carcinoma of esophagus (ESCC) and adenocarcinoma of esophagus (AC) 3, 4. The pattern of EC has changed in the Western countries, thus the incidence of AC has been increased and became the most common subtype of EC, especially among white patients. It may be explained by the increased prevalence of gastroesophageal reflux disease and obesity in Western population 4, 5, 6. On the other hand, in the China, Korea, Japan as well as in black population of patients, the ESCC subtype is still predominant 4, 5, 6.
The usual methods of computed tomography (CT) or endoscopic ultrasonography have a limited usefulness in early detection of microscopic lymph node metastases. In addition, the optimal treatment strategy for advanced EC is still not well established; therefore, other diagnostic and prognostic markers are necessary 7, 8. Various biochemical markers have been used in the diagnosis and follow‐up of EC patients, including carcinoembryonal antygen (CEA) and squamous cell cancer antigen (SCC‐Ag), although their sensitivity remains unsatisfactory 8, 9. Thus, other markers of malignant process within the esophagus are necessary to improve the diagnosis of patients with EC.
C‐reactive protein (CRP) is synthesized by hepatocytes as a response to cytokines, mostly interleukin‐6 (IL‐6) released from leucocytes within tumor microenvironment 7, 10, 11. Moreover, some of the cytokines might be also produced directly by EC cells 7, 10, 11. The authors suggested that systemic inflammation has been associated with development and progression of several tumors 7, 10, 11, 12. However, it still remains controversial whether the elevated CRP level in patients with malignant disease is derived from the synthesis of this protein by the hepatocytes as the response to inflammation or directly from the tumor cells 13. It has been suggested that tissue stress due to presence of tumor cells may cause an inflammatory response and becomes the stimulus for CRP synthesis 7, 11. Some investigators confirmed that EC cells are able to produce IL‐6, which stimulates CRP production, what was proved by experimental studies in EC cell lines 14. In addition, Nozoe et al. 13 have confirmed the immunohistochemical expression of CRP in ESCC cells, which significantly correlated with preoperative serum levels of this protein in EC patients 13. Moreover, the authors concluded that EC cells itself might produce CRP 13. A number of studies have shown elevated concentrations of CRP in the sera of patients with many malignances, including colorectal 15, gastric 16, pancreatic 17, nonsmall cell lung 18, and EC 7, 9, 13, 19, 20. In addition, the concentration of CRP has been associated with the progression of disease and correlated with tumor stage (tumor‐nodulus‐metastases [TNM]), the presence of lymph node (T factor), and distant metastases (M factor) 7, 20, 21, 22. Some clinical investigations have confirmed that serum CRP was an independent prognostic factor for EC patients’ survival 19, 20, 21. However, according to our knowledge, the present data make up one of the first studies that compares the concentrations of CRP with classic tumor markers (CEA and SCC‐Ag) in relation to most common histological subtypes of EC (ESCC and AC). Moreover, the associations between CRP levels and clinicopathological parameters of tumor as well as patients’ survival in all the subgroups tested (EC, ESCC, and AC) were indicated. In addition, the percentage of elevated concentrations and diagnostic specificity as well as the areas under the receiver operating characteristic (ROC) curves (AUC) were assessed for all the analyzed proteins in EC, ESCC, and AC patients.
MATERIALS AND METHOD
Patients and Staging
Clinical diagnosis of EC patients was confirmed by the microscopic examination of the material obtained during surgery and/or biopsy. Moreover, barium and chest radiography; endoscopy of the tracheobronchial tree, pharynx, larynx, and esophagus; MRI and CT examination of the thorax and abdomen were performed. The study included 53 patients with EC (11 women and 42 men, aged 44–81 years) diagnosed by the Oncology Group and operated on by the Thoracic Surgery Unit of the University Hospital of Białystok. Thirty patients from EC group suffered from ESCC (7 women and 23 men, aged 44–81 years), while 23 patients from AC (4 women and 19 men, aged 53–80 years). Additionally, patients with other active concomitant malignant disease or active infection, diabetes mellitus, and serious complications, such as the presence of hepatic, cardiovascular, renal or pulmonary diseases as well as patients after immunotherapy, chemotherapy, irradiation before surgery were excluded from the study. The control group included 90 healthy volunteers (61 women and 29 men, aged 21–65 years), who were recruited from hospital volunteers organizations.
The clinical TNM stage was determined according to the 5th International Union Against Cancer (UICC) 23. The EC, ESCC, and AC patients were divided into four groups: depending on tumor stage (I + II, III, and IV), depth of tumor invasion (T1 + T2, T3, and T4), the presence of lymph node (N0 and N1), and distant metastasis (M0 and M1) as well as histological grade of tumor (G1, G2, and G3). The study was approved by the Local Ethics Committee (R‐I‐002/442/2010). All the patients gave informed consent for the examination.
CRP, CEA, and SCC‐Ag Measurement
Blood samples from patients with cancer and healthy volunteers were drawn preoperatively and before treatment (Sarstedt, Nümbrecht, Germany) and than stored at −80°C until analysis. Serum CRP levels were measured using immunoturbidimetric Protiline® CRP assay kit (bioMerieux, Lyon, France) according to the manufacturer's instruction. The intraassay coefficient of variation (CV%) is referred by the manufacturer as 2.49% at a mean concentration of 10 mg/l. The CEA levels were determined in the sera of patients using a microparticle enzyme immunoassay kit (MEIA) (Abbott, Chicago, IL) and the intraassay CV% for CEA as reported by the manufacturer of the assay kit is 4.9% at a mean concentration of 2.2 ng/ml, SD of 0.11 ng/ml. The serum SCC‐Ag levels were assessed by chemiluminescent assays (CMIA) (Abbott, Tokyo, Japan). The intraassay CV% is referred to by the manufacturer of the assay kit as 4.3 % at SCC‐Ag mean concentration of 1.97 ng/ml, SD = 0.085.
The reference cut‐off value for CRP (5.75 mg/l) corresponds to the highest accuracy (minimal false‐negative and false‐positive results), whereas the cut‐off values for CEA (4.0 ng/ml) and SCC‐Ag (2.0 ng/ml) (the 95th percentile) were established previously in our department 15.
Statistical Analysis
Statistical analysis was performed using the STATISTICA 5.1 PL program (StatSoft Inc., Tulsa, OK). MedCalc statistical software (Mariakerke, Belgium) and Microsoft Office Excel were employed for the assessment of diagnostic criteria, such as diagnostic sensitivity and specificity as well as areas under the ROC curves (AUC). Data were presented as the median and range.
Nonparametric statistical analysis were used, because the CRP, CEA, and SCC‐Ag levels did not follow a normal distribution in chi‐squared test. The Mann–Whitney U‐test was employed to compared data between two groups, whereas for three groups or more, the one‐way ANOVA Kruskal–Wallis test was used. The post hoc Dwass‐Steele‐Critchlow‐Fligner test was conducted to determine which groups were different, if significant differences were found. The probability curves for survival were calculated according to the Kaplan and Meier method. The statistical differences between groups with the log‐rank test for univariate analyses of survival were established. The Cox regression model was used for the multivariate survival analysis. The differences were considered statically significant when P < 0.05.
RESULTS
Association Between the Serum CRP Concentrations and Clinicopathological Parameters of EC in Relation to its Histological Subtypes (ESCC and AC)
The medians and ranges of serum CRP and classic tumor markers (CEA and SCC‐Ag) levels in patients with EC and its histological subtypes (ESCC and AC) as well as in healthy subjects (control group) are shown in Tables 1, 2, 3. The concentrations of CRP and both classic tumor markers were statistically higher in the sera of EC and ESCC patients in comparison to healthy subjects (Tables 1 and 2). Similar findings were indicated for CRP and CEA in AC subgroup, while the differences between SCC‐Ag levels and control group were not statistically significant (Table 3).
Table 1.
The Concentrations of C‐Reactive Protein (CRP) and Classic Tumor Markers (Carcinoembryonic Antigen—CEA and Squamous Cell Cancer Antigen—SCC‐Ag) in the Sera of Esophageal Cancer Patients (EC)
| CRP (mg/l) | CEA (ng/ml) | SCC‐Ag (ng/ml) | ||||||||
|---|---|---|---|---|---|---|---|---|---|---|
| Median | Range | P‐value | Median | Range | P‐value | Median | Range | P | ||
| Group tested | Esophageal cancer (n = 53) | 10.7A | 5.0–149.5 | <0.001* | 2.5A | 0.4–40.4 | <0.001* | 1.3A | 0.4–34.5 | 0.015* |
| Control group (n = 90) | 5.0 | 0.1–13.9 | 0.8 | 0.1–11.4 | 1.0 | 0.6–4.0 | ||||
| Type of cancer | Adenocarcinoma (n = 23) | 6.2A | 5.0–45.5 | 0.112 | 2.5A | 0.4–40.4 | 0.865 | 0.9 | 0.4–4.5 | <0.001* |
| Planoepitheliale (n = 30) | 14.7A | 5.0–149.5 | 2.4A | 0.4–8.5 | 1.5A | 0.6–34.5 | ||||
| TNM stage | I + IIa + IIb (n = 13) | 5.0A | 5.0–64.9 | 0.064 | 1.8**, A | 0.4–3.3 | 0.026* | 1.0 | 0.8–4.3 | 0.264 |
| III (n = 30) | 10.1A | 5.0–134.8 | 2.9A | 0.4–40.4 | 1.3 | 0.4–8.2 | ||||
| IV (n = 10) | 32.1A | 5.0–149.5 | 2.8A | 0.4–7.8 | 5.3A | 0.5–34.5 | ||||
| Depth of tumor invasion (T factor) | T1 + T2 (n = 9) | 5.0A | 5.0–45.5 | 0.295 | 1.8 | 0.4–5.0 | 0.163 | 1.0 | 0.9–24.4 | 0.998 |
| T3 (n = 27) | 9.4A | 5.0–79.9 | 2.5A | 0.8–40.4 | 1.2 | 0.4–34.5 | ||||
| T4 (n = 17) | 20.9A | 5.0–149.5 | 3.1A | 0.4–23.8 | 1.5 | 0.5–19.6 | ||||
| Nodal involvement (N factor) | N0 (n = 13) | 5.0A | 5.0–64.9 | 0.043* | 1.9A | 0.4–3.3 | 0.017* | 1.0 | 0.8–4.3 | 0.702 |
| N1 (n = 40) | 14.3A | 5.0–149.5 | 2.9A | 0.4–40.4 | 1.3A | 0.4–34.5 | ||||
| Distant metastases (M factor) | M0 (n = 43) | 6.6A | 5.0–134.8 | 0.039* | 2.5A | 0.4–40.4 | 0.918 | 1.2 | 0.4–8.2 | 0.111 |
| M1 (n = 10) | 32.1A | 5.0–149.5 | 2.8A | 0.4–7.8 | 5.3A | 0.5–34.5 | ||||
| Differentiation of tumor | G1 (n = 10) | 7.7A | 5.0–79.9 | 0.477 | 2.1A | 0.5–7.8 | 0.523 | 1.2 | 0.9–4.5 | 0.507 |
| G2 (n = 25) | 6.6A | 5.0–149.5 | 2.6A | 0.5–40.4 | 1.4 | 0.4–19.6 | ||||
| G3 (n = 16) | 22.1A | 5.0–75.5 | 2.4A | 0.4–23.8 | 1.1 | 0.5–34.5 | ||||
| Survival of patients | Alive (n = 27) | 5.0A | 5.0–79.9 | 0.009* | 2.5A | 0.4–40.4 | 0.728 | 1.2 | 0.4–4.3 | 0.127 |
| Died of cancer (n = 26) | 21.1A | 5.0–149.5 | 2.2A | 0.4–23.8 | 1.5A | 0.5–34.5 | ||||
*Statistically significant when P < 0.05.
**Statistically significant in post hoc Dwass‐Steel‐Critchlow‐Fligner test in comparison with stage III (P = 0.019).
Statistically significant in comparison with control group.
Table 2.
The Concentrations of C‐Reactive Protein (CRP) and Classic Tumor Markers (Carcinoembryonic Antigen—CEA and Squamous Cell Cancer Antigen—SCC‐Ag) in the Sera of Patients with Squamous Cell Carcinoma of Esophagus (ESCC)
| Variable tested | CRP (mg/l) | CEA (ng/ml) | SCC‐Ag (ng/ml) | |||||||
|---|---|---|---|---|---|---|---|---|---|---|
| Median | Range | P‐value | Median | Range | P‐value | Median | Range | P | ||
| Group tested | ESCC (n = 30) | 14.7A | 5.0–149.5 | <0.001* | 2.4A | 0.4–8.5 | <0.001* | 1.5A | 0.6–34.5 | <0.001* |
| Control group (n = 90) | 5.0 | 0.1–13.9 | 0.8 | 0.1–11.4 | 1.0 | 0.6–4.0 | ||||
| TNM stage | I + IIa + IIb (n = 10) | 5.6** A | 5.0–64.9 | 0.014* | 1.7** A | 0.4–3.3 | 0.011* | 1.3** , *** | 0.8–4.3 | 0.006* |
| III (n = 14) | 20.5A | 5.0–134.8 | 2.9A | 1.5–8.5 | 1.5** A | 0.6–8.2 | ||||
| IV (n = 6) | 42.2A | 21.2–149.5 | 4.2A | 1.7–7.3 | 15.3A | 1.5–34.5 | ||||
| Depth of tumor invasion (T factor) | T1 + T2 (n = 6) | 5.6A | 5.0–37.2 | 0.226 | 1.6 | 0.4–5.0 | 0.214 | 1.4 | 0.9–24.4 | 0.726 |
| T3 (n = 12) | 30.7A | 5.0–79.9 | 2.4A | 0.9–7.2 | 1.4A | 0.8–34.5 | ||||
| T4 (n = 12) | 17.1A | 5.0–149.5 | 2.9A | 1.5–8.5 | 1.6A | 0.6–19.6 | ||||
| Nodal involvement (N factor) | N0 (n = 10) | 5.0A | 5.0–64.9 | 0.006* | 1.9A | 0.4–3.3 | 0.009* | 1.2 | 0.8–4.3 | 0.050* |
| N1 (n = 20) | 29.0A | 5.0–149.5 | 3.1A | 1.4–8.5 | 1.7A | 0.6–34.5 | ||||
| Distant metastases (M factor) | M0 (n = 24) | 7.7A | 5.0–134.8 | 0.014* | 2.3A | 0.4–8.5 | 0.087 | 1.5A | 0.6–8.2 | 0.001* |
| M1 (n = 6) | 42.2A | 21.2–149.5 | 4.2A | 1.7–7.3 | 15.3A | 1.5–34.5 | ||||
| Differentiation of tumor | G1 (n = 6) | 8.4A | 5.0–79.9 | 0.858 | 2.1A | 0.5–3.1 | 0.418 | 1.2 | 0.9–2.5 | 0.234 |
| G2 (n = 13) | 13.0A | 5.0–149.5 | 2.5A | 0.9–8.5 | 1.9A | 1.0–19.6 | ||||
| G3 (n = 9) | 21.2A | 5.0–75.5 | 2.5A | 0.4–7.3 | 1.5A | 0.6–34.5 | ||||
| Survival of patients | Alive (n = 12) | 5.4A | 5.0–79.9 | 0.040* | 2.4A | 0.4–8.5 | 0.595 | 1.3A | 0.8–4.3 | 0.075 |
| Died of cancer (n = 18) | 24.1A | 5.0–149.5 | 2.4A | 1.4–7.3 | 1.8A | 0.6–34.5 | ||||
*Statistically significant when P < 0.05.
**Statistically significant in comparison with stage IV post hoc Dwass‐Steel‐Critchlow‐Fligner test.
***Statistically significant in comparison with stage III post hoc Dwass‐Steel‐Critchlow‐Fligner test.
Statistically significant in comparison with control group.
Table 3.
The Concentrations of C‐Reactive Protein (CRP) and Classic Tumor Markers (Carcinoembryonic Antigen—CEA and Squamous Cell Cancer Antigen—SCC‐Ag) in the Sera of Patients with Adenocarcinoma of Esophagus (AC)
| Variable tested | CRP (mg/l) | CEA (ng/ml) | SCC‐Ag (ng/ml) | |||||||
|---|---|---|---|---|---|---|---|---|---|---|
| Median | Range | P‐value | Median | Range | P | Median | Range | P‐value | ||
| Group tested | AC (n = 23) | 6.2A | 5.0–45.5 | <0.001* | 2.5A | 0.4–40.4 | <0.001* | 0.9 | 0.4–4.5 | 0.301 |
| Control group (n = 90) | 5.0 | 0.1–13.9 | 0.8 | 0.1–11.4 | 1.0 | 0.6–4.0 | ||||
| TNM stage | I + IIa + IIb (n = 3) | 5.0 | 5.0–45.5 | 0.995 | 1.9 | 0.5–2.6 | 0.257 | 1.0 | 0.9–1.4 | 0.600 |
| III (n = 16) | 7.8A | 5.0–41.8 | 4.0A | 0.4–40.4 | 0.9 | 0.4–4.5 | ||||
| IV (n = 4) | 10.3 | 5.0–40.5 | 1.2 | 0.4–7.8 | 0.9 | 0.5–1.0 | ||||
| Depth of tumor invasion (T factor) | T1 + T2 (n = 3) | 5.0 | 5.0–45.5 | 0.357 | 1.9 | 0.5–2.6 | 0.676 | 1.0 | 0.9–1.4 | 0.038* |
| T3 (n = 15) | 5.0A | 5.0–45.5 | 2.5A | 0.8–40.4 | 0.9 | 0.4–4.5 | ||||
| T4 (n = 15) | 20.9 | 5.0–41.8 | 7.5 | 0.4–23.8 | 0.7** | 0.5–0.9 | ||||
| Nodal involvement (N factor) | N0 (n = 3) | 5.0 | 5.0–45.5 | 0.923 | 1.9 | 0.5–2.6 | 0.411 | 1.0 | 0.9–1.4 | 0.463 |
| N1 (n = 20) | 7.8A | 5.0–41.8 | 2.6A | 0.4–40.4 | 0.9 | 0.4–4.5 | ||||
| Distant metastases (M factor) | M0 (n = 19) | 6.2A | 5.0–45.5 | 0.966 | 2.6A | 0.4–40.4 | 0.208 | 0.9 | 0.4–4.5 | 0.415 |
| M1 (n = 4) | 10.3 | 5.0–40.5 | 1.2 | 0.4–7.8 | 0.9 | 0.5–1.0 | ||||
| Differentiation of tumor | G1 (n = 4) | 7.2 | 5.0–15.5 | 0.222 | 2.2A | 0.9–7.8 | 0.781 | 1.2 | 1.0–4.5 | 0.090 |
| G2 (n = 12) | 5.0A | 5.0–45.5 | 2.7A | 0.5–40.4 | 0.9 | 0.4–2.2 | ||||
| G3 (n = 7) | 23.0A | 5.0–41.8 | 1.6 | 0.4–23.8 | 0.7A | 0.5–1.4 | ||||
| Survival of patients | Alive (n = 15) | 5.0A | 5.0–41.8 | 0.259 | 2.6A | 0.4–40.4 | 0.301 | 1.0 | 0.4–2.2 | 0.364 |
| Died of cancer (n = 8) | 18.2A | 5.0–45.5 | 1.2 | 0.4–23.8 | 0.9 | 0.5–4.5 | ||||
*Statistically significant when P < 0.05.
**Statistically significant in comparison with stage III post hoc Dwass‐Steel‐Critchlow‐Fligner test, P = 0.047.
Statistically significant in comparison with control group.
Serum CRP levels showed a tendency to increase in more advanced tumor stage in all the subgroups analyzed (EC, ESCC, and AC); however, the differences between II and IV stage of tumor were significant only for ESCC subgroup (Tables 1, 2, 3). The concentrations of classic tumor markers were also higher in patients in more advanced stage than in early stage of disease in EC and ESCC subgroups and the differences were significant for CEA in EC and ESCC patients and for SCC‐Ag in ESCC subgroup. Similar findings were observed in post hoc Dwass‐Steel‐Critchlow‐Fligner test (Tables 1 and 2).
The concentrations of CRP, CEA, and SCC‐Ag varied according to depth of tumor invasion (T factor) and were higher in T4 subgroup than in T1 + T2 subjects in EC and ESCC patients (Tables 1, 2, 3). Moreover, in EC and ESCC patients, the concentrations of all the analyzed markers were higher in the sera of patients with the presence of lymph node metastases (N1 subgroup) compared to patients without nodal involvement (N0 subgroup). Statistically significant correlations between N1 and N0 patients were found for CRP and CEA levels in EC and ESCC subgroups as well as for SCC‐Ag in ESCC patients in Mann–Whitney test (Tables 1, 2, 3). If we consider the presence of distant metastases (M factor), the serum levels of CRP were higher in EC, ESCC, and AC patients with the presence of distant metastases (M1) compared to patients without distant metastases (M0); however, the differences were significant for EC and ESCC subgroups. The concentrations of classic tumor markers (CEA and SCC‐Ag) in EC and ESCC subgroups were also higher in M1 than M0 subjects, but only serum SCC‐Ag levels in ESCC patients revealed significant correlation in Mann–Whitney test (Tables 1 and 2). The concentrations of all the markers tested varied according to histological grade of tumor. Serum levels of CRP were increased in the patients with poorly differentiated EC, ESCC, and AC (G3) in comparison with well‐differentiated tumors (G1); however, all these differences were not statistically significant (Tables 1, 2, 3). In EC and ESCC patients, the highest levels of classic tumor markers were indicated in moderately differentiated tumors (G2), but CEA concentrations in ESCC subgroup were similar in G2 and G3 patients. Moreover, the CRP levels were higher in the sera of patients who died of EC and ESCC during observation period, likewise the levels of SCC‐Ag in EC and ESCC patients, although these differences were significant only for CRP (Tables 1, 2, 3).
Diagnostic Criteria for Serum CRP, CEA, and SCC‐Ag Levels
The percentage of increased results (diagnostic sensitivity) of CRP and classic tumor markers in all the analyzed subgroups (EC, ESCC, and AC) is presented in Table 4. The diagnostic sensitivity of CRP levels in EC (64%) patients as well as in ESCC (73%) and AC (52%) subgroups was notably higher in comparison to CEA (30, 23, and 39%, respectively) as well as SCC‐Ag (24, 33, and 13%, respectively) (Table 4). The combined use of CRP with classic tumor markers improved the percentage of elevated concentrations in the analyzed subgroups (EC, ESCC, and AC) and were found to be higher compared to CEA and SCC‐Ag in combination (47, 43, and 52%, respectively). In addition, the diagnostic specificity of CRP levels was the same as for SCC‐Ag (EC—96%, ESCC and AC—97%) and slightly lower than those of CEA (EC—97%, ESCC and AC—both 98%).
Table 4.
The Percentage of Elevated Concentrations (Diagnostic Sensitivity) of C‐Reactive Protein (CRP) and Classic Tumor Markers (Carcinoembryonic Antigen—CEA and Squamous Cell Cancer Antigen—SCC‐Ag) in Patients with Esophageal Cancer (EC), Squamous Cell Carcinoma (ESCC), and Adenocarcinoma of Esophagus (AC)
| EC | ESCC | AC | |
|---|---|---|---|
| CRP | 64 | 73 | 52 |
| CEA | 30 | 23 | 39 |
| SCC‐Ag | 24 | 33 | 13 |
| CRP + CEA | 70 | 77 | 57 |
| CRP + SCC‐Ag | 73 | 77 | 65 |
| CEA + SCC‐Ag | 47 | 43 | 52 |
The ROC curves were used to assess the association between diagnostic sensitivity and specificity of all the analyzed markers. The area under ROC curve (AUC) for CRP (EC—0.8243, ESCC—0.8670, and AC—0.7686) was slightly lower than for CEA (EC—0.8366, ESCC—0.8689, and AC—0.7944), but notably higher than AUC for SCC‐Ag (EC—0.6212, ESCC—0.7674, and AC—0.5696) (Figs 1, 2, 3). The comparison of AUC between all the markers tested indicated the statistically significant correlations (P < 0.05) between CRP and SCC‐Ag as well as CEA and SCC‐Ag in EC and AC patients.
Figure 1.
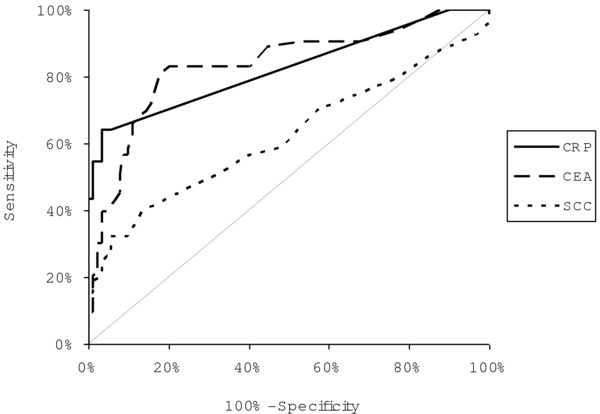
The areas under ROC curves (AUC) for C‐reactive protein (CRP = 0.8243, P < 0.001), carcinoembryonic antigen (CEA = 0.8366, P < 0.001), and squamous cell cancer antigen (SCC‐Ag = 0.6212, P = 0.0205) in patients with esophageal cancer (EC).
Figure 2.
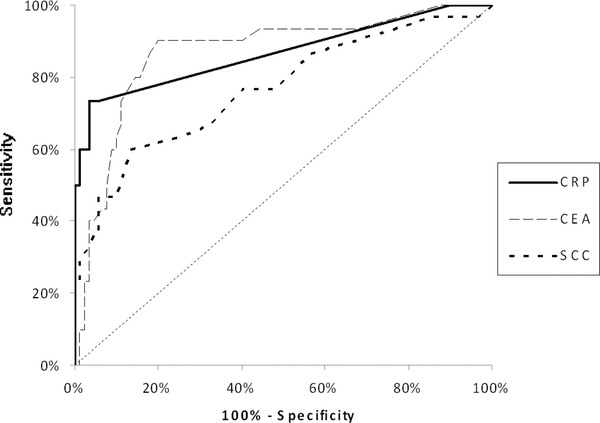
The areas under ROC curves (AUC) for C‐reactive protein (CRP = 0.8670, P < 0.001), carcinoembryonic antigen (CEA = 0.8689, P < 0.001), and squamous cell cancer antigen (SCC‐Ag = 0.7674, P < 0.001) in patients with squamous cell carcinoma of esophagus (ESCC).
Figure 3.
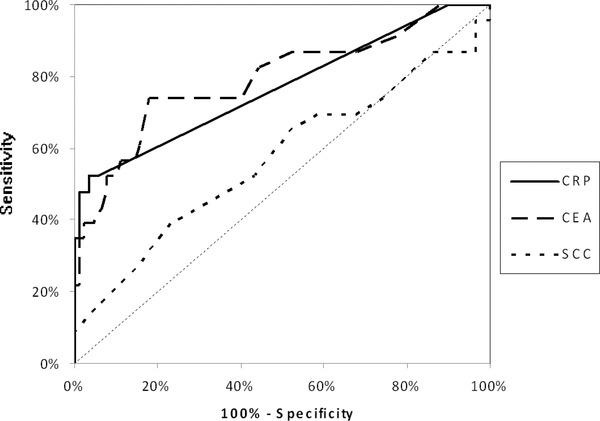
The areas under ROC curves (AUC) for C‐reactive protein (CRP = 0.7686, P < 0.001), carcinoembryonic antigen (CEA = 0.7944, P < 0.001), and squamous cell cancer antigen (SCC‐Ag = 0.5696, P = 0.3522) in patients with adenocarcinoma of esophagus (AC).
Clinical Prognostic Factors of EC, ESCC, and AC Patients’ Survival
In the order to assess whether elevated CRP levels may predict the prognosis of EC, ESCC, and AC patients’ survival, the Kaplan–Meier analysis and log‐rank test were calculated. Variables that were significant predictors of overall EC patients survival using the univariate log‐rank analysis included tumor stage (TNM) (P < 0.001), depth of tumor invasion (T factor) (P < 0.001), the presence of distant metastases (M factor) (P < 0.001) as well as the serum concentrations of CRP (P = 0.009) and SCC‐Ag (P = 0.003). Similar findings were showed in ESCC subgroup, where tumor stage (P = 0.04), T (P = 0.014), and M (P = 0.002) factors, serum CRP (P = 0.048), CEA (P = 0.030), and SCC‐Ag (P = 0.014) were proved to be the significant indicators affecting overall survival. In addition, in AC patients the tumor stage (P = 0.04), depth of tumor invasion (P = 0.041), and the presence of distant metastases (P = 0.001) were significant predictors of patients’ survival. Moreover, multivariate regression analysis indicated that the tumor stage (P = 0.017) and the presence of distant metastasis (P = 0.033) were independent prognostic factors of EC patients’ survival, whereas in ESCC subgroup the independent prognostic values were found for the presence of distant metastasis (P = 0.022) and serum SCC‐Ag (P = 0.037) levels.
DISCUSSION
EC remains widespread malignancy 3, 4, 5, 6. CEA and SCC‐Ag have been the most studied in the diagnosis of EC patients; however, their sensitivity has not proven satisfactory 9. To our knowledge, present data are the first report that assessed CRP levels in the sera of EC patients as well as in patients with different histological subtypes of EC (ESCC and AC) and compared them to classic tumor markers (CEA and SCC‐Ag).
In the present study, the levels of CRP and both classic tumor markers were statistically higher in the sera of EC and ESCC patients compared to healthy subjects, likewise CRP and CEA in AC subgroup. Similar tendency was observed previously in patients with colorectal 15, gastric 16, and pancreatic cancer 17, where the concentrations of this protein in cancer patients were significantly higher in comparison to healthily subjects. Several authors have indicated elevated CRP levels in the majority of EC patients 7, 13, 21, 24. In addition, Guillem and Triboulet 9 have proved that mean CRP levels in EC patients was higher than in patient with benign esophageal diseases. The mechanism of CRP synthesis in tumor cells has not been yet elucidated, although some results have concluded, that ESCC cells might produce CRP itself 13. Additionally, in the current study, serum CRP levels increased in more advanced stage of disease in all the analyzed subgroups (EC, ESCC, AC); however, the differences between tumor stages were significant only for CRP in ESCC patients. Our present results were in the line with the other studies, in which the patients with more advanced stage of EC 7, 20 and ESCC 22 had higher CRP levels than those with early stages of disease and the differences between stages were statistically significant. These findings are also in agreement with the studies performed on gastric cancer patients 16, where CRP levels significantly correlated with TNM stage. The opposite results were indicated by other authors, who failed to establish any significant differences between CRP levels and tumor stage of EC 19, 24.
Currently, we indicated that preoperative serum levels of all the proteins tested in EC, ESCC, and AC subgroups were higher in T4 subjects in comparison to T1 + T2 patients. Similar results were demonstrated by other authors, who revealed that CRP concentrations correlated with depth of tumor invasion; however, in their studies, the differences were statistically significant 20, 21, 22. Currently, serum concentrations of CRP were significantly higher in EC and ESCC patients with the presence of lymph node and distant metastases when compared to patients without nodal involvement and distant metastasis. Our findings are in line with other studies, where the patients with the presence of lymph node and distant metastases had significantly higher CRP concentrations in comparison to N0 and M0 subjects; however, these data were performed only on EC subgroup 7. Similar observations were found in the sera of gastric, colorectal, and pancreatic cancer patients, where the CRP levels were also significantly higher in the patients with the presence of lymph node 16, 17 and distant metastases 15, 16 than in N0 and M0 subgroups. On the other hand, Guillem and Triboulet 9 as well as Fujiwara et al. 24 failed to establish any correlation between CRP concentrations in EC patients and T, N, and M factors. It has been shown that CRP levels increased with tumor progression, which may be caused by inflammatory cytokines produced by the cancer cells in patients with advanced disease 22 as well as by CRP synthesis by EC cells 13. Based upon our present data and findings of other investigators, we suggested that advanced stage of cancer as well as tumor volume might contribute to CRP levels. In the current study, we revealed that the concentrations of CRP in EC and ESCC subgroups were significantly higher in the sera of patients who died because of cancer compared to patients who survived. Similar observations were found in our previous findings concerning gastric 16 and pancreatic cancer 17 patients; however, serum levels of CRP were not significantly correlated with patients’ survival.
In the present study, the percentage of elevated concentrations of CRP levels in all the analyzed subgroups was higher in comparison to both classic tumor markers and combined use of CRP with CEA or SCC‐Ag were found to be higher when compared to those of CEA with SCC‐Ag. Thus, in order to diagnostic sensitivity, the combined analysis of CRP with SCC‐Ag or CEA may be more useful in the diagnosis of EC, ESCC, and AC patients than combination of classic tumor markers. Present results are in the line with our previous data concerning gastric cancer 16 patients, where the frequency of increased CRP concentrations was also notably higher than CEA and similar to our previous studies, where we indicated the diagnostic sensitivity of other EC biomarkers, including matrix metalloproteinase 9 as well as macrophage colony stimulating factor, which were assessed in the sera of EC and ESCC patients 25, 26, 27. Moreover, in our current study, the diagnostic specificity of CRP levels was the same as for SCC‐Ag and slightly lower than those of CEA. Similar observations were found in the sera of gastric cancer patients, where diagnostic specificity of CRP was also slightly lower in comparison to CEA 16. Currently, the area under ROC curve (AUC) for CRP was slightly lower than for CEA, but notably higher than for SCC‐Ag in all the analyzed subgroups. Opposite results were indicated in our previous data concerning serum CRP in gastric 16 and colorectal 15 cancer patients, where AUC for CRP was higher than those of CEA.
In our present study, the univariate log‐rank analysis showed that the serum CRP was the significant factor affecting overall survival of EC as well as ESCC patients. Similar findings were shown in our previous data, although CRP levels were found to be the independent significant prognostic factor affecting survival of colorectal cancer patients 15. Opposite results were observed in our study performed on pancreatic and gastric cancer patients, where we failed to established the significance of CRP concentration as an indicator affecting overall patients’ survival 16, 17. In addition, several authors have proved the significance of CRP as an independent prognostic factor, which has an influence on long‐term prognosis for EC patients 19, 20, 21.
In summary, in the present study, the EC patients were divided into two groups, depending on most common histological subtypes of EC (ESCC and AC). Moreover, in all those subgroups (EC, ESCC, and AC), the CRP concentrations in relation to clinicopathologiacal parameters of tumor were assesses and compared with the levels of classic tumor markers (CEA and SCC‐Ag). The CRP levels were statistically higher in the sera of EC, ESCC, and AC patients than healthy subjects. Moreover, the significant correlation between CRP levels and TNM stage in ESCC subgroup was demonstrated. Serum concentrations of CRP were significantly higher in EC and ESCC patients with the presence of lymph node and distant metastases when compared to patients without nodal involvement and distant metastasis. Additionally, the percentage of elevated results of CRP levels in all the analyzed subgroups was higher in comparison to both classic tumor markers. The highest diagnostic sensitivity was observed for combined use of CRP with classic tumor markers in ESCC patients, which was higher than diagnostic sensitivity of CEA and SCC‐Ag in combination. The AUC for CRP was notably higher than for SCC‐Ag in EC, ESCC, and AC subgroups. Serum CRP level was a significant predictor of EC and ESCC patients’ survival in univariate analysis, but not independent in multivariate analysis. Our findings confirmed that CRP may be used as an adjunct in evaluating the tumor markers—CEA and SCC‐Ag in the diagnosis of EC patients, especially for ESCC subgroup. Since CRP is a sensitive, but nonspecific marker of inflammation, it might be helpful in the evaluation of EC. Our study suggesting that easy, cheap, and quick to perform method of serum CRP measurement may improve the clinical diagnosis and follow‐up of EC, especially for ESCC patients.
REFERENCES
- 1. Crew K, Neugut A. Epidemiology of upper gastrointestinal malignancies. Semin Oncol 2004;31:450–464. [DOI] [PubMed] [Google Scholar]
- 2. Vallböhmer D, Lenz A. Predictive and prognostic molecular markers in outcome of esophageal cancer. Dis Esophagus 2006;196:425–432. [DOI] [PubMed] [Google Scholar]
- 3. Siewert J, Stein H, Feith M, Bruecher B, Bartels H, Fink U. Histologic tumor type is an independent prognostic parameter in esophageal cancer: lessons from more than 1,000 consecutive resections at a single center in the Western world. Ann Surg 2001;234:360–369. [DOI] [PMC free article] [PubMed] [Google Scholar]
- 4. Messmann H. Squamous cell cancer of the oesophagus. Best Pract Res Clin Gastroenterol 2001;15:249–265. [DOI] [PubMed] [Google Scholar]
- 5. Pera M, Cameron AJ, Trastek VF, Carpenter HA, Zinsmeister AR. Increasing incidence of adenocarcinoma of the esophagus and esophagogastric junction. Gastroenterology 1993;104:510–513. [DOI] [PubMed] [Google Scholar]
- 6. Hongo M, Nagasaki Y, Shoji T. Epidemiology of esophageal cancer: orient to occident. Effects of chronology, geography and ethnicity. J Gastroenterol Hepatol 2009;24:729–735. [DOI] [PubMed] [Google Scholar]
- 7. Wang CY, Hsieh MJ, Chiu YC, Li SH, Huang HW, Fang FM, Huang YJ. Higher serum C‐reactive protein concentration and hypoalbuminemia are poor prognostic indicators in patients with esophageal cancer undergoing radiotherapy. Radiother Oncol 2009;92:270–275. [DOI] [PubMed] [Google Scholar]
- 8. Motoyama S, Miura M, Hinai Y, Maruyama K, Usami S, Nakatsu T, Saito H, Minamiya Y, Suzuki T, Ogawa J. CRP genetic polymorphism is associated with lymph node metastasis in thoracic esophageal squamous cell cancer. Ann Surg Oncol 2009:16:2479–2485. [DOI] [PubMed] [Google Scholar]
- 9. Guillem P, Triboulet J. Elevated serum levels of C‐reactive protein are indicative of a poor prognosis in patients with esophageal cancer. Dis Esophagus 2005;18:146–150. [DOI] [PubMed] [Google Scholar]
- 10. Oka M, Iizuka N, Yamamoto K, Gondo T, Abe T, Hazama S, Akitomi Y, Koishihara Y, Ohsugi Y, Ooba Y, Ishihara T, Suzuki T. The influence of interleukin‐6 on the growth of human esophageal cancer cell lines. J Interferon Cytokine Res 1996;16:1001–1006. [DOI] [PubMed] [Google Scholar]
- 11. Wang CS, Sun CF. C‐reactive protein and malignancy: clinico‐pathological association and therapeutic implication. Chang Gung Med J 2009;32:471–482. [PubMed] [Google Scholar]
- 12. McMillan DC, Canna K, McArdle CS. Systemic inflammatory response predicts survival following curative resection of colorectal cancer. Br J Surg 2003;90:215–219. [DOI] [PubMed] [Google Scholar]
- 13. Nozoe T, Korenaga D, Futatsugi M, Saeki H, Maehara Y, Sugimachi K. Immunohistochemical expression of C‐reactive protein in squamous cell carcinoma of the esophagus ‐ significance as a tumor marker. Cancer Lett 2003;192:89–95. [DOI] [PubMed] [Google Scholar]
- 14. Oka M, Yamamoto K, Takahashi M, Hakozaki M, Abe T, Iizuka N, Hazama S, Hirazawa K, Hayashi H, Tangoku A, Hirose K, Ishihara T, Suzuki T. Relationship between serum levels of interleukin 6, various disease parameters and malnutrition in patients with esophageal squamous cell carcinoma. Cancer Res 1996;56:2776–2780. [PubMed] [Google Scholar]
- 15. Groblewska M, Mroczko B, Wereszczyńska‐Siemiatkowska U, Kedra B, Lukaszewicz M, Baniukiewicz A, Szmitkowski M. Serum interleukin 6 (IL‐6) and C‐reactive protein (CRP) levels in colorectal adenoma and cancer patients. Clin Chem Lab Med 2008;46:1423–1428. [DOI] [PubMed] [Google Scholar]
- 16. Łukaszewicz‐Zając M, Mroczko B, Gryko M, Kędra B, Szmitkowski M. Comparison between clinical significance of serum proinflammatory proteins (IL‐6 and CRP) and classic tumor markers (CEA and CA 19‐9) in gastric cancer. Clin Exp Med 2010;11:89–96. [DOI] [PMC free article] [PubMed] [Google Scholar]
- 17. Mroczko B, Groblewska M, Gryko M, Kedra B, Szmitkowski M. Diagnostic usefulness of serum interleukin 6 (IL‐6) and C‐reactive protein (CRP) in the differentiation between pancreatic cancer and chronic pancreatitis. J Clin Lab Anal 2010;24:256–261. [DOI] [PMC free article] [PubMed] [Google Scholar]
- 18. Hara M, Matsuzaki Y, Shimuzu T, Shimuzu T, Tomita M, Ayabe T, Enomoto Y, Onitsuka T. Preoperative serum C‐reactive protein level in non‐small cell lung cancer. Anticancer Res 2007;27:3001–3004. [PubMed] [Google Scholar]
- 19. Zingg U, Forberger J, Rajcic B, Langton C, Jamieson GG. Association of C‐reactive protein levels and long‐term survival after neoadjuvant therapy and esophagectomy for esophageal cancer. J Gastrointest Surg 2010;14;462–469. [DOI] [PubMed] [Google Scholar]
- 20. Nozoe T, Saeki H, Sugimachi K. Significance of preoperative elevation of serum C‐reactive protein as an indicator of prognosis in esophageal carcinoma. Am J Surg 2001;182:197–201. [DOI] [PubMed] [Google Scholar]
- 21. Gockel I, Dirksen K, Messow CM. Significance of preoperative C‐reactive protein as a parameter of the perioperative course and long‐term prognosis in squamous cell carcinoma and adenocarcinoma of the oesophagus. World J Gastroenterol 2006;12:3746–3750. [DOI] [PMC free article] [PubMed] [Google Scholar]
- 22. Shimada H, Nabeya Y, Okazumi S, Matsubara H, Shiratori T, Aoki T, Sugaya M, Miyazawa Y, Hayashi H, Miyazaki S, Ochiai T. Elevation of preoperative serum C‐reactive protein level is related to poor prognosis in esophageal squamous cell carcinoma. J Surg Oncol 2003;83:248–252. [DOI] [PubMed] [Google Scholar]
- 23. Jass JR, LH S. WHO International Histological Classification of Tumors. Histological Typing of Intestinal Tumors. New York: Springer‐Verlag, 1989. [Google Scholar]
- 24. Fujiwara H, Suchi K, Okamura S, Okamura H, Umehara S, Todo M, Shiozaki A, Kubota T, Ichikawa D, Okamoto K, Ochiai T, Kokuba Y, Sonoyama T, Otsuji E. Elevated serum CRP levels after induction chemoradiotherapy reflect poor treatment response in association with IL‐6 in serum and local tumor site in patients with advanced esophageal cancer. J Surg Oncol 103:62–68. [DOI] [PubMed] [Google Scholar]
- 25. Mroczko B, Kozłowski M, Groblewska M, Łukaszewicz M, Nikliński J, Jelski W, Laudański J, Chyczewski L, Szmitkowski M. The diagnostic value of the measurement of matrix metalloproteinase 9 (MMP‐9), squamous cell cancer antigen (SCC) and carcinoembryonic antigen (CEA) in the sera of esophageal cancer patients. Clin Chim Acta 2008;389:61–66. [DOI] [PubMed] [Google Scholar]
- 26. Łukaszewicz‐Zajac M, Mroczko B, Kozłowski M, Nikliński J, Laudański J, Szmitkowski M. Elevated levels of serum metalloproteinase 9 in patients with esophageal squamous cell carcinoma. Pol Arch Med Wewn 2009;119:558–563. [PubMed] [Google Scholar]
- 27. Łukaszewicz‐Zajac M, Mroczko B, Kozłowski M, Nikliński J, Laudański J, Szmitkowski M. Clinical significance of serum macrophage‐colony stimulating factor (M‐CSF) in esophageal cancer patients and its comparison with classical tumor markers. Clin Chem Lab Med 2010;48:1467–1473. [DOI] [PubMed] [Google Scholar]