

Abstract
Background
The aim of this study was to determine the relation between iron deficiency anemia (IDA) and serum leptin, hepcidin, and ghrelin levels. J. Clin. Lab. Anal. 27:81–5, 2013. © 2012 Wiley Periodicals, Inc.
Methods
Thirty children with IDA and 28 healthy children between the ages of 6 months and 6 years admitted to our hospital were evaluated prospectively. IDA was diagnosed based on clinical and laboratory findings. All children with IDA were treated with iron II‐glycine‐sulphate complex for 3 months. Complete blood count; iron metabolism parameters; and serum leptin, hepcidin, and ghrelin levels were studied in all healthy children and in children with IDA before and after treatment.
Results
In children with IDA, the decrease seen in serum leptin levels after the iron treatment was not statistically significant. However, the increase seen in serum hepcidin levels after the iron treatment was statistically significant (P = 0.038). Hepcidin levels were significantly higher in children with IDA who received iron treatment compared to healthy children (P = 0.008). After the iron treatment, serum ghrelin levels in children with IDA were also significantly higher compared to the levels before treatment and healthy children (P = 0.019 and 0.000, respectively).
Conclusion
Serum ghrelin and hepcidin levels increase with iron treatment in children with IDA. In view of the higher serum ghrelin and hepcidin levels after iron treatment when compared to pretreatment levels and the healthy children, we suggest that the iron treatment has an important role in serum hepcidin and ghrelin synthesis. J. Clin. Lab. Anal. 00:1‐5, 2012. © 2012 Wiley Periodicals, Inc.
Keywords: iron deficiency anemia, leptin, hepcidin, ghrelin
INTRODUCTION
Iron deficiency anemia (IDA) is defined as an anemia caused by the deficiency of iron required for maintaining continuous erythropoiesis within bone marrow 1. With the exception of the neonatal period, it is the most common disease of the hematopoietic system in infants, children, and adolescents.
Leptin is a well‐defined afferent saturation factor secreted in fat tissue, which suppresses appetite and controls body weight, food intake, and energy consumption by affecting the appetite‐regulating nucleus in the human hypothalamus 2. Hepcidin is a homeostatic regulator of iron absorption from the intestine, iron circulation in macrophages, and iron release from hepatic deposits 3. Increases in plasma iron levels and tissue iron deposits activate the synthesis of hepcidin, and then hepcidin decreases iron release from macrophages and enterocytes into the plasma 4, 5. Ghrelin is a hormone secreted from the stomach fundus, which stimulates the feeling of hunger. Its secretion through the central or peripheral route increases appetite and food intake. Plasma ghrelin levels reach a maximum before feeding, fall after feeding, and start to increase again after eating. This feature of ghrelin makes it the feeding initiator. It is reported that loss of appetite in IDA may be caused by decreased ghrelin levels 6.
The aim of this study was to determine the relation between IDA and serum leptin, hepcidin, and ghrelin levels.
MATERIAL AND METHODS
In this study, 28 healthy children and 30 children with isolated nutritional IDA, with hemoglobin (Hb) value in complete blood count of <9 g/dL serum iron, transferrin, and ferritin levels compatible with IDA, and no other diseases, were analyzed prospectively. All these children were aged between 6 months and 6 years.
The IDA diagnosis was established based on clinical and laboratory findings. Patients with IDA used iron treatment as 6 mg/kg/day for 1 month. All children with IDA were treated with orally iron II‐glycine‐sulphate complex for 1 month. After Hb levels reached the normal range, iron treatment was continued as 2 mg/kg/day for 2 months.
Complete blood count; sedimentation rate; absolute reticulocyte count; serum iron; total iron binding capacity; iron saturation; transferrin; and ferritin, and serum leptin, hepcidin, and ghrelin levels were analyzed in patients before and after the treatment and in healthy children.
Automatic hemocytometer (LH‐780, Beckman Coulter (USA)), which is calibrated on a daily basis, was used for complete blood count and reticulocytes. Hb, hematocrit, white blood cell count, platelet count, mean corpuscular volume, mean corpuscular Hb, mean corpuscular Hb concentration, red cell distribution width, and reticulocytes were measured from 2 ml of venous blood.
After complete coagulation of venous blood samples collected for leptin, hepcidin, and ghrelin, they were divided into serums after centrifuge for 5 min at 3,000 rpm. Samples were frozen at –80°C until analysis. Prior to analysis, all samples were kept at –20°C for 1 day and thawed at +4°C. Leptin and hepcidin levels of thawed serum samples were measured in the hematology laboratory using DRG ELISA kit (DRG International, Inc Frauenbergstr, Germany). Ghrelin levels were measured as total ghrelin level using commercial Ghrelin (Human) EIA Kit (Phoenix Pharmaceuticals, Inc. (USA)), and results were computed using standard graphic method.
Data analysis was performed using the Statistical Package for the Social Sciences (SPSS) for Windows ver. 14 package program. Data with normal distribution were expressed as mean ± standard deviation and data without normal distribution were expressed as medians. P values < 0.05 were considered statistically significant. This study was approved by the Education Planning and Coordination Board of the Ministry of Health Ankara Education and Research Hospital (no. 3232, 03.11.10), and was conducted according to the provisions thereof.
RESULTS
Thirty children diagnosed with IDA and with Hb of 9 g/dL and 28 children without anemia were included in this study. Ages of children with IDA were between 7and 67 months (mean 20 ± 12 months). Of all patients, 14 (46.6%) were males and 16 (53.3%) were females. Ages of healthy children were between 8 and 68 months (mean 33.4 ± 15.3 months) and of those, 14 (50%) were males and 14 (50%) were females.
Significant improvements observed in hematologic and iron metabolism parameters of all patients after iron treatment (Table 1).
Table 1.
Comparison of Hematological Parameters and Iron Metabolism Parameters in Children with IDA Before and After Treatment
| Before treatment | After treatment | P | |
|---|---|---|---|
| Hemoglobin (g/dL) | 8.2 ± 0.8 | 11.9 ± 1.2 | 0,000 a |
| Hematokrit (%) | 26.8 ± 2.6 | 34.2 ± 3.3 | 0,000 a |
| Mean corpuscular volume (fL) | 60.4 ± 7.7 | 72.5 ± 9.3 | 0,000 a |
| Mean corpuscular hemoglobin (pg/erythrocyte) | 18.6 ± 2.9 | 22.8 ± 3.2 | 0,000 a |
| Mean corpuscular hemoglobin concentration (g/dL) | 30.7 ± 1.2 | 32.6 ± 1.0 | 0,000 a |
| Red cell distribution width (%) | 21.1 ± 5.2 | 23.4 ± 7.8 | 0.203a |
| White blood cell count (109/L) | 8.82 ± 3.47 | 10.43 ± 2.76 | 0.052a |
| Platelet count (109/L) | 393 ± 155 | 352 ± 83 | 0.058a |
| Absolute reticulocyte count (109/L) | 0.069 ± 0.032 | 0.083 ± 0.035 | 0,004* |
| Iron (μg/dL) | 12 (6–46) | 29 (10–119) | 0,000 b |
| Iron saturation (%) | 3.9 ± 2,6 | 10.4 ± 7.6 | 0,000 b |
| Iron binding capacity (μg/dL) | 414 ± 76 | 368 ± 54 | 0,006* |
| Ferritin (ng/mL) | 6.2 (0.9–11.1) | 35.05 (3.1–99) | 0,029 b |
Paired samples t‐test.
Wilcoxon test.
Median serum leptin level of children with IDA was 0.331 ng/mL (0.00–5.108 ng/mL) before the treatment and 0.203 ng/mL (0.00–8.787 ng/mL) after the treatment; no statistically significant difference was found between before and after treatment levels (P = 0.738; Table 2). Median serum leptin level in healthy children was 0.151 ng/mL (0.00–5.325 ng/mL). No statistically significant difference was found in serum leptin levels between healthy children and before or after treatment levels in the children with IDA (P = 0.163 and 0.29, respectively; Tables 3 and 4).
Table 2.
A Comparison of Serum Leptin, Hepcidin, and Ghrelin Levels of Children with IDA Before and After Treatment
| Before treatment | After treatment | P | |
|---|---|---|---|
| Leptin (ng/mL) | 0.331 | 0.203 | 0.738a |
| (0.00–5.108) | (0.00–8.787) | ||
| Hepcidin (ng/mL) | 56.73 | 64.56 | 0,038 a |
| (38.45–140) | (44.31–133.81) | ||
| Ghrelin (ng/mL) | 8.14 | 9.65 | 0,019 a |
| (4.29–100) | (4.86–100) |
Wilcoxon test.
Table 3.
A Comparison of Serum Leptin, Hepcidin, and Ghrelin Levels of Children with IDA Before Treatment and Control
| Before treatment | Controls | P | |
|---|---|---|---|
| Leptin (ng/mL) | 0.331 | 0.151 | 0.163a |
| (0.00–5.108) | (0.00–5.325) | ||
| Hepcidin (ng/mL) | 56.73 | 50.97 | 0.266a |
| (38.45–140) | (34.8–119.9) | ||
| Ghrelin (ng/mL) | 8.14 | 7.41 | 0.152a |
| (4.29–100) | (3.6–10.0) |
Mann–Whitney U‐test.
Table 4.
A Comparison of Serum Leptin, Hepcidin, and Ghrelin Levels of Children with IDA After Treatment and Control
| After treatment | Controls | P | |
|---|---|---|---|
| Leptin (ng/mL) | 0.203 | 0.151 | 0.29a |
| (0.00–8.787) | (0.00–5.325) | ||
| Hepcidin (ng/mL) | 64.56 | 50.97 | 0,008 a |
| (44.31–13.81) | (34.8–119.9) | ||
| Ghrelin (ng/mL) | 9.65 | 7.41 | 0,000 a |
| (4.86–100) | (3.6–10.0) |
Mann–Whitney U‐test.
It was found that the median serum hepcidin level in children with IDA was 56.73 ng/mL (38.4–140 ng/mL) before the treatment, and increased to 64.56 ng/mL (44.31–133.81 ng/mL) after the treatment (P = 0.038; Table 2). The median serum hepcidin level in healthy children was 50.97 ng/mL (34.8–119.9 ng/mL). No statistically significant difference in median hepcidin level was found between healthy children and before treatment in the children with IDA (P = 0.266); however, hepcidin levels in children with IDA who received iron treatment were significantly higher compared to the healthy children (P = 0.008; Tables 3 and 4; Fig. 1).
Figure 1.
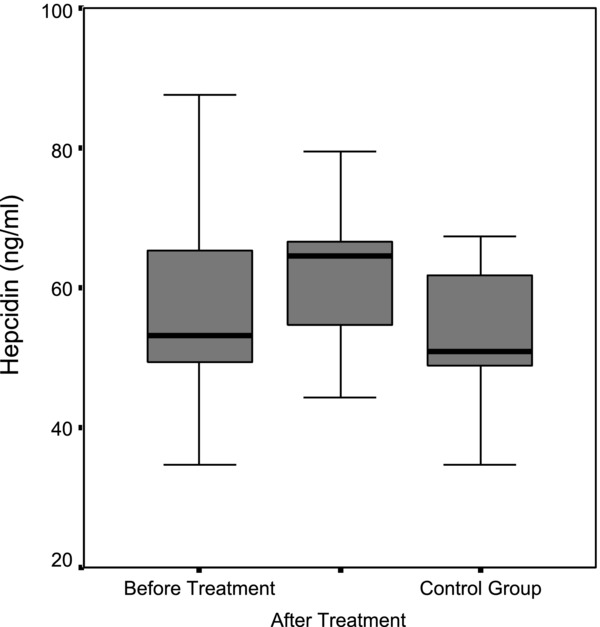
Comparison of median hepcidin levels in the patient group before and after treatment and the control group.
Median serum ghrelin level in children with IDA was 8.14 ng/mL (4.29–100 ng/mL) before the treatment, whereas it is found to increase significantly to 9.65 ng/mL (4.86–100 ng/mL) after the treatment (P = 0.019; Table 2). Median serum ghrelin level in healthy children was 7.41 ng/mL (3.6–10.0 ng/mL). No statistically significant difference was found in median serum ghrelin level before treatment in the children with IDA and healthy children (P = 0.152); however, ghrelin levels in children with IDA after treatment were found to be significantly higher compared to healthy children (P = 0.000; Tables 3 and 4; Fig. 2).
Figure 2.
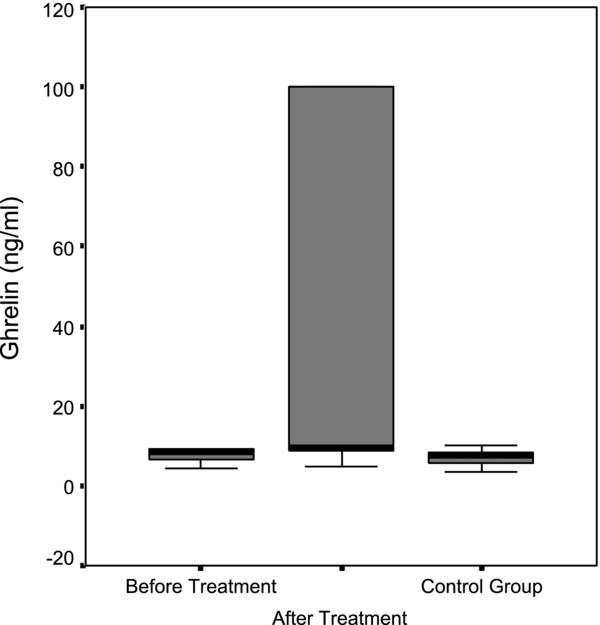
Comparison of median ghrelin levels in the patient group before and after treatment and the control group.
No statistically significant correlation was found between before‐ and after‐treatment levels of serum leptin, hepcidin, and ghrelin (P > 0.05). A statistically significant positive relation was found between after‐treatment ghrelin and leptin levels (r = 0.453, P = 0.012).
A statistically significant positive correlation was found between ferritin and hepcidin levels of children with IDA before the treatment (r = 0.461, P = 0.010).
DISCUSSION
IDA is the most common hematologic disease seen during infants and children and significantly affects performance and quality of life. The most important cause of IDA seen during childhood is inadequate consumption of food containing iron. In addition, increase in iron demand due to rapid growth, blood loss, and malnutrition are the other common causes of IDA.
Hepcidin is a hormone synthesized in the liver. It is stimulated by an increase in plasma iron levels and iron deposits in tissues, and decreases iron release from macrophages and duodenal enterocytes into the plasma, thereby preventing excessive iron absorption and iron accumulation in tissues 7. Its synthesis decreases in anemia, while it increases significantly during infection and inflammation 5. In a study performed by Ulukol et al. 8, serum hepcidin levels of 16 infants with anemia and 54 infants without anemia were analyzed, and serum hepcidin levels of the infant group with anemia were detected as lower than in the healthy children. In a study performed by Semercioglu et al. 9 in 2010, hepcidin levels of the IDA group aged between 1–3 years were also found to be significantly lower compared to the healthy children. Similar to previous published reports, in our study, we compared the condition of children with severe IDA before and after treatment with a healthy children. The median hepcidin level was 56.73 ng/mL (38–140 ng/mL) before treatment, and it increased to 64.56 ng/mL (44.31–133.81 ng/mL) after 3 months of treatment, and statistically significant difference was found between hepcidin levels before and after treatment. Hepcidin values were also higher after treatment in the anemia group compared to healthy children group, and the difference was found to be statistically significant. The higher hepcidin levels observed after treatment in the anemia group compared to both before‐treatment values in the anemia group and the healthy children suggests that iron treatment is an important factor in hepcidin synthesis and its effect is relatively fast.
The study performed by Ulukol et al. 8 on healthy infants aged 4–12 months without anemia and the study performed by Tiker et al. 10 on 16 healthy full‐term and 26 healthy preterm neonates showed a fairly wide physiological distribution of serum hepcidin levels. Our study also showed a wide physiological distribution of serum hepcidin levels with 65 ± 27 ng/mL in the patient group and 64 ± 15 ng/mL in the healthy children.
In the study of Tiker et al. 10, no correlation was found between serum hepcidin level and serum iron, Hb or ferritin levels. In a study performed by Dallalio et al. 11, a very strong correlation was found between serum ferritin levels and hepcidin levels, whereas no significant correlation was found between serum hepcidin levels and Hb or serum iron levels. Our study also showed a statistically significant correlation between serum hepcidin and ferritin levels in the patient group before treatment.
Ghrelin is an appetite‐stimulating anabolic hormone, which plays a role in the consumption and accumulation of energy 12. However, when leptin is given through the peripheral or central route, it causes an increase in energy consumption and decrease in appetite. Ghrelin antagonizes this anorexigenic effect of leptin 13. Our study supports this finding, and a statistically significant positive relation was found between ghrelin levels and leptin levels in the patient group before treatment. Leptin also plays a role within iron metabolism. In a study performed by Chung et al. 14, it was shown that leptin has a similar biological role to that of IL‐6, which stimulates hepcidin production and release. Our study did not find a significant relation between serum leptin and hepcidin levels in the patient and healthy children.
In a study performed by Küçük et al. 15 to analyze the effect of IDA treatment on ghrelin and leptin levels and appetite, ghrelin levels in the anemia group after the treatment were found to be high, although they increased calorie, protein, and carbohydrate intake. Similar to that study, our study also found that ghrelin levels in the patient group were significantly higher after treatment when compared to before‐treatment levels. Consistent with recent studies, in our study, ghrelin levels in the anemia group after treatment were detected to be higher than in the healthy children. These results suggests that unlike in adults, an increase in food intake due to increased appetite as a result of iron treatment may also increase ghrelin levels, or increased ghrelin levels due to iron treatment may increase food intake.
In a study performed by Işgüven et al. 16 on 25 prepubertal children with IDA and a control group of 25 children, it was found that ghrelin levels of the IDA group were lower than in the control group. In our study, we found the lowest ghrelin level in the control group, and this difference may have been due to measurement of ghrelin levels with different working methods or alteration in ghrelin synthesis caused by hunger and calorie intake 17. The same study 16 found that leptin levels do not vary significantly between the groups, like in our study.
The study of Küçük et al. 15 found a significant decrease in leptin levels after the iron treatment. However, plasma leptin levels in our study were 0.331 ng/mL (0.00–5.108 ng/mL) in the anemia group before treatment and 0.203 ng/mL (0.00–8.787 ng/mL) after treatment versus 0.151 ng/mL (0.00–5.325 ng/mL) in the healthy children. The decrease observed in the anemia group after the treatment was not significant compared to the levels before treatment, and there was also no statistically significant correlation between the other groups in regard to leptin levels.
In conclusion, IDA causes various clinical symptoms and biochemical and hematological changes in the body, and it is also associated with various hormones. Serum ghrelin and hepcidin levels increase with iron treatment, and hepcidin levels increase in conjunction with an increase in ferritin. Because it was found that serum ghrelin and hepcidin levels are higher after treatment and higher than in the healthy children, we assume that the iron treatment has an important role in serum hepcidin and ghrelin synthesis. We believe that clarification of this issue will contribute to the evaluation of the potentials of leptin, hepcidin, and ghrelin in diseases associated with iron. We thus believe that the existing data should be improved with more clinical and laboratory studies with the aim of developing new diagnosis and treatment techniques.
ACKNOWLEDGMENT
None of the authors received financial support for this study.
REFERENCES
- 1. Ağaoğlu L. Demir eksikliği anemisi In: Neyzi O, Ertuğrul T, editors. Pediatri, third edition. Tayf Ofset‐ Nobel Tıp Kitabevleri; 2002. p 1051–1054. [Google Scholar]
- 2. Grumbach MM, Styne D. Puberty: Ontogeny, neuroendocrinology, physiology, and disorders In: Larsen PR, Kronenberg HM, Melmed S, Kenneth SP, editors. Williams Textbook of Endocrinology, 10th edition. Philadelphia: W.B. Saunders; 2003. p 1156. [Google Scholar]
- 3. Başol G, Barutçuoğlu B, Erkin Bozdemir A. Demir homeostazının yeni düzenleyicisi hepsidin. Türk Klinik Biyokimya Derg 2007;5:117–125. [Google Scholar]
- 4. Anderson GJ, Darshan D, Wilkins SJ, Frazer DM. Regulation of systemic iron homeostasis: How the body responds to changes in iron demand. Biometals 2007;20:665–674. [DOI] [PubMed] [Google Scholar]
- 5. Ganz T. Hepcidin and its role in regulating systemic iron metabolism. Hematology Am Soc Hematol Educ Program 2006;507:29–35. [DOI] [PubMed] [Google Scholar]
- 6. Saltık‐Temizel İN. İştahsız çocuk. Çocuk Sağlığı ve Hastalıkları Dergisi 2008;51:176–181. [Google Scholar]
- 7. Ganz T. Hepcidin – A regulator of intestinal iron absorption and iron recycling by macrophages. Best Pract Res Clin Haematol 2005;18:171–182. [DOI] [PubMed] [Google Scholar]
- 8. Ulukol B, Orhon FS, Hanoluk A, Akar N. Serum pro‐hepcidin levels in infants with iron deficiency anaemia. Int J Lab Hem 2008;30:546–547. [DOI] [PubMed] [Google Scholar]
- 9. Semercioğlu A. Çocukluk çağında demir metabolizması ve hepsidin. Çukurova Üniversitesi Tıp Fakültesi Çocuk Sağlığı ve Hastalıkları Ana Bilim Dalı, Uzmanlık tezi, Adana, 2010.
- 10. Tiker F, Celik B, Tarcan A, Kilicdag H, Ozbek N, Gurakan B. Serum pro‐hepcidin levels and relationships with iron parameters in healthy preterm and term newborns. Pediatr. Hematol. Oncol 2006;23:293–297. [DOI] [PubMed] [Google Scholar]
- 11. Dallalio G, Fleury T, Means RT. Serum hepcidin in clinical specimens. Br J Haematol 2003;122:996–1000. [DOI] [PubMed] [Google Scholar]
- 12. Aydın S. Grelin hormonunun keşfi: Araştırmaları ve klinik uygulamaları. Türk Biyokimya Dergisi 2007;32:76–89. [Google Scholar]
- 13. Bilgin HM. Ghrelin: Gündemdeki hormon. Dicle Tıp Dergisi 2006;33:268–272. [Google Scholar]
- 14. Chung B, Matak P, McKie AT, Sharp P. Leptin increases the expression of the iron regulatory hormone hepcidin in HuH7 human hepatoma cells. J Nutr 2007;137:2366–2370. [DOI] [PubMed] [Google Scholar]
- 15. Küçük N. Demir eksikliği anemisinde tedavinin, ghrelin ve leptin düzeylerine ve iştaha etkisi. Atatürk Üniversitesi Tıp Fakültesi Çocuk Sağlığı ve Hastalıkları Ana Bilim Dalı, Uzmanlık tezi, Erzurum 2010.
- 16. Işgüven P, Arslanoğlu İ, Erol M, Yıldız M, Adal E, Ergüven M. Serum levels of ghrelin, leptin, IGF‐I, IGFbp‐3, insulin, thyroid hormones and cortisol in prepubertal children with iron deficiency. Endocr J 2007;54:985–990. [DOI] [PubMed] [Google Scholar]
- 17. Nakazato M, Murakami N, Date T, et al. A role for ghrelin in the central regulation of feeding. Nature 2001;409:194–198. [DOI] [PubMed] [Google Scholar]