Abstract
Background
Polymerase chain reaction (PCR) is an extremely sensitive method that often demands optimization, especially when difficult templates need to be amplified. The aim of the present study was to optimize the PCR conditions for amplification of the epidermal growth factor receptor (EGFR) promoter sequence featuring an extremely high guanine‐cytosine (GC) content in order to detect single nucleotide polymorphisms ‐216G>T and ‐191C>A.
Methods
Genomic DNA used for amplification was extracted from formalin‐fixed paraffin‐embedded lung tumor tissue and PCR products were detected by agarose gel electrophoresis.
Results
Results showed that addition of 5% dimethyl sulfoxide (DMSO), as well as DNA concentration in PCR reaction of at least 2 μg/ml, were necessary for successful amplification. Due to high GC content, optimal annealing temperature was 7°C higher than calculated, while adequate MgCl2 concentration ranged from 1.5 to 2.0 mM.
Conclusion
In conclusion, EGFR promoter region is a difficult PCR target, but it could be amplified after optimization of MgCl2 concentration and annealing temperature in the presence of DMSO and the DNA template of acceptable concentration.
Keywords: EGFR, GC‐rich, genotyping, optimization, PCR
INTRODUCTION
Polymerase chain reaction (PCR) is an enzymatic in vitro method for exponential amplification of specific DNA target sequence, affordable and suitable for both basic research and various clinical applications 1. However, the method is extremely sensitive, thus, it could be a considerable challenge to optimize the conditions of the reaction in order to obtain the desired results, especially when difficult templates, such as GC‐rich regions, need to be amplified. Namely, GC‐rich regions, due to formation of stable and complex secondary structures within a DNA template, could block DNA polymerase during PCR reaction and lead to an ineffective amplification 2, 3, 4, 5, 6. PCR technique parameters that could affect its accuracy and efficacy are numerous, including concentration of DNA template, concentration of magnesium ions, PCR thermal cycling conditions, as well as addition and concentration of PCR additives 7, 8. If there is a scientific or clinical need for specific and efficient amplification of GC‐rich DNA template, tuning the PCR reaction could be highly demanding, yet, critically important.
Epidermal growth factor receptor (EGFR) expressed in several epithelial cancers, including lung, breast, bladder, prostate, and colorectal, plays an important role not only in carcinogenesis, but also in the cancer treatment involving tyrosine kinase inhibitors (TKIs) 9, 10, 11. A number of mutations within the EGFR coding gene has been identified, including well‐known nonsynonimous deletion/insertion of exon 19 and point mutations L858R (c.2573T>G, rs121434568) and T790M (c.2369C>T, rs121434569) in exon 21 10, 11, 12, 13. Due to their established clinical significance, EGFR is recognized as a biomarker for the development and implementation of targeted cancer therapies with EGFR‐TKI, such as erlotinib or gefitinib 14, 15.
Previous studies reported several single nucleotide polymorphisms (SNPs) in the transcriptional start site region of the EGFR gene promoter, including ‐216G>T at the Sp1 transcription factor recognition site, and ‐191C>A, located 4 bp upstream of one of the transcriptional start sites 16, 17. Due to their location in a region essential for transcription, these polymorphisms were investigated both in vitro and in vivo for their suggested role in modification of promoter activity and response to EGFR‐TKI therapy. In 2005, Liu et al. 16, employing transient transfection in human cancer and primary cell lines, observed a significantly higher promoter activity and EGFR expression in ‐216T compared to ‐216G allele. In two prospective clinical studies of cancer patients treated with erlotinib 17 or gefitinib 12, ‐216G>T and ‐191C>A were associated with higher frequency of adverse drug reactions, such as rash or diarrhea. Nevertheless, carriers of ‐216T allele had an improved progression‐free survival on gefitinib 12. Similar results were reported by Jung et al. 18, as a higher response rate to gefitinib or erlotinib treatment and longer progression‐free survival corresponded to ‐216G/T compared to G/G genotype. Based on these data, it would not be surprising if the observed potential to predict efficacy and safety of the cancer treatment nominates these two polymorphisms for possible pharmacogenetic biomarkers for EGFR‐TKI activity. However, EGFR promoter region has an extremely high GC content of up to 88% 19, which makes it difficult target for PCR amplification, especially in the clinical setting. The aim of the present study was to optimize the PCR conditions for amplification of the EGFR promoter sequence comprising two SNPs of interest, namely, ‐216G>T and ‐191C>A.
MATERIALS AND METHODS
Samples and DNA Isolation
DNA from formalin‐fixed paraffin‐embedded (FFPE) lung tumor tissue was extracted using the PureLink™ Genomic DNA Kits (Invitrogen/Life Technologies, Carlsbad, CA), according to the manufacturer's recommendations. DNA concentration was measured using Qubit® Fluorometer (Invitrogen/Life Technologies).
Bioinformatic Sequence Analysis
Melting temperature of the primers was calculated as Tm = 4 × (G + C) + 2 × (A + T) 7, and the annealing temperature was determined as Ta = 0.3 × (Tm of primer) + 0.7 × (Tm of product) − 25 20. GC content and CpG nucleotide composition of the template DNA were determined and presented using the bioinformatic tool “EMBOSS CpGPlot/CpGReport/Isochore” program (http://www.ebi.ac.uk/Tools/emboss/cpgplot/), with a sliding window of 100 nucleotides, shifted one nucleotide at a time.
Genotyping Method
Genotyping for ‐216G>T/‐191C>A EGFR polymorphisms was carried out using the polymerase chain reaction ‐ restriction fragment length polymorphism (PCR‐RFLP) method according to Liu et al. 12, but with modifications due to necessity of protocol optimization. In brief, using the primers described in the article, the part of the EGFR promoter region spanning both SNPs was amplified in the PCR reaction on Techne Genius Thermocycler (Techne Ltd, Cambridge, UK).
PCR reactions were run in a final volume of 25 μl. The reaction mix consisted of 1 μl genomic DNA, 0.2 μM of each primer, 0.25 mM of each of the dNTPs, and 0.625 U of TaqDNA polymerase, and it was carried out in 1× PCR buffer. Concentrations of MgCl2 and dimethyl sulfoxide (DMSO) ranged from 0.5 to 2.5 mM, and from 1% to 5%, respectively. The initial denaturation was performed at 94°C for 3 min; followed by 45 cycles of denaturation at 94°C for 30 sec, gradient annealing at 61°C/63°C/65°C/67°C/69°C for 20 sec, and extension at 72°C for 60 sec; and with a final extension at 72°C for 7 min. All reagents used for PCR amplification were purchased from Invitrogen.
PCR products of 197 bp were detected by gel electrophoresis on a 2% agarose gel stained with SYBR® Safe DNA Gel Stain (Invitrogen/Life Technologies) and visualized under blue light on E‐Gel® Safe Imager™ Real‐time Transilluminator (Invitrogen/Life Technologies). To detect ‐216G>T or ‐191C>A, PCR products were later subjected to the restriction enzymes BseRI (New England Biolabs, Ipswich, MA) or Cfr42I (Fermentas/Thermo Fisher Scientific, Vilnius, Lithuania), respectively 12 (data not shown).
Sequencing Analysis
In order to confirm the specificity of PCR amplification, direct sequencing analysis of the obtained PCR products was performed. The PCR products were purified using QIAquick PCR Purification Kit (Qiagen, Germany) and directly sequenced on ABI PRISM® 3100 Genetic Analyzer (Applied Biosystems, Foster City, California). Sequencing was conducted using ABI PRISM® BigDyeTM Terminator v 3.1 Cycle Sequencing Kit (Applied Biosystems, Foster City, California) in both forward and reverse direction, using the same primers that was used for the PCR amplification. Comparison of the obtained sequence with the reference sequence of EGFR promoter region (http://www.ncbi.nlm.nih.gov; GenBank reference: M11234.1) revealed that the PCR amplification was highly specific.
RESULTS
Sequence analysis of the template DNA (Fig. 1) showed that the region is extremely GC rich, with 75.45% G + C content in a sequence of 660 bp (sum C + G = 421). The examined region contains a CpG island region spanning 558 bp (−450/+108 from translation start site), with an observed‐to‐expected ratio of CpG 0.97.
Figure 1.
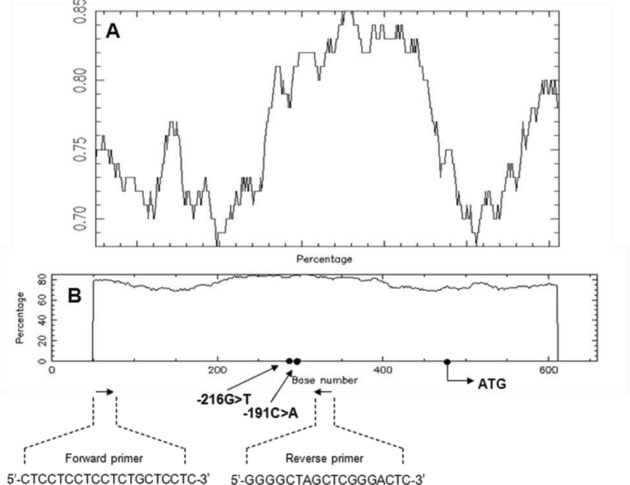
GC content (A) and CpG nucleotide composition (B) of 660 bp epidermal growth factor receptor (EGFR) promoter region.
Sequences and positions of primers used, as well as single nucleotide polymorphisms (SNPs) positions and translation
start site ATG, are indicated in the graph.
To determine the optimal concentration of DMSO, which proved to be necessary for successful amplification, separate PCR reactions were setup with addition of 1%, 3%, and 5% of DMSO. Final concentration of 5% DMSO was the only one to provide the desired amplicon yield without nonspecific amplification (Fig. 2).
Figure 2.
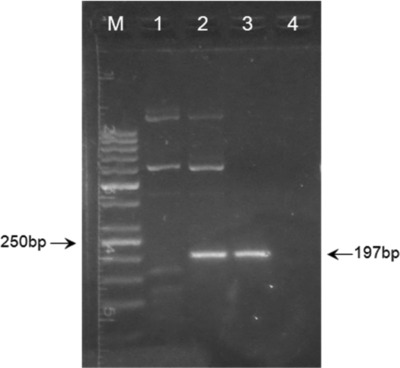
Effects of dimethyl sulfoxide (DMSO) on the polymerase chain reaction (PCR) amplification. Lane M: 50 bp DNA ladder; lane 1: 1% DMSO; lane 2: 3% DMSO; lane 3: 5% DMSO; lane 4: nontemplate control.
The optimal annealing temperature was calculated to 56°C. Using gradient PCR method, five different annealing temperatures, ranging from 61°C to 69°C, were tested. The results revealed the optimal annealing at 63°C (Fig. 3). MgCl2 concentrations ranging from 0.5 to 2.5 mM were tested, resulting in an optimum at 1.5 mM (Fig. 4).
Figure 3.
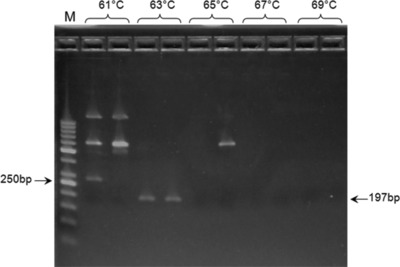
Effects of annealing temperature on the polymerase chain reaction (PCR) amplification. Lane M: 50 bp DNA ladder.
Figure 4.
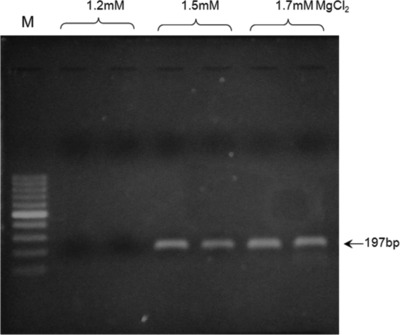
Effects of MgCl2 concentration on the polymerase chain reaction (PCR) amplification. Lane M: 100 bp DNA ladder.
DNA concentrations ranged from 0.25 to 28.20 μg/ml. Under the same conditions, which proved optimal for the templates with higher DNA quantity, samples with DNA concentration of less than 1.86 μg/ml gave no amplification results (Fig. 5).
Figure 5.
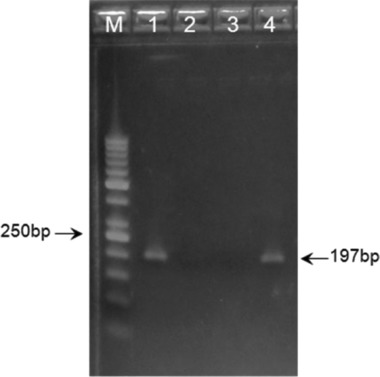
Effects of template DNA concentration on the polymerase chain reaction (PCR) amplification. Lane M: 50 bp DNA ladder; lane 1: 11.3 μg/ml; lane 2: 1.0 μg/ml; lane 3: 1.4 μg/ml; lane 4: 5.7 μg/ml.
DISCUSSION
Concentration of DNA Template
Recognized as “the golden standard” for sample preservation, formalin fixation and paraffin embedding of a tissue has been routinely used for over a century to enable long storage of samples for future investigations 21. These FFPE specimens have been successfully employed in numerous research techniques, including PCR method 22. However, PCR in general require high‐quality DNA as a template, which turned out to be a challenge for extraction from FFPE tissue. Namely, formalin used for tissue fixation often reduce the amount and quality of available DNA by causing formation of nucleoprotein complexes, cross‐linking of nucleic acids with histones, methylene bridging of neighboring amino groups of bases, and further nucleic acid fragmentation 23, 24, 25. Nevertheless, the method of isolation seems not to be of a crucial importance, as comparison of different techniques, including phenol–chloroform protocol, salting out method, and commercial kit application, revealed no significant difference in terms of yield, quality, and length of the extracted DNA 26.
In the present study, DNA was extracted using commercial kit, designed to efficiently isolate genomic DNA from FFPE specimens. The successful amplification was observed only with the DNA concentration of ≥1.86 μg/ml, which corresponded to 1.86 ng of genomic DNA per reaction, or approximately 0.07 μg/ml of the final DNA concentration. The increase in the starting volume of the DNA template did not result in satisfactory amplification, most probably due to accompanying excess in the EDTA‐containing elution buffer residue, which has a potential to inhibit the PCR reaction by chelation of magensium ions 27. In theory, even a single molecule of DNA could be successfully amplified, and the amount of genomic DNA appropriate for PCR has been determined to up to 1 μg 28, 29. Yet, here we dealt with a difficult DNA template, thus, good concentration DNA of at least 2 μg/ml proved to be a baseline condition for successful amplification.
Concentration of Magnesium Ions
MgCl2 concentration has a significant influence on PCR amplification efficacy, serving as an essential cofactor that affects Taq DNA polymerase activity and fidelity, primer annealing, and melting temperatures, as well as the formation of artifacts 7, 28, 30, 31. MgCl2 concentrations in PCR reactions usually range between 0.5 and 2.5 mM, depending on the concentration of both magnesium‐binding reaction components, such as template DNA, primers, and dNTPs, and the residues of chelators, such as EDTA 7. If MgCl2 concentration in the reaction is too high, reaction lacks specificity, while if it is too low, little or no amplification can be expected 7, 32. Therefore, it is recommended that each PCR setup begins with the optimization of MgCl2 concentration, by running several separate reactions of different magnesium molarities.
In the present study, the MgCl2 concentration was tested within the range of 0.5 to 2.5 mM, with the optimum observed at 1.5 mM. Yet, up to 2.0 mM MgCl2 also resulted in satisfactory amplification, so the criteria for the selection were based on the subsequent restriction fragment length polymorphism reactions, which gave best results when performed on PCR products obtained with 1.5 mM MgCl2 concentration (data not shown). The observed range of acceptable molarities was broad most probably due to the presence of enhancer DMSO, which is known to improve the success of PCR reaction even at different MgCl2 concentrations 30.
PCR Conditions: Temperature of Annealing
To optimize the PCR thermal cycling conditions, one has to determine the optimal temperature and length of each of the program segments, as well as the number of cycles. Of those, the most important parameter seems to be the temperature of primer annealing, as even the smallest deviation of 1°C or 2°C could make a difference between specific and nonspecific amplification 8, 29. The primer annealing temperature that is optimal for particular PCR reaction directly depends on the base composition of primers and their sequence length, and is usually around 5°C below the calculated primers melting temperature, defined as the dissociation temperature of the primer/template duplex 7, 33. In general, the annealing temperatures usually range between 55°C and 72°C. However, since the G–C pair is bound by three hydrogen bonds, while A–T pairs by only two, high GC content corresponds to higher melting temperature and requests higher temperature for primer annealing 30, 33.
In the present study, the annealing temperature was calculated to 56°C, but due to the high GC content of the template, the optimum was proposed to be at least 5°C higher. Gradient PCR reaction showed that the optimal annealing temperature for our PCR reaction was 61°C, which was even higher than predicted. As expected 20, annealing at the lower temperature allowed nonspecific amplification, while higher temperatures completely disabled annealing, thus, yielding no PCR products. It could be of interest to mention that “touchdown” approach, which represents the PCR modification that includes progressive lowering of annealing temperature throughout the cycles in order to increase both specificity and yield, was tested as well, but with no success (data not shown).
PCR Additives: DMSO
It has been shown that some PCR reactions, especially those involving GC‐rich template, cannot be optimized solely by adjusting concentration of components or cycling conditions 7, 34, 35. In such cases, PCR additives or cosolvents, including DMSO, glycerol, formamide, and many others, could act as enhancers of amplification, and have been commonly used in research practice to increase yield and specificity of PCR reaction 8, 36, 37, 38, 39. DMSO is a well‐described cosolvent that increases both specificity and productivity of PCR reaction, most probably by decreasing inter‐ or intrastrand reannealing and formation of the problematic secondary structure 7, 37, 40, 41. Consequently, it reduces the melting temperature of the primers and facilitates the PCR product strand separation, providing more efficient amplification 6, 7, 34, 41. It should be taken into account that the concentration of DMSO in the reaction is of ultimate importance, due to its potential to reduce Taq DNA polymerase activity of up to 50% 7, 37.
In the present study, addition of DMSO to the reaction mixture turned out to be essential for successful amplification, and none of the previously described optimization strategies could have been implemented without its presence. Optimal concentration of 5% was determined after testing three different options, and was within the recommended range of 1–10% 7, 28.
CONCLUSION
In conclusion, EGFR promoter region, due to its high GC content, proved to be an extremely difficult PCR target. The optimization of the PCR conditions included determination of optimal MgCl2 concentration and annealing temperature, which, in the presence of 5% DMSO and the DNA template of acceptable concentration, resulted in successful amplification.
This work was supported by the grant No. 175056 of the Ministry of Science and Technology of the Republic of Serbia.
REFERENCES
- 1. Coleman WB, Tsongalis GJ. The polymerase chain reaction In: Coleman WB, Tsongalis GJ, editors. Molecular Diagnostics for the Clinical Laboratorian, edition, Totowa, NJ: Humana Press Inc; 2006. p 47–56. [Google Scholar]
- 2. Hube F, Reverdiau P, Iochmann S, Gruel Y. Improved PCR method for amplification of GC‐rich DNA sequences. Mol Biotechnol 2005;31(1):81–84. [DOI] [PubMed] [Google Scholar]
- 3. Woodford K, Weitzmann MN, Usdin K. The use of K(+)‐free buffers eliminates a common cause of premature chain termination in PCR and PCR sequencing. Nucleic Acids Res 1995;23(3):539. [DOI] [PMC free article] [PubMed] [Google Scholar]
- 4. McDowell DG, Burns NA, Parkes HC. Localised sequence regions possessing high melting temperatures prevent the amplification of a DNA mimic in competitive PCR. Nucleic Acids Res 1998;26(14):3340–3347. [DOI] [PMC free article] [PubMed] [Google Scholar]
- 5. Usdin K, Woodford KJ. CGG repeats associated with DNA instability and chromosome fragility form structures that block DNA synthesis in vitro. Nucleic Acids Res 1995;23(20):4202–4209. [DOI] [PMC free article] [PubMed] [Google Scholar]
- 6. Kang J, Lee MS, Gorenstein DG. The enhancement of PCR amplification of a random sequence DNA library by DMSO and betaine: Application to in vitro combinatorial selection of aptamers. J Biochem Biophys Methods 2005;64(2):147–151. [DOI] [PubMed] [Google Scholar]
- 7. Grunenwald H. Optimization of polymerase chain reactions In: Bartlett JMS, Stirling D, editors. Methods in Molecular Biology. PCR Protocols, second edition, Totowa, NJ: Humana Press Inc; 2003. [DOI] [PubMed] [Google Scholar]
- 8. Roux KH. Optimization and troubleshooting in PCR. Cold Spring Harb Protoc 2009;2009(4):pdb ip66. [DOI] [PubMed] [Google Scholar]
- 9. Sweetman S, ed. Martindale: The Complete Drug Reference 36. London, UK: Pharmaceutical Press; 2009. [Google Scholar]
- 10. Liu W, Wu X, Zhang W, et al. Relationship of EGFR mutations, expression, amplification, and polymorphisms to epidermal growth factor receptor inhibitors in the NCI60 cell lines. Clin Cancer Res 2007;13(22 Pt 1):6788–6795. [DOI] [PubMed] [Google Scholar]
- 11. Kotsakis A, Georgoulias V. Targeting epidermal growth factor receptor in the treatment of non‐small‐cell lung cancer. Expert Opin Pharmacother 2010;11(14):2363–2389. [DOI] [PubMed] [Google Scholar]
- 12. Liu G, Gurubhagavatula S, Zhou W, et al. Epidermal growth factor receptor polymorphisms and clinical outcomes in non‐small‐cell lung cancer patients treated with gefitinib. Pharmacogenomics J 2008;8(2):129–138. [DOI] [PubMed] [Google Scholar]
- 13. Han B, Zhou X, Zhang RX, et al. Mutations of the epidermal growth factor receptor gene in NSCLC patients. Oncol Lett 2011;2(6):1233–1237. [DOI] [PMC free article] [PubMed] [Google Scholar]
- 14. Keedy VL, Temin S, Somerfield MR, et al. American Society of Clinical Oncology provisional clinical opinion: Epidermal growth factor receptor (EGFR) mutation testing for patients with advanced non‐small‐cell lung cancer considering first‐line EGFR tyrosine kinase inhibitor therapy. J Clin Oncol 2011;29(15):2121–2127. [DOI] [PubMed] [Google Scholar]
- 15. Table of Pharmacogenomic Biomarkers in Drug Labels [Internet]. The Food and Drug Administration [updated December 13, 2012]. Available from: http://www.fda.gov/drugs/scienceresearch/researchareas/pharmacogenetics/ucm083378.htm. Accessed on January 4, 2013.
- 16. Liu W, Innocenti F, Wu MH, et al. A functional common polymorphism in a Sp1 recognition site of the epidermal growth factor receptor gene promoter. Cancer Res 2005;65(1):46–53. [PubMed] [Google Scholar]
- 17. Rudin CM, Liu W, Desai A, et al. Pharmacogenomic and pharmacokinetic determinants of erlotinib toxicity. J Clin Oncol 2008;26(7):1119–1127. [DOI] [PMC free article] [PubMed] [Google Scholar]
- 18. Jung M, Cho BC, Lee CH, et al. EGFR polymorphism as a predictor of clinical outcome in advanced lung cancer patients treated with EGFR‐TKI. Yonsei Med J 2012;53(6):1128–1135. [DOI] [PMC free article] [PubMed] [Google Scholar]
- 19. Ishii S, Xu YH, Stratton RH, et al. Characterization and sequence of the promoter region of the human epidermal growth factor receptor gene. Proc Natl Acad Sci USA 1985;82(15):4920–4924. [DOI] [PMC free article] [PubMed] [Google Scholar]
- 20. Rychlik W, Spencer WJ, Rhoads RE. Optimization of the annealing temperature for DNA amplification in vitro. Nucleic Acids Res 1990;18(21):6409–6412. [DOI] [PMC free article] [PubMed] [Google Scholar]
- 21. Magdeldin S, Yamamoto T. Toward deciphering proteomes of formalin‐fixed paraffin‐embedded (FFPE) tissues. Proteomics 2012;12(7):1045–1058. [DOI] [PMC free article] [PubMed] [Google Scholar]
- 22. Ben‐Ezra J, Johnson DA, Rossi J, et al. Effect of fixation on the amplification of nucleic acids from paraffin‐embedded material by the polymerase chain reaction. J Histochem Cytochem 1991;39(3):351–354. [DOI] [PubMed] [Google Scholar]
- 23. Chaw YF, Crane LE, Lange P, Shapiro R. Isolation and identification of cross‐links from formaldehyde‐treated nucleic acids. Biochemistry 1980;19(24):5525–5531. [DOI] [PubMed] [Google Scholar]
- 24. Brutlag D, Schlehuber C, Bonner J. Properties of formaldehyde‐treated nucleohistone. Biochemistry 1969;8(8):3214–3218. [DOI] [PubMed] [Google Scholar]
- 25. Taga M, Eguchi H, Shinohara T, et al. Improved PCR amplification for molecular analysis using DNA from long‐term preserved formalin‐fixed, paraffin‐embedded lung cancer tissue specimens. Int J Clin Exp Pathol 2013;6(1):76–79. [PMC free article] [PubMed] [Google Scholar]
- 26. Mirmomeni MH, Sajjadi Majd S, Sisakhtnezhad S, Doranegard F. Comparison of the three methods for DNA extraction from paraffin‐embedded tissues. Journal of Biological Sciences 2010;10:261–266. [Google Scholar]
- 27. Al‐Soud WA, Radstrom P. Purification and characterization of PCR‐inhibitory components in blood cells. J Clin Microbiol 2001;39(2):485–493. [DOI] [PMC free article] [PubMed] [Google Scholar]
- 28. Kolmodin LA, Birch DE. Polymerase chain reaction. Basic principles and routine practice. Methods Mol Biol 2002;192:3–18. [DOI] [PubMed] [Google Scholar]
- 29. Lo YMD, Chan KCA. Introduction to the polymerase chain reaction In: Lo YMD, Chiu RWK, Chan KCA, editors. Clinical Applications of PCR, second edition, Totowa, NJ: Humana Press; 2006. [Google Scholar]
- 30. Kramer MF, Coen DM. Enzymatic amplification of DNA by PCR: Standard procedures and optimization. Curr Protoc Mol Biol 2001; Chapter 15: Unit 15 11. [DOI] [PubMed] [Google Scholar]
- 31. Innis MA, Gelfand D. Optimization of PCRs In: Innes MA, Gelfand D, Sninsky JJ, White TJ, editors. PCR Protocols. A Guide to Methods and Application, edition, San Diego, CA: Academic Press; 1990. p 3–13. [Google Scholar]
- 32. Miller MC, Cunningham L. Introduction to polymerase chain reaction. Methods Mol Med 1999;22:1–25. [DOI] [PubMed] [Google Scholar]
- 33. Mamedov TG, Pienaar E, Whitney SE, et al. A fundamental study of the PCR amplification of GC‐rich DNA templates. Comput Biol Chem 2008;32(6):452–457. [DOI] [PMC free article] [PubMed] [Google Scholar]
- 34. Sahdev S, Saini S, Tiwari P, et al. Amplification of GC‐rich genes by following a combination strategy of primer design, enhancers and modified PCR cycle conditions. Mol Cell Probes 2007;21(4):303–307. [DOI] [PubMed] [Google Scholar]
- 35. Musso M, Bocciardi R, Parodi S, et al. Betaine, dimethyl sulfoxide, and 7‐deaza‐dGTP, a powerful mixture for amplification of GC‐rich DNA sequences. J Mol Diagn 2006;8(5):544–550. [DOI] [PMC free article] [PubMed] [Google Scholar]
- 36. Sarkar G, Kapelner S, Sommer SS. Formamide can dramatically improve the specificity of PCR. Nucleic Acids Res 1990;18(24):7465. [DOI] [PMC free article] [PubMed] [Google Scholar]
- 37. Hung T, Mak K, Fong K. A specificity enhancer for polymerase chain reaction. Nucleic Acids Res 1990;18(16):4953. [DOI] [PMC free article] [PubMed] [Google Scholar]
- 38. Bachmann B, Luke W, Hunsmann G. Improvement of PCR amplified DNA sequencing with the aid of detergents. Nucleic Acids Res 1990;18(5):1309. [DOI] [PMC free article] [PubMed] [Google Scholar]
- 39. Farell EM, Alexandre G. Bovine serum albumin further enhances the effects of organic solvents on increased yield of polymerase chain reaction of GC‐rich templates. BMC Res Notes 2012;5:257. doi: 10.1186/1756-0500-5-257. [DOI] [PMC free article] [PubMed] [Google Scholar]
- 40. Bookstein R, Lai CC, To H, Lee WH. PCR‐based detection of a polymorphic BamHI site in intron 1 of the human retinoblastoma (RB) gene. Nucleic Acids Res 1990;18(6):1666. [DOI] [PMC free article] [PubMed] [Google Scholar]
- 41. Jensen MA, Fukushima M, Davis RW. DMSO and betaine greatly improve amplification of GC‐rich constructs in de novo synthesis. PLOS ONE 2010;5(6):e11024. doi: 10.1371/journal.pone.0011024. [DOI] [PMC free article] [PubMed] [Google Scholar]


