

Abstract
Background
Blood neutrophil‐to‐lymphocyte (N/L) ratio is an indicator of the overall inflammatory status of the body, and an alteration in N/L ratio may be found in ulcerative colitis (UC) patients. The aims of this study were to investigate the utility of N/L ratio as a simple and readily available predictor for clinical disease activity in UC. J. Clin. Lab. Anal. 27:72–76, 2013. © 2012 Wiley Periodicals, Inc.
Methods
Twenty‐six patients and 28 healthy controls were enrolled in the study. The neutrophil and lymphocyte counts were recorded, and the N/L ratio was calculated from these parameters. The extent of disease classified according to the Montreal classification, clinical disease activity was evaluated using a modified Truelove–Witts severity index, and endoscopic disease activities were classified according to Schroder et al.
Results
The serum N/L ratios of active patients were significantly higher than those of inactive UC and controls (P < 0.001). The optimum N/L ratio cut‐off point for active UC was 2.47. There was no significant difference between inflammation parameters, disease extension, and disease activity.
Conclusion
Our results demonstrate that N/L ratio is higher in patients with active UC compared with controls and UC patients in remission and a cut‐off value of 2.47 can be used to identify patients with active ulcerative colitis.
Keywords: Neutrophil‐to‐lymphocyte ratio, ülcerative colitis, noninvasive monitoring
INTRODUCTION
Ulcerative colitis (UC) is a chronic inflammatory disease causing continuous mucosal inflammation with an unknown precise etiology 1, 2. It is known as an incurable disease with patients usually requiring lifelong medication. Although the development of biologic agents has led to new therapeutic options in recent years, surgery continues to play an important role in the therapeutic alternative approach in severe UC 3. It is important to determine disease activity early as this will significantly reduce the surgery rate, and therefore reduce mortality in patients with serious UC 4. Noninvasive markers, such as C‐reactive protein (CRP), erythrocyte sedimentation rate (ESR), white blood cells (WBCs), fecal calprotectin, and polymorphonuclear neutrophil elastase are widely acknowledged as important, both for initial diagnosis and for precisely monitoring disease activity in UC 5, 6. Nevertheless, an optimal test has not yet been developed. Therefore, the adjunctive use of additional serum markers may add a significant advantage for predicting disease severity and achieving diagnostic precision.
Blood neutrophil‐to‐lymphocyte (N/L) ratio is a simple marker of subclinical inflammation that can be easily obtained from the differential WBC count. The N/L ratio has been used to predict outcomes in patients with cancer and coronary artery disease 7, 8. We can obtain information about two different immune pathways from the N/L ratio. First of all about the neutrophils that are responsible for lasting inflammation and the second about the lymphocytes that demonstrate the regulatory pathway 9, 10.
Thus, the N/L ratio is an indicator of the overall inflammatory status of the body, and an alteration in N/L ratio may be found in UC patients with active disease. The aims of this study were to investigate the utility of N/L ratio as a simple and readily available predictor for clinical disease activity in UC and also to determine the association between N/L ratio with the disease widespread and endoscopic severity.
MATERIALS AND METHODS
Patients
Twenty‐six patients with UC (18 male and 8 female) and 28 healthy controls (10 male and 18 female) attending the Gastroenterology Clinic of Erciyes University Hospital between March 2010 and September 2011 were enrolled in the study. The diagnosis of UC was based on standard clinical, radiological, endoscopic, and histological criteria. Patients’ age, disease duration, drug intake, and other medical history were all noted for each subject. Complete blood count, ESR, and CRP were established for both patients and controls. The WBC, neutrophil, and lymphocyte counts were recorded, and the N/L ratios were calculated from these parameters. All of these parameters were determined again after disease remission was achieved in active UC patients. All UC patients underwent colonoscopy at study entry.
The endoscopic disease activities of UC patients were classified according to Schroder et al. 11. Based on initial colonoscopic examination, patients were divided into three subgroups with mild disease (erythema, decreased vascular pattern, mild friability), moderate disease (marked erythema, absent vascular pattern, friability, erosions), and severe disease (spontaneous bleeding, ulceration). Clinical disease activity was evaluated using a modified Truelove–Witts severity index (MTWSI) and details are shown in Table 1 2, 12, 13. Clinical active disease was defined as an estimated MTWSI score of 4 or higher and patients with a lower score than 4 were considered in to be remission (inactive). The extent of the disease was classified according to the Montreal classification 1. If limited to the rectum, it was defined as ulcerative proctitis; involvement up to the splenic flexure was defined as left sided colitis; and involvement extends proximal to the splenic flexure was defined as extensive UC.
Table 1.
Demographic Characteristics of Control Group and UC Patients
| Variables | Control (n = 28) | UC (n = 26) | P |
|---|---|---|---|
| Sex (male/female) | 10(35.7)/18(64.3) | 18(69.2)/8(30.8) | 0.028 |
| Age (years) | 44.50 ± 8.92 | 44.88 ± 13.23 | 0.900 |
| Disease duration (years) | ‐ | 2.75(1.03–6.00) | ‐ |
Values are expressed as n (%), mean ± SD, or median (25th and 75th percentiles).
Statistical Analyses
Shapiro–Wilk's and Levene's tests were used to test the normality and variance homogeneity of data. Independent‐samples t‐test, paired t‐test, one‐way analysis of variance parametric tests, and Mann–Whitney U, Wilcoxon‐t, and Kruskal–Wallis H nonparametric tests were used for the comparison of continuous variables and chi‐square analysis was used for categorical variables. Tukey and Tamhane's T2 tests were used for multiple comparisons. Values are expressed as frequencies and percentages, mean ± standard deviation or median and 25th–75th percentiles. Receiver operating characteristic (ROC) curves were constructed for the WBC, CRP, Sedimentation, and N/L variables, and the areas under the ROC curve values with 95% CIs were calculated and compared with each other. Optimal cut‐off values were determined, sensitivity, specificity, positive predictive rate, negative predictive rate, and accuracy rate diagnosing measures were calculated with (95% CI) and Kappa tests were performed for each variable. Analysis was conducted using MedCalc (Version 9.2.0.1) and SPSS 15.0 (SPSS Inc., Chicago, IL) softwares by considering P < 0.05 as significantly different.
RESULTS
Twenty‐six patients with UC and 18 control subjects were enrolled in the present study. There were 8 females and 18 males in the UC group and 18 females and 10 males in the control group (P = 0.028). The median disease duration in UC patients was 2.75 years. The demographic characteristics of patients and control subjects are summarized in Table 1. There was no statistically significant difference between the ages of the study participants. The mean N/L ratios of the control, inactive, and active UC patients were 1.77 ± 0.68, 2.40 ± 1.05, and 3.18 ± 1.76, respectively (P < 0.001). The serum N/L ratios of active patients were significantly higher than those of inactive UC and controls. While the serum neutrophil count increases in active patients unlike in inactive patients and controls, the serum lymphocyte count decreases, respectively (Fig. 1). Table 2 shows the serum N/L ratio and other laboratory values of the study participants. ROC curve analysis suggested that the optimum N/L ratio cut‐off point for active UC was 2.47, with sensitivity, specificity, PPV, and NPV of 53.9% (33.4–73.4), 63.2% (38.4–83.7), 66.7% (43.0–85.4), and 50.0% (29.1–70.9), respectively (Fig. 2). The overall accuracy of the N/L ratio in determination of active UC was 57.8%. The same analyses for other inflammation markers are summarized in Table 3. There was no significant pair wise difference for AUC values (P > 0.05).
Figure 1.
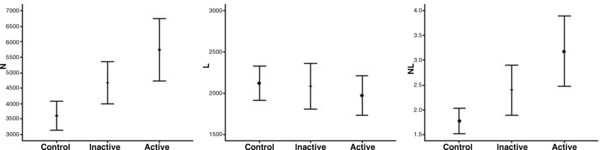
Box‐plots to display the variation of serum N, L, and N/L ratio values between control and UC patients.
Table 2.
Comparison of Inflammation Markers Between Groups of Disease Activity
| Variables | Control (n = 28) | Inactive UC (n = 26) | Active UC (n = 26) | P |
|---|---|---|---|---|
| WBC (/mm3) | 6,530.36 ± 1,461.91a | 7,535.79 ± 1,672.55a, b | 8,152.16 ± 3,016.71b | 0.028 |
| CRP (mg/l) | 3.34 (3.34–3.34)a | 3.08 (3.41–3.62)a | 6.11 (3.41–21.93)b | <0.001 |
| Sedimentation (mm/hr) | 15.50 (10.25–20.75)a | 17.00 (11.00–36.00)a, b | 34.50 (14.75–57.00)b | 0.004 |
| N/L ratio | 1.77 ± 0.68a | 2.40 ± 1.05a, b | 3.18 ± 1.76b | <0.001 |
Values are expressed as mean ± SD or median (25th and 75th percentiles). Different subscripts in a row indicate statistically significance difference.
Figure 2.
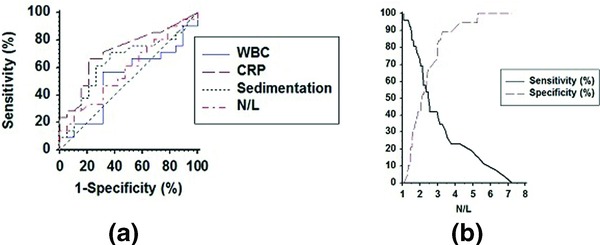
(a) Comparison of ROC curves among WBC, CRP, sedimentation, and N/L ratio variables. AUC values were 0.52(0.36–0.68), 0.72(0.55–0.85), 0.64(0.48–0.79), 0.59(0.42–0.74), respectively, and there was not any significant pair wise difference for AUC values (P > 0.05). (b) Determination of the optimal cut‐off value for N/L ratio.
Table 3.
Diagnosing Measures and Kappa Test Results of WBC, CRP, Sedimentation, and N/L Variables for the Determined Cut‐Off Values in the Detection of Ulcerative Collitis Activity
| Variables and cut‐off values | Diagnosing measures | Kappa test | |||||
|---|---|---|---|---|---|---|---|
| SEN (95%CI) | SPE (95%CI) | PPR (95%CI) | NPR (95%CI) | AR (95%CI) | κ | P | |
| WBC (>9,350/mm3) | 32.0 (15.0–53.5) | 84.2 (60.4–96.6) | 72.7 (39.0–94.0) | 48.5 (30.8–66.5) | 54.6 (38.9–69.6) | 0.149 | 0.219 |
| CRP (>3.62 mg/l) | 66.7 (44.7–84.4) | 73.7 (48.8–90.9) | 76.2 (52.8–91.8) | 63.6 (40.7–82.8) | 69.8 (53.9–82.8) | 0.397 | 0.009 |
| Sedimentation (>25 mm/hr) | 62.5 (40.6–81.2) | 68.4 (43.5–87.4) | 71.4 (47.8–88.7) | 59.1 (36.4–79.3) | 65.1 (49.1–79.0) | 0.304 | 0.044 |
| N/L (>2.47) | 53.9 (33.4–73.4) | 63.2 (38.4–83.7) | 66.7 (43.0–85.4) | 50.0 (29.1–70.9) | 57.8 (42.2–72.3) | 0.164 | 0.259 |
SEN, sensitivity; SPE, specifity; PPR, positive predictive rate; NPR, negative predictive rate; AR, accuracy rate.
Ten patients were classified as having extensive disease and 16 patients as left sided according to the endoscopic examination on study entry. On the initial examination, only one patient was classed as having proctitis and this patient was included in the left‐sided group to compare inflammation parameters between two groups in active disease. There was no significant difference between inflammation parameters and disease extension (P > 0.05; Table 4).
Table 4.
Comparison of Inflammation Markers and Disease Extension in Active Disease
| Variables | Left side (n = 16) | Extensive (n = 10) | P |
|---|---|---|---|
| WBC (/mm3) | 7,700.88 ± 3,177.75 | 8,954.44 ± 2,690.03 | 0.329 |
| CRP (mg/l) | 5.30 (3.36–13.43) | 8.62 (5.16–37.35) | 0.192 |
| Sedimentation (mm/hr) | 26.00 (10.00–48.00) | 46.00 (28.00–72.50) | 0.108 |
| N/L ratio | 2.79 ± 1.57 | 3.81 ± 1.96 | 0.155 |
Values are expressed as mean ± SD or median (25th and 75th percentiles).
The endoscopic disease activity was mild in four, moderate in 17, and severe in 5 patients at the initial endoscopic examination. We compared the inflammation markers and disease activity in active disease and did not find any significant association (P > 0.05; Table 5).
Table 5.
Comparison of Inflammation Markers and Endoscopic Disease Activity in Active Disease
| Variables | Mild (n = 4) | Moderate (n = 17) | Severe (n = 5) | P |
|---|---|---|---|---|
| WBC (/mm3) | 8,592.50 ± 3,008.75 | 8,137.75 ± 3,438.03 | 7,846.00 ± 1,782.32 | 0.939 |
| CRP (mg/l) | 4.23 (3.16–6.81) | 5.74 (3.41–29.80) | 13.90 (7.98–46.50) | 0.129 |
| Sedimentation (mm/hr) | 26.00 (10.00–40.00) | 42.50 (12.50–64.50) | 29.00 (23.50–65.50) | 0.700 |
| N/L ratio | 2.40 ± 0.72 | 3.17 ± 1.63 | 3.85 ± 2.71 | 0.558 |
Values are expressed as mean ± SD or median (25th and 75th percentiles).
DISCUSSION
The main finding of our study relates to the identification of the N/L ratio as a novel noninvasive marker of disease severity in patients with UC. Our results demonstrate that N/L ratio is higher in patients with active UC compared with controls and UC patients in remission and a cut‐off value of 2.47 can be used to identify patients with active UC. High levels of N/L ratio in the sera of active UC patients, compared to inactive UC and controls, support the view that neutrophils may have a role in the inflammatory cascade of UC and disease pathophysiology.
Endoscopic examination, histologic findings, and radiological imaging modalities are commonly used to monitor intestinal inflammation. A great number of methods have also been assessed in different studies as potential noninvasive/invasive markers for UC diagnosis and for determining disease activity 14, 15. Although novel disease specific biomarkers have been identified, most of them are time consuming and expensive. Unfortunately the role of N/L ratio in UC has not been clearly elucidated until now.
Elevated levels of N/L ratio were also found to be associated with poor survival in patients after percutaneous coronary intervention and in those undergoing coronary artery bypass graft 7, 16. Many cancer survival studies have suggested that the N/L ratio is a significant predictor of overall and disease specific survival of patients 8, 17, 18. The N/L ratio is correlated with disease severity in patients with nonalcoholic fatty liver disease 19. It is superior to total WBC in predicting adverse outcomes of acute pancreatitis 20. N/L ratio could be an important measure of systemic inflammation as it is cost effective, readily available, and can be calculated easily. During the preparation of this article, a study was concluded that patients with active UC have elevated N/L ratios similar to our findings 21. Torun et al. found optimum cut‐off value of 2.16 to indicate active disease with a higher sensitivity, specificity, positive predictive, and negative predictive value of 81.8%, 80.5%, 86.8%, and 73.8%, respectively 21. Moreover from Torun et al., in the present study, we evaluated the relation of N/L ratio with the disease extension and the endoscopic disease activity and did not find any significant association. Due to the lack of detailed knowledge, the current study was conducted to investigate the N/L ratio as a measure of systemic inflammation and its relationship with disease activity. Our study showed that N/L ratio is higher in patients with active UC compared with controls and UC patients in remission.
Physiological malfunction of the intestinal epithelium leads to the infiltration of bacteria and their components and the recruitment of neutrophils mediating inflammatory bowel disease 22, 23. Neutrophil accumulation and abscess formation within intestinal crypts at the apical epithelial surface is a pathological feature of UC 22. In the present study increased N/L ratio in active UC patients confirms the key role of neutrophils in the inflammation process.
The study has some limitations including, (i) the cross‐sectional design and the relatively small sample size, and (ii) our study was not designed to elucidate the mechanistic pathways that lead to higher N/L ratio in patients with UC.
In summary, our study demonstrates that in patients with UC, the N/L ratio is strongly associated with active disease. Unlike many other noninvasive markers of UC, the N/L ratio is inexpensive and readily available. Although the accuracy of the N/L ratio for detecting active UC is suboptimal, the ratio is an easily derived measure that might, in combination with other markers, assist in identifying patients at increased risk of active and severe disease. Future studies are needed to externally cross‐validate our findings in a larger cohort of UC patients.
CONFLICT OF INTEREST
None.
Financial Support: None
REFERENCES
- 1. Silverberg MS, Satsangi J, Ahmad T, et al. Toward an integrated clinical, molecular and serological classification of inflammatory bowel disease: Report of a Working Party of the 2005 Montreal World Congress of Gastroenterology. Can J Gastroenterol 2005;19(Suppl A):5–36. [DOI] [PubMed] [Google Scholar]
- 2. Stange EF, Travis SPL, Vermeire S, et al. European evidence‐based consensus on the diagnosis and management of ulcerative colitis: Definitions and diagnosis. J Crohn's Colitis 2008;2:1–23. [DOI] [PubMed] [Google Scholar]
- 3. Solberg IC, Lygren I, Jahnsen J,, et al. IBSEN Study Group . Clinical course during the first 10 years of ulcerative colitis: Results from a population‐based inception cohort (IBSEN Study). Scand J Gastroenterol 2009;44:431–40. [DOI] [PubMed] [Google Scholar]
- 4. Caprilli R, Viscido A, Latella G. Current management of severe ulcerative colitis. Nat Clin Pract Gastroenterol Hepatol 2007;4:92–101. [DOI] [PubMed] [Google Scholar]
- 5. Sandborn WJ, Loftus EV Jr, Colombel JF, et al. Evaluation of serologic disease markers in a population‐based cohort of patients with ulcerative colitis and Crohn's disease. Inflamm Bowel Dis 2001;7:192–201. [DOI] [PubMed] [Google Scholar]
- 6. Vermeire S, Van Assche G, Rutgeerts P. Laboratory markers in IBD: Useful, magic, or unnecessary toys? Gut 2006;55:426–431. [DOI] [PMC free article] [PubMed] [Google Scholar]
- 7. Duffy BK, Gurm HS, Rajagopal V, Gupta R, Ellis SG, Bhatt DL. Usefulness of an elevated neutrophil to lymphocyte ratio in predicting long‐term mortality after percutaneous coronary intervention. Am J Cardiol 2006;97:993–996. [DOI] [PubMed] [Google Scholar]
- 8. Halazun KJ, Hardy MA, Rana AA, et al. Negative impact of neutrophil‐lymphocyte ratio on outcome after liver transplantation for hepatocellular carcinoma. Ann Surg 2009;250:141–151. [DOI] [PubMed] [Google Scholar]
- 9. Avanzas P, Quiles J, Lopez de Sa E, et al. Neutrophil count and infarct size in patients with acute myocardial infarction. Int J Cardiol 2004;97:155–156. [DOI] [PubMed] [Google Scholar]
- 10. Ommen SR, Hodge DO, Rodeheffer RJ, McGregor CG, Thomson SP, Gibbons RJ. Predictive power of the relative lymphocyte concentration in patients with advanced heart failure. Circulation 1998;97:19–22. [DOI] [PubMed] [Google Scholar]
- 11. Schroeder KW, Tremaine WJ, Ilstrup DM. Coated oral 5‐aminosalicylic acid therapy for mildly to moderately active ulcerative colitis. A randomized study. N Engl J Med 1987;317(26):1625–1629. [DOI] [PubMed] [Google Scholar]
- 12. Lichtiger S, Present DH, Kornbluth A, et al. Cyclosporine in severe ulcerative colitis refractory to steroid therapy. N Engl J Med 1994;330:1841–1845. [DOI] [PubMed] [Google Scholar]
- 13. D'Haens G, Sandborn WJ, Feagan BG, et al. A review of activity indices and efficacy end points for clinical trials of medical therapy in adults with ulcerative colitis. Gastroenterology 2007;132:763–786. [DOI] [PubMed] [Google Scholar]
- 14. Bruining DH, Loftus EV. Current and future diagnostic approaches: From serologies to imaging. Curr Gastroenterol Rep 2007;9:489–496. [DOI] [PubMed] [Google Scholar]
- 15. Bitton A, Peppercorn MA, Antonioli DA, et al. Clinical, biological, and histologic parameters as predictors of relapse in ulcerative colitis. Gastroenterology 2001;120:13–20. [DOI] [PubMed] [Google Scholar]
- 16. Gibson PH, Croal BL, Cuthbertson BH, et al. Preoperative neutrophil‐lymphocyte ratio and outcome from coronary artery bypass grafting. Am Heart J 2007;154:995–1002. [DOI] [PubMed] [Google Scholar]
- 17. Walsh SR, Cook EJ, Goulder F, Justin TA, Keeling NJ. Neutrophil‐lymphocyte ratio as a prognostic factor in colorectal cancer. J Surg Oncol 2005;91:181–184. [DOI] [PubMed] [Google Scholar]
- 18. Sarraf KM, Belcher E, Raevsky E, Nicholson AG, Goldstraw P, Lim E. Neutrophil/lymphocyte ratio and its association with survival after complete resection in non‐small cell lung cancer. J Thorac Cardiovasc Surg 2009;137:425–428. [DOI] [PubMed] [Google Scholar]
- 19. Alkhouri N, Morris‐Stiff G, Campbell C, et al. Neutrophil to lymphocyte ratio: A new marker for predicting steatohepatitis and fibrosis in patients with nonalcoholic fatty liver disease. Liver Int 2012;32(2):297–302. [DOI] [PubMed] [Google Scholar]
- 20. Azab B, Jaglall N, Atallah JP, et al. Neutrophil‐lymphocyte ratio as a predictor of adverse outcomes of acute pancreatitis. Pancreatology 2011;11(4):445–452. [DOI] [PubMed] [Google Scholar]
- 21. Torun S, Tunc BD, Suvak B, et al. Assessment of neutrophil lymphocyte ratio in ulcerative colitis: A promising marker in predicting disease severity. Clin Res Hepatol Gastroenterol 2012;36(5):491–497. [DOI] [PubMed] [Google Scholar]
- 22. Gewirtz AT, Liu Y, Sitaraman SV, Madara JL. Intestinal epithelial pathobiology: Past, present and future. Best Pract Res Clin Gastroenterol 2002;16(6):851–867. [DOI] [PubMed] [Google Scholar]
- 23. Qin X. Etiology of inflammatory bowel disease: A unified hypothesis. World J Gastroenterol 2012;18(15):1708–1722. [DOI] [PMC free article] [PubMed] [Google Scholar]