

Abstract
Background
Several studies have reported that leptin levels, the leptin/adiponectin (L/A) ratio and carbohydrate antigen (CA) 15‐3 are especially elevated in breast cancer patients with high body mass index (BMI). The purpose of this study was to evaluate BMI, leptin, L/A ratio and CA 15‐3 all together as reliable biomarkers for breast cancer. J. Clin. Lab. Anal. 27:12–20, 2013. © 2012 Wiley Periodicals, Inc.
Methods
Serum levels of leptin, adiponectin and CA 15‐3, as well as anthropometric and biochemical parameters were analysed in 88 female patients who participated in a mammography study. Predictive values of BMI, leptin, L/A ratio and CA 15‐3 were determined with a 95% confidence interval.
Results
Women were diagnosed with either breast cancer (n = 40) or benign breast lesions (n = 48). Among anthropometric parameters, age (P ≤ 0.001), weight (P ≤ 0.05) and waist circumference (P ≤ 0.02) were higher in patients with breast cancer than in patients without this pathology. The 75th percentile values for BMI, leptin, L/A ratio and CA 15‐3 were 29.24 kg/m2, 26.65 ng/ml, 2.37 and 18.45 IU, respectively. The suggested odds ratio for breast cancer patients with the values that were above the 75th percentile of the tetrad was 6.7 (0.7505–60.0665 confidence interval).
Conclusion
When the four variables were analysed together, a sensitivity of 83.3%, specificity of 80%, positive predictive value of 83.3% and negative predictive value of 80% were obtained. Results indicate that using the 75th percentile set points for BMI, leptin, L/A ratio and CA 15‐3 together could offer a reliable approach to determine which women are at high risk for developing breast cancer.
Keywords: biomarker, BMI, breast cancer, leptin, CA 15‐3
INTRODUCTION
In Mexico in 2006, 71.9% of women were either overweight or obese. Several epidemiological studies have shown that obesity is a major risk factor for the development of many types of cancer such as endometrial cells 1, hepatocellular carcinoma 2, colon 3, 4 and breast cancer 5 in postmenopausal women 5, 6, 7, 8.
The relationship between obesity and breast cancer has made these diseases a challenge for both Mexican women and the healthcare system 9, 10, 11. In this regard, the incidence of breast cancer has recently shown an increasing trend. This was especially true in the State of Mexico, where the prevalence of breast cancer was 7.63 per 100,000 women in 2007 12, and by 2008, in the entire country of Mexico, 13,700 new cases of breast cancer were reported. By 2009, there were 4,854 breast cancer related deaths in women aged 25 and older, which figures out to 13 deaths per day from this disease.
It is well known that there are several biomarkers associated with increased risk of breast cancer, including high levels of leptin and low levels of adiponectin, suggesting that the leptin/adiponectin (L/A) ratio should be useful in determining breast cancer risk 4, 5, 6, 13, 14, 15, 16, 17, 18, 19, 20, 21, 22, 23, 24, 25, 26, 27, 28.
Several studies suggest that leptin, a proinflammatory adipocytokine 29, may act as a growth factor, promoting the development of breast tissue carcinogenesis. As leptin levels are directly related to body mass index (BMI), it is important to study leptin in breast cancer to identify the mechanism by which this hormone induces the development of malignant cells. New therapeutic targets could then be identified and directed against the action of leptin in neoplastic cells. The obRb leptin receptor activates the JAK2/STAT3 (where JAK is janus kinase and STAT is signal transducer and activator of transcription) signalling pathway, which induces the phenomena of cellular immortality, proliferation and invasion 12, 30.
A study by Sun Hee concluded that patients with breast cancer who had elevated levels of leptin, but lacked expression of its receptor in biopsied tissue samples, showed increased survival rates. This study also showed that there is little correlation between the expression of leptin and its receptor with variables such as histological grade of the lesion (N and T status according to the American Joint Committee on Cancer (AJCC), human epidermal growth factor receptor 2 (HER‐2), B‐cell lymphoma 2 (bcl‐2) and p53 expression. However, a significant correlation was found between the expression of leptin and its receptor and Ki‐67 antigen expression, a finding that supports the idea of leptin being a carcinogenesis‐inducing factor 31. This study showed the relationship between the oestrogen receptor (ER) and leptin and its receptors in the development and progression of breast cancer.
In contrast to leptin, adiponectin decreases as BMI increases and has the opposite effect of leptin in breast cancer cells, inhibiting their growth and promoting their apoptosis. The expression of the adiponectin receptor in the neoplastic cells of breast tissue is extremely important in regulating the effects of leptin in these cells 15, 17, 32.
In a study by Jarde, adiponectin was found to inhibit MCF‐7 cell growth and induce the expression of the adiponectin receptors AdipoR1 and AdipoR2a as well as decrease the expression of leptin and its receptors in these neoplastic cells. This study demonstrated that both hormones are antagonistic to the development of breast cancer 33, which suggests that the L/A ratio could be used as a biomarker for breast cancer.
Evidence suggests that the carbohydrate antigen (CA) 15‐3 is found in high concentrations in women with metastatic breast cancer that are independent of standard prognostic factors. High levels of CA 15‐3 have also been associated with poor prognosis because this biomarker is associated with micrometastases, or hidden metastases, which are not detectable by conventional methods. This tumour marker is both easy to measure and relatively inexpensive. However, one of the disadvantages of CA 15‐3 as a breast cancer biomarker is its low specificity 34. The aim of this study was to evaluate whether the tetrad BMI, leptin, L/A ratio and CA 15‐3 is useful as a breast cancer biomarker.
MATERIALS AND METHODS
Study Design
This study was a cross‐sectional prospective study conducted at the Maternal‐Perinatal Hospital “Mónica Pretelini” (HMPMP), State of Mexico Health Institute (ISEM), Toluca, Mexico, from January to October 2011.
Patients
Women were recruited from the imagenology service of the HMPMP.
Inclusion criteria
Female patients participating in a mammography study with an average age of 40–50 years were included in the study.
Exclusion criteria
Patients undergoing hormonal therapy were excluded from the study.
Sample calculation
Accepting an alpha risk of 0.05 and a beta risk of 0.2 in a bilateral contrast, 36 subjects per group were required to detect an odds ratio (OR) of 5. A proportion of 0.3 positive cases were assumed in one of the groups. The estimation of losses was 0.1 7.
Anthropometric measures
We measured weight (kg), height (m; Seca, GmbH, Germany) and waist circumference (cm) of all study participants. Women were classified by BMI as (a) normal weight (BMI < 24.9 kg/m2), (b) overweight (24.9 kg/m2 < BMI < 29.9 kg/m2), (c) obese (BMI > 30 kg/m2).
Laboratory
Blood samples (BD Vacutainer®, Franklin Lakes, NJ) were taken and centrifuged to separate serum from cellular material. We measured circulating blood levels of glucose (mg/dl), cholesterol (mg/dl), triglycerides (mg/dl) and uric acid (mg/dl) in all patients. By enzymatic methods, we determined levels of low‐density lipoprotein cholesterol (LDLC, mg/dl), high‐density lipoprotein cholesterol (HDLC, mg/dl) (Ximola, Randox) and haemoglobin (g/dl; Act diff, Beckman Coulter). All these tests were conducted at the Medical Research Center (CICMED), Autonomous University of the State of Mexico (UAEMex) according to standardised protocols recommended by the International Federation of Clinical Chemistry and Laboratory Medicine (IFCC).
Serum concentrations of adiponectin and leptin were measured using an enzyme‐linked immunosorbent assay (ELISA) according to the manufacturer's instructions (GenWay Biotech. Inc.; Adiponectin reference 40‐055‐200002 and Leptin reference 40‐055‐200004). CA 15‐3 levels were determined using an electrochemiluminescence immunoassay (Modular Analytics E170, Roche).
Mammography
Mammograms (Hologic LORAD Seleniatm) were performed in the morning after completing a risk factor questionnaire.
Biopsy
Women were categorised according to the Breast Imaging Reporting and Data System (BI‐RADS) score and St Gallen criteria. Biopsies were taken using the ultrasound‐guided (Voluson E8, GE Healthcare) tru‐cut biopsy technique (Angiotech Pharmaceuticals, Inc., Canada).
Pathology
Haematoxylin and eosin (HE) staining was performed on paraffin‐embedded biopsied tissue sections. Immunohistochemical analysis of the cancer tissue was conducted at the Pathology Service of the State Cancer Center (COE), ISSEMYM. If the tissue samples were determined to be positive for cancer, immunohistochemical analysis (Ventana BenchMark, Ventana Medical Systems Inc., Tucson, AZ) was performed. Tissue sections (4 μm) were formalin‐fixed (fixation time 6–8 h), paraffin‐embedded and analysed for the presence of the ER (anti‐ER, 1DS clone), progesterone receptor (PR; anti‐PgR, RBT22 clone) and HER‐2/neu (c‐erb‐2 clone, her‐2/neu).
Ethics
This study was approved by the ethics committees of the HMPMP and the CICMED and was carried out according to the ethical standards of the Helsinki Declaration of 1964. Informed consent was obtained from all patients.
Statistical Analysis
Statistical analysis was performed using SPSS 20.0 software. We used parametric or non‐parametric tests as required by the variable distribution. The correlation coefficients (r) were determined by Pearson and Spearman tests for normal or skewed variables, respectively. Finally, we performed the analysis with receiver operator characteristic (ROC) and the area under the curve (AUC) analyses for leptin levels, L/A ratio, CA 15‐3 levels and BMI. Predictive values were obtained using the Bayes theorem. Ransohoff and Feinstein methods were used to calculate sensitivity and specificity.
RESULTS
Of the 1,624 total patients who participated in the 2011 mammography study, 88 patients were included in the current study and were classified into two groups according to the diagnoses of breast cancer (n = 40) or benign breast disease (n = 48).
Table 1 shows the recorded anthropometric and biochemical values from patients in the study. Compared to the control group, cancer patients showed statistically significant differences in age (P ≤ 0.001), weight (P ≤ 0.05), waist circumference (P ≤ 0.05), CA 15‐3 levels (P ≤ 0.001), BMI (P ≤ 0.001) and LDLC levels (P ≤ 0.05). Breast cancer patients also showed increased levels of leptin, adiponectin and the L/A ratio compared to the control group, but this finding did not reach statistical significance. Table 2 shows the intra‐group comparisons according to BMI in patients diagnosed with cancer.
Table 1.
Anthropometric and Laboratory Values
| Variable | Cancer (n = 40) mean ± SD | Control (n = 48) mean ± SD | P |
|---|---|---|---|
| BMI (kg/m2) | 28.1 ± 3.8 | 25.4 ± 4.9 | 0.004 |
| Leptin (ng/ml) | 22.6 ± 15.2 | 18.5 ± 11.6 | 0.158 |
| L/A ratio | 1.99 ± 2.3 | 2.0 ± 2.1 | 0.814a |
| CA 15‐3 (IU) | 21.5 ± 16.7 | 13 ± 5.7 | 0.001a |
| Age (years) | 54 ± 10.9 | 41.2 ± 12.9 | 0.000 |
| Weight (kg) | 68.6 ± 10.8 | 63.4 ± 12.7 | 0.042 |
| Height (m) | 1.56 ± 0.06 | 1.58 ± 0.07 | 0.135 |
| Waist circumference (cm) | 94.3 ± 10 | 88.2 ± 12.5 | 0.017 |
| Glucose (mg/dl) | 94.9 ± 28.5 | 91.1 ± 23.35 | 0.514a |
| Cholesterol (mg/dl) | 194.4 ± 34.9 | 178.6 ± 43.5 | 0.067 |
| Triglycerides (mg/dl) | 159.1 ± 72 | 165.7 ± 128.0 | 0.489a |
| HDLC (mg/dl) | 44.5 ± 9.6 | 45.7 ± 10.2 | 0.565 |
| LDLC (mg/dl) | 125.2 ± 25.4 | 110.2 ± 36 | 0.029 |
| Uric acid (mg/dl) | 4.1 ± 1.1 | 3.9 ± 1.1 | 0.373 |
| Haemoglobin (g/dl) | 15 ± 1.6 | 15 ± 1.6 | 0.832 |
| Adiponectin (μg/ml) | 14.6 ± 6 | 13.5 ± 7.5 | 0.439 |
BMI, body mass index; CA 15‐3, carbohydrate antigen 15‐3; HDLC, high‐density lipoprotein cholesterol; LDLC, low‐density lipoprotein cholesterol; L/A, leptin/adiponectin ratio.
Mann–Whitney U‐test.
Table 2.
Anthropometric and Laboratory Values Classified by BMI in the Cancer Group
| Variable | Normal weight (n = 5), median (range) | Overweight (n = 25), median (range) | Obese (n = 10), median (range) | P a | P b |
|---|---|---|---|---|---|
| BMI (kg/m2) | 23 (22–23) | 27.1 (25–29.8) | 32.3 (30–37.5) | 0.000 | 0.000 |
| Leptin (ng/ml) | 7.7 (2.1–40.2) | 16.7 (2.9–41) | 39.3 (14.2–62.7) | 0.012 | 0.000 |
| L/A ratio | 0.6 (0.1 ‐6.59) | 1.1 (0.24–3.9) | 2.6 (0.96–13.58) | 0.010c | 0.005c |
| CA 15‐3 (IU) | 10.8 (8.5–12.2) | 13.9 (6.1–92.8) | 22.35 (13.7–44.6) | 0.003c | 0.050c |
| Age (years) | 53 (36–88) | 55 (34–74) | 49.5 (38–65) | 0.384 | 0.167 |
| Weight (kg) | 56 (49.2–70) | 66 (52.6–87) | 79.5 (69.8–100.5) | 0.001 | 0.000 |
| Height (m) | 1.58 (1.48–1.75) | 1.6 (1.45–1.71) | 1.56 (1.49–1.64) | 0.614 | 0.852 |
| Waist circumference (cm) | 84 (73–105) | 92 (82–109) | 101.5 (92–124) | 0.043 | 0.004 |
| Glucose (mg/dl) | 83 (82–85.6) | 92 (66–202) | 89 (56–118) | 0.495c | 0.838c |
| Cholesterol (mg/dl) | 181 (157–208.9) | 184 (132–305) | 198 (166–288) | 0.128 | 0.269 |
| Triglycerides (mg/dl) | 103 (56–170.4) | 141 (74 –333) | 164.5 (100–309) | 0.199 | 0.623 |
| HDLC (mg/dl) | 44.9 (38.5–65.1) | 40.8 (30.9–63.3) | 40.8 (33.9–55.4) | 0.335 | 0.655 |
| LDLC (mg/dl) | 104 (102–143.6) | 120 (84– 179.1) | 132.5 (100–213) | 0.161 | 0.062 |
| Uric acid (mg/dl) | 3.8 (2.5–4.5) | 3.8 (1.7–6.3) | 4.6 (3.8–6.2) | 0.040 | 0.045 |
| Haemoglobin (g/dl) | 15.1 (11.1–15.3) | 15.6 (9‐ 16.8) | 14.8 (13.5–16.2) | 0.331c | 0.188c |
| Adiponectin (μg/ml) | 19.7 (6.1–20.1) | 13 (4.6–25.1) | 13.9 (4.1–23.7) | 0.953 | 0.921 |
BMI, body mass index; CA 15‐3, carbohydrate antigen 15‐3; HDLC, high‐density lipoprotein cholesterol; LDLC, low‐density lipoprotein cholesterol; L/A, leptin/adiponectin ratio.
Between normal weight and obesity.
Between overweight and obesity.
Mann–Whitney U‐test.
Leptin levels and L/A ratios were found to be directly related to BMI, although the correlation between L/A ratio and BMI was less significant. CA 15‐3 levels only increased in relation to a higher BMI in cases of positive cancer diagnoses (Figure 1).
Figure 1.
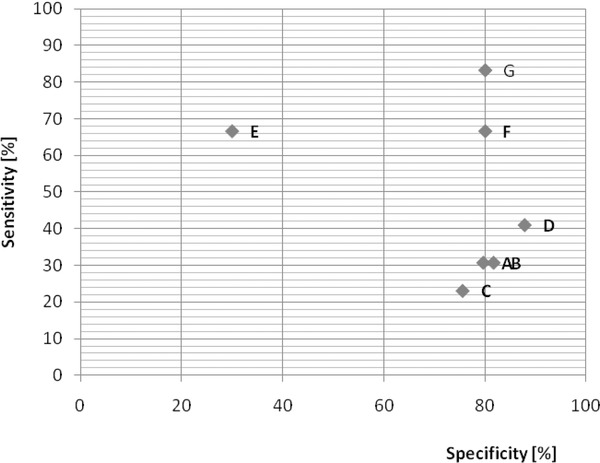
Relationship between sensitivity and specificity and the predictive power of biomarkers in breast cancer.
(A) BMI > 29.24 kg/m2, (B) leptin > 26.65 ng/ml, (C) L/A ratio > 2.37, (D) CA 15‐3 > 18.45 IU, (E) BMI > 29.24 kg/m2 and leptin > 26.65 ng/ml, (F) BMI > 29.24 kg/m2 and CA 15‐3 > 18.45 IU, (G) BMI > 29.24 kg/m2, leptin > 26.65 ng/ml, L/A ratio > 2.37 and CA 15‐3 > 18.45 IU. BMI, body mass index; CA 15‐3, carbohydrate antigen 15‐3; L/A, leptin/adiponectin ratio.
We used the 75th percentile values to determine high risk values for each of the biomarkers. These values were 29.24 kg/m2 for BMI, 26.65 ng/ml for leptin levels, 2.37 for the L/A ratio and 18.45 IU for CA 15‐3 levels. Using these data, we calculated predictive values (sensitivity, specificity, positive predictive value (PPV) and negative predictive value (NPV) for each biomarker. The results are as follows: 25%, 83.3%, 55.5% and 57.1% for BMI; 30.7%, 81.6%, 57.1% and 59.7% for leptin; 23.1%, 75.5%, 42.9% and 55.2% for L/A ratio and 41%, 87.7%, 72.7% and 65.1% for CA 15‐3. The predictive values increased (66.7%, 80%, 80% and 66.7%) when we took BMI and CA 15‐3 levels into account. When BMI and leptin were evaluated together, the specificity decreased to 30% (Figure 2). To test the usefulness of the previous four biomarkers in the diagnosis of breast cancer, the Bayes theorem was used and a kappa value of 0.87 (Table 3) was obtained. The suggested OR for breast cancer patients using the values above the 75th percentile for the tetrad was 6.7 (0.75–60.06 CI).
Figure 2.
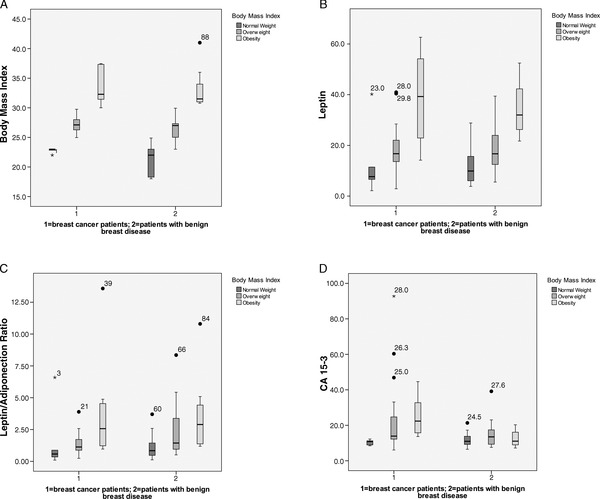
Differences in tetrad biomarkers between breast cancer patients (cases; n = 40) and patients with benign breast disease (controls; n = 48). (A) BMI, (B) leptin, (C) L/A ratio and (D) CA 15‐3. BMI, body mass index; CA 15‐3, carbohydrate antigen 15‐3; L/A, leptin/adiponectin ratio.
Table 3.
Predictive Values for the Tetrad (BMI, Leptin, L/A Ratio and CA 15‐3)
| 95% CI | |||
|---|---|---|---|
| Lower limit | Higher limit | ||
| Disease prevalence | 54.55% | 24.56% | 81.86% |
| Truly diagnosed patients | 81.82% | 47.75% | 96.79% |
| Sensibility | 83.33% | 36.48% | 99.12% |
| Specificity | 80.00% | 29.88% | 98.95% |
| Positive predictive value | 83.33% | 36.48% | 99.12% |
| Negative predictive value | 80.00% | 29.88% | 98.95% |
| Positive probability ratio | 4.17 | 0.70 | 24.94 |
| Negative probability ratio | 0.21 | 0.03 | 1.31 |
| False negatives | 16.67% | ||
While the absence of oestrogen and PR was not associated with the cut‐off values of the biomarkers used, BMI was associated with HER‐2‐positive cases. Moreover, CA 15‐3 levels were correlated with advanced breast cancer but not with the L/A ratio (Table 4). According to the results of the ROC curves, the variables with the greatest AUC were age and waist circumference, which correspond to postmenopausal women and obesity, respectively (Figure 3).
Table 4.
Biomarkers and the Clinical Stage of Tumour Progression
| Variable | Patients with cancer, N (%) | BMI, median (range) | Leptin, median (range) | L/A ratio, median (range) | CA 15‐3, median (range) |
|---|---|---|---|---|---|
| Clinical stage (n = 31) | |||||
| I | 4 (12.9) | 28 (26.8–30.7) | 25.5 (9.1–43.4) | 1.97 (0.57–4.5) | 12.2 (10.5–20.5) |
| II | 9 (29) | 28 (23–33) | 21.4 (4.8–41.1) | 1.04 (0.51–2.76) | 13.7 (8.2–44.6) |
| III | 11 (35.4) | 28 (22–37.5) | 16.7 (2.1–62.7) | 1.2 (0.1–13.6) | 14.1 (8.5–92.8) |
| IV | 7 (22.5) | 25 (22.8–32.5) | 13.7 (2.9–22.9) | 0.97 (0.24–1.58) | 13.6 (11.2–46.9) |
| Histopathological report (n = 40) | |||||
| Infiltrating ductal carcinoma | 31 (77.5) | 26.9 (22–37.5) | 18.3 (2.1–62.7) | 1.1 (0.1–13.6) | 13.7 (8.2–92.8) |
| Invasive lobular carcinoma | 3 (7.5) | 30 (26.9–32.1) | 17.8 (14.2–33.6) | 2.38 (1.22–2.58) | 19 (14.1–29.1) |
| Mucinous carcinoma | 1 (2.5) | 37.3 | 54.2 | 4.88 | 22.7 |
| Myofibroblastoma | 1 (2.5) | 29 | 19.6 | 0.82 | 6.1 |
| Carcinoma in situ | 4 (10) | 28.6 (27.3–31.6) | 18.3 (13.6–40.4) | 1.2 (1.1–1.7) | 20.2 (11.3–28.9) |
| Immunohistochemistry (n = 31) | |||||
| ER+ | 27 (87.1) | 28 (22–37.5) | 18.7 (2.1–62.7) | 1.2 (0.1–13.6) | 14.1 (8.2–92.8) |
| ER− | 4 (12.9) | 25 (22.8–28) | 10.9 (2.9–22) | 0.88 (0.2–1.1) | 12.9 (11.2–32.7) |
| PR+ | 25 (80.6) | 28 (22–37.5) | 21.4 (2.1–62.7) | 1.4 (0.1–13.6) | 13.9 (8.2–92.8) |
| PR− | 6 (19.4) | 25 (22.8–32.1) | 13.9 (2.9–22) | 0.96 (0.24–1.2) | 13.86(11.2–46.9) |
| HER‐2 positive | 3 (9.6) | 25 (25–25.8) | 13.7 (2.9–14.5) | 1 (0.24–1) | 33.1 (13.6–46.9) |
| Triple negative | 3 (9.6) | 25(22.8–28) | 15.3 (6.6–22) | 0.88 (0.88–1.15) | 12.2 (11.2–32.7) |
| ER+ PR+ | 25 (80.6) | 28 (22–37.5) | 21.4 (2.1–62.7) | 1.4 (0.1–13.6) | 13.9 (8.2–92.8) |
| ER– PR– | 4 (12.9) | 25 (22.8–28) | 10.95 (2.9–22) | 0.88 (0.24–1.15) | 12.9 (11.2–32.7) |
CA 15‐3, carbohydrate antigen 15‐3; BMI, body mass index; PR, Progesterone receptor; ER, oestrogen receptor; HER‐2, human epidermal growth factor receptor 2; L/A, leptin/adiponectin ratio.
Figure 3.
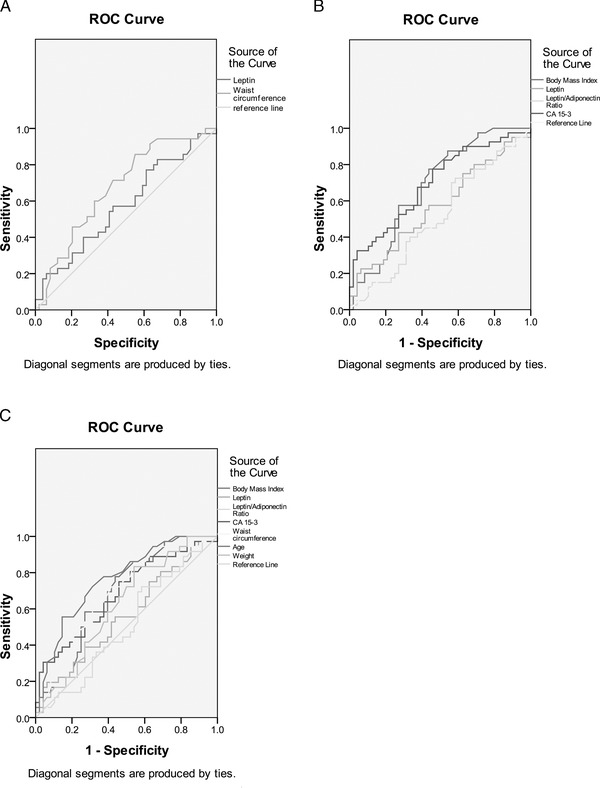
ROC analysis in cases and controls of (A) leptin (AUC, 0.57 (95% CI, 0.64–0.71)) and waist circumference (AUC, 0.67 (95% CI, 0.6–0.82)); (B) BMI (AUC, 0.68 (95% CI, 0.56–0.79)), leptin (AUC, 0.59 (95% CI, 0.46–0.71)), L/A ratio (AUC, 0.53 (95% CI, 0.41–0.65)) and CA 15‐3 (AUC, 0.71 (95% CI, 0.6–0.82)); (C) BMI (AUC, 0.67 (0.55–0.78)), leptin (AUC, 0.57 (95% CI, 0.45–0.7)), L/A ratio (AUC, 0.52 (95% CI, 0.4–0.65)), CA 15‐3 (AUC, 0.69 (95% CI, 0.58–0.81)), waist circumference (AUC, 0.67 (95% CI, 0.56–0.79)), age (AUC, 0.74 (95% CI (0.64–0.85)) and weight (AUC, 0.62 (95% CI (0.5–0.74)). AUC, area under the curve; BMI, body mass index; CA 15‐3, carbohydrate antigen 15‐3; L/A, leptin/adiponectin ratio; ROC, receiver operator characteristic.
Given the data from Table 5, which shows an association between BMI, leptin levels, the L/A ratio and CA 15‐3 levels with the immunohistochemical markers of breast cancer patients, we have noted a significant correlation between serum leptin levels and HER‐2 status (P < 0.001). Surprisingly, tumours that were negative for HER‐2 presented higher BMI levels than tumours expressing this marker.
Table 5.
BMI, Leptin, L/A Ratio, CA 15‐3 and Their Association With the Immunohistochemical Features of Breast Cancer in 31 Patients
| Variable | Breast cancer patients, N (%) | BMI P | Leptin P | L/A ratio P | CA 15‐3 P |
|---|---|---|---|---|---|
| Immunohistochemistry (n = 31) | |||||
| ER+ | 27 (86.2) | 0.117 | 0.227 | 0.137a | 0.476a |
| ER− | 4 (13.8) | ||||
| PR+ | 25 (80.6) | 0.209 | 0.014 | 0.190a | 0.903a |
| PR− | 6 (19.4) | ||||
| HER‐2 negative | 28 (90.3) | 0.001 | 0.197 | 0.229a | 0.204a |
| HER‐2 positive | 3 (10.7) | ||||
| ER+ PR+ | 25 (80.6) | 0.121 | 0.165 | 0.160a | 0.562a |
| ER– PR– | 4 (19.4) | ||||
Mann–Whitney U–test.
CA 15‐3, carbohydrate antigen 15‐3; BMI, body mass index; PR, Progesterone receptor; ER, oestrogen receptor; L/A, leptin/adiponectin ratio.
DISCUSSION
Obesity is associated with many types of cancer 4, 35, 36. Moreover, the increasing incidence of breast cancer, increasing rates of obesity and the association between them, has become a major challenge to maintaining the health of Mexican women. One probable explanation for this association resides in the overstimulation of the leptin pathway.
First, with regard to the age of the patients younger than 40 years (range 35–40), only 5 of 26 were diagnosed with cancer, of which 3 were overweight and 2 were obese.
BMI is well established as a pro‐cancerous factor 37. However, BMI, leptin, adiponectin and ER are also biomarkers associated with both obesity and breast cancer 17, 23.
Clearly, elevated levels of leptin in obese patients are involved in the development and progression of breast cancer 23 in postmenopausal women 21. This involvement occurs not only through the direct action of leptin on neoplastic cells through the JAK2/STAT3 signalling pathway mediated by interleukin‐1 (IL‐1; 38 but also through the induced expression of other factors that are involved in the carcinogenesis of breast tissue, such as oestrogen. Several studies have reported that elevated serum levels of leptin in breast cancer patients indicate a poorer prognosis and lower survival rates. In our study, significant differences were observed between the cohort of cancer patients who were of normal weight and those who were overweight or obese.
Adiponectin could have a role in the reduction of leptin levels 32, 33. In our study, we did not find differences in adiponectin levels between patients with cancer and those without.
It has been postulated that the L/A ratio could be more useful as a biomarker because both hormones included in this formula are antagonistic in their final effect on tumourigenesis. Until now, this ratio has not been widely used in prospective studies. In our study, the L/A ratio increase was lower than that of leptin alone. Therefore, this variable could indicate that a metabolic adjustment is taking place that has protective effects against the increasing leptin levels. It could be possible to reduce this ratio by correcting the patient's diet, which would modify the susceptibility to cancer through the inhibition of the leptin pathway. With regard to the CA 15‐3, it seems that obese patients are more susceptible to increased levels of this marker regardless of the cancer diagnosis.
Interestingly, in our work, it was observed that patients with lab values above the cut‐off values for the biomarkers included in the tetrad have differential expression of oestrogen and progesterone in their cancer cells (ER+/PR+; 39).
This study demonstrates the usefulness of using BMI, leptin levels, the L/A ratio and CA 15‐3 levels together as biomarkers for breast cancer. Further prospective and longitudinal studies should be conducted in order to corroborate this conclusion. Using the biomarkers proposed here would provide more information about the association between obesity and breast cancer as well as some benign conditions such as fibroadenomas and fibrocystic breast disease.
ACKNOWLEDGMENTS
The authors thank Eva María Gómez García, MD, and Eduardo Gómez Plata, MD, for their excellent help with patient follow‐up.
Clinical Trials ID: NCT01643148
REFERENCES
- 1. Carino C, Olawaiye AB, Cherfils S, Serikawa T, Lynch MP, et al. Leptin regulation of proangiogenic molecules in benign and cancerous endometrial cells. Int J Cancer 2008;123:2782–2790. [DOI] [PMC free article] [PubMed] [Google Scholar]
- 2. Saxena NK, Taliaferro‐Smith L, Knight BB, Merlin D, Anania FA, et al. Bidirectional crosstalk between leptin and insulin‐like growth factor‐I signaling promotes invasion and migration of breast cancer cells via transactivation of epidermal growth factor receptor. Cancer Res 2008;68:9712–9722. [DOI] [PMC free article] [PubMed] [Google Scholar]
- 3. Huang XF, Chen JZ. Obesity, the PI3K/Akt signal pathway and colon cancer. Obes Rev Engl 2009;10:610–616. [DOI] [PubMed] [Google Scholar]
- 4. Pischon T, Nothlings U, Boeing H. Obesity and cancer. Proc Nutr Soc 2008;67:128–145. [DOI] [PubMed] [Google Scholar]
- 5. Grossmann ME, Ray A, Nkhata KJ, et al. Obesity and breast cancer: status of leptin and adiponectin in pathological processes. Cancer Metastasis Rev 2010;29:641–653. [DOI] [PubMed] [Google Scholar]
- 6. Awatef M, Olfa G, Kacem M, et al. Association between body mass index and risk of breast cancer in Tunisian women. Ann Saudi Med 2011;31:393–397. [DOI] [PMC free article] [PubMed] [Google Scholar] [Retracted]
- 7. Guo S, Liu M, Wang G, et al. Oncogenic role and therapeutic target of leptin signaling in breast cancer and cancer stem cells. Biochim Biophys Acta 2012;1825:207–222. [DOI] [PMC free article] [PubMed] [Google Scholar]
- 8. Cleary M, Grossmann M, Ray A. Effect of obesity on breast cancer development. Veterinary Pathology Online 2010;47:202–213. [DOI] [PubMed] [Google Scholar]
- 9. Knaul FM, Nigenda G, Lozano R, et al. Breast cancer in Mexico: An urgent priority. Salud Publica Mex 2009;51(Suppl 2):s335–s344. [DOI] [PubMed] [Google Scholar]
- 10. Del Socorro Romero‐Figueroa M, Santillan‐Arreygue L, Miranda‐Garcia M, et al. Epidemiological pattern of breast cancer mortality in Mexico State. Rev Med Inst Mex Seguro Soc 2010;48:253–258. [PubMed] [Google Scholar]
- 11. Villaseñor AD. La Obesidad en México. Salud Pública. México: Fundación Este país Conocimiento útil; 2011. [Google Scholar]
- 12. Yin N, Wang D, Zhang H, et al. Molecular mechanisms involved in the growth stimulation of breast cancer cells by leptin. Cancer Res 2004;64:5870–5875. [DOI] [PubMed] [Google Scholar]
- 13. Cleary MP, Ray A, Rogozina OP, et al. Targeting the adiponectin:leptin ratio for postmenopausal breast cancer prevention. Front Biosci (Schol Ed) 2009;1:329–357. [DOI] [PubMed] [Google Scholar]
- 14. Chen DC, Chung YF, Yeh YT, et al. Serum adiponectin and leptin levels in Taiwanese breast cancer patients. Cancer Lett 2006;237:109–114. [DOI] [PubMed] [Google Scholar]
- 15. Oh SW, Park CY, Lee ES, et al. Adipokines, insulin resistance, metabolic syndrome, and breast cancer recurrence: A cohort study. Breast Cancer Res 2011;13:R34. Pp 1–10. [DOI] [PMC free article] [PubMed] [Google Scholar]
- 16. Rahmati‐Yamchi M, Zarghami N, Rahbani M, et al. Plasma Leptin, hTERT gene expression, and anthropometric measures in obese and non‐obese women with breast cancer. Breast Cancer (Auckl) 2011;5:27–35. [DOI] [PMC free article] [PubMed] [Google Scholar]
- 17. Conroy SM, Chai W, Lim U, et al. Leptin, adiponectin, and obesity among Caucasian and Asian women. Mediators Inflamm 2011;2011:253–580. Pp 1–7. [DOI] [PMC free article] [PubMed] [Google Scholar]
- 18. Cleary MP, Grossmann ME, Ray A. Effect of obesity on breast cancer development. Vet Pathol 2010;47:202–213. [DOI] [PubMed] [Google Scholar]
- 19. Maskarinec G, Woolcott C, Steude JS, et al. The relation of leptin and adiponectin with breast density among premenopausal women. Eur J Cancer Prev 2010;19:55–60. [DOI] [PMC free article] [PubMed] [Google Scholar]
- 20. Paz‐Filho G, Lim EL, Wong ML, et al. Associations between adipokines and obesity‐related cancer. Front Biosci 2011;16:1634–1650. [DOI] [PubMed] [Google Scholar]
- 21. Maccio A, Madeddu C. Obesity, inflammation, and postmenopausal breast cancer: Therapeutic implications. Sci World J 2011;11:2020–2036. [DOI] [PMC free article] [PubMed] [Google Scholar]
- 22. Yaw YH, Kandiah M, Shariff ZM, et al. Pattern of weight changes in women with breast cancer. Asian Pac J Cancer Prev 2010;11:1535–1540. [PubMed] [Google Scholar]
- 23. Cirillo D, Rachiglio AM, la Montagna R, et al. Leptin signaling in breast cancer: An overview. J Cell Biochem 2008;105:956–964. [DOI] [PubMed] [Google Scholar]
- 24. Fiorio E, Mercanti A, Terrasi M, et al. Leptin/HER2 crosstalk in breast cancer: in vitro study and preliminary in vivo analysis. BMC Cancer 2008;8:305. Pp 1–11. [DOI] [PMC free article] [PubMed] [Google Scholar]
- 25. Lohrisch C, Piccart M. HER2/neu as a predictive factor in breast cancer. Clin Breast Cancer 2001;2:129–135; discussion 36–37. [DOI] [PubMed] [Google Scholar]
- 26. Molina R, Auge JM, Farrus B, et al. Prospective evaluation of carcinoembryonic antigen (CEA) and carbohydrate antigen 15.3 (CA 15.3) in patients with primary locoregional breast cancer. Clin Chem 2010;56:1148–1157. [DOI] [PubMed] [Google Scholar]
- 27. Pakiz B, Flatt SW, Bardwell WA, et al. Effects of a weight loss intervention on body mass, fitness, and inflammatory biomarkers in overweight or obese breast cancer survivors. Int J Behav Med 2011;18:333–341. [DOI] [PMC free article] [PubMed] [Google Scholar]
- 28. Dalamaga M, Archondakis S, Sotiropoulos G, et al. Could serum visfatin be a potential biomarker for postmenopausal breast cancer? Maturitas 2012;71:301–308. [DOI] [PubMed] [Google Scholar]
- 29. Perrier S, Caldefie‐Chezet F, Vasson MP. IL‐1 family in breast cancer: potential interplay with leptin and other adipocytokines. FEBS Lett 2009;583:259–265. [DOI] [PubMed] [Google Scholar]
- 30. Hu X, Juneja SC, Maihle NJ, et al. Leptin—A growth factor in normal and malignant breast cells and for normal mammary gland development. J Natl Cancer Inst 2002;94:1704–1711. [DOI] [PubMed] [Google Scholar]
- 31. Smirnova OV, Ostroukhova TY, Bogorad RL. JAK‐STAT pathway in carcinogenesis: is it relevant to cholangiocarcinoma progression? World J Gastroenterol 2007;13:6478–6491. [DOI] [PMC free article] [PubMed] [Google Scholar]
- 32. Jardé T, Perrier S, Vasson MP, et al. Molecular mechanisms of leptin and adiponectin in breast cancer. Eur J Cancer 2011;47:33–43. [DOI] [PubMed] [Google Scholar]
- 33. Jarde T, Caldefie‐Chezet F, Goncalves‐Mendes N, et al. Involvement of adiponectin and leptin in breast cancer: Clinical and in vitro studies. Endocr Relat Cancer 2009;16:1197–1210. [DOI] [PubMed] [Google Scholar]
- 34. Duffy MJ, Evoy D, McDermott EW. CA 15‐3: Uses and limitation as a biomarker for breast cancer. Clin Chim Acta 2010;411:1869–1874. [DOI] [PubMed] [Google Scholar]
- 35. Lichtman MA. Obesity and the risk of chronic myelogenous leukemia: is this another example of the neoplastic effects of increased body fat? Leukemia 2012;26:183–184. [DOI] [PubMed] [Google Scholar]
- 36. Zhang Y, Liu Z, Yu X, et al. The association between metabolic abnormality and endometrial cancer: A large case‐control study in China. Gynecol Oncol 2010;117:41–46. [DOI] [PubMed] [Google Scholar]
- 37. Kaklamani V, Yi N, Sadim M, et al. The role of the fat mass and obesity associated gene (FTO) in breast cancer risk. BMC Med Genet 2011;12:52. [DOI] [PMC free article] [PubMed] [Google Scholar]
- 38. Zhou W, Guo S, Gonzalez‐Perez RR. Leptin pro‐angiogenic signature in breast cancer is linked to IL‐1 signalling. Br J Cancer 2011;104:128–137. [DOI] [PMC free article] [PubMed] [Google Scholar]
- 39. Ray A, Nkhata KJ, Cleary MP. Effects of leptin on human breast cancer cell lines in relationship to estrogen receptor and HER2 status. Int J Oncol 2007;30:1499–1509. [PubMed] [Google Scholar]