Abstract
Background
Various factors may affect the accuracy of hemoglobin (Hb) A1c measurements that are widely used to monitor glycemic control in diabetic patients. This study was aimed to compare the values of HbA1c obtained by two different methods, Roche Tina‐quant second and thirdgeneration HbA1c assays based on the turbidimetric inhibition immunoassay (TINIA), and high‐performance liquid chromatography (HPLC) cation‐exchange method used by Arkray Adams HA‐8160 analyzer.
Methods
Measurements of HbA1c were carried out in blood samples from 2,917 patients using above‐mentioned methods. Linear regression was used for the correlation analysis and linear equations. Bland–Altman plots were performed from method comparison data using MedCalc statistical software.
Results
For the low control, the second generation Tina‐quant assay had within‐run and between‐run CVs 0.8% and 0.9%; for the high control within‐run and between‐run CVs were 1% and 0.96%, respectively. HPLC method for the low control had within‐run CV 1% and between‐run CV 1.3%; for the high control within‐run CV was 0.6% and between‐run CV was 0.9%.
Conclusion
There was a good concordance between the results of TINIA and HPLC methods (y = 1.091x – 0.363; r 2 = 0.96).
Keywords: HbA1c, turbidimetric immunoassay (TINIA), high‐performance liquid chromatography (HPLC), diabetes mellitus
INTRODUCTION
Diabetes prevalence is increasing worldwide, accounts 90–95% of cases in developed countries 1. Diabetes Control and Complications Trial (DCCT) and Prospective Diabetes studies report that the risk and the development of diabetic complications are directly associated with the management of diabetes 2. Blood glucose levels that reflect the current condition of the patient are not sufficient in determining the glucose homeostasis. Hemoglobin (Hb) A1c is a subset of glycated Hbs that is irreversibly glycated at one or both N terminal valines of the β chains 3. The percentage of HbA1c level reflects the mean glucose concentration over the previous 2 or 3 months, and is commonly used to monitor the glycemic control of the individual. The recommended goals for HbA1c are either <7% (American Diabetes Association, ADA) or <6.5% (American College of Endocrinology, ACE). The International Federation of Clinical Chemistry (IFCC) has set a value less than 5% 4, 5. Since July 2009, this marker also has been recommended to diagnose diabetes by an international expert committee (IEC) when HbA1c levels are >6.5% 6.
At present, more than 20 different assay methods are being used to measure the level of the HbA1c in clinical laboratories. These methods are based on different analytical principles, such as immune turbidimetry, cation‐exchange chromatography, and high‐performance liquid chromatography (HPLC) 7, 8. Several studies have reported a significant bias among analytical methods to measure HbA1c levels and there are substantial concerns about the between‐method agreement on HbA1c measurement 9, 10, 11. Therefore, standardization and comparability of HbA1c results with different methods appear to be an important issue.
Measurement of HbA1c by HPLC has been appointed as the reference method for HbA1c assay by the National Glycohemoglobin Standardization Program (NGSP) in USA. Since 2008, however, IFCC working group on HbA1c standardization developed a new reference method 12, 13 and the relation between the methods of NGSP and IFCC was defined 14. In this procedure, primary reference materials of pure HbA1c and HbA0 are prepared by the cleavage of peptides using endoprotease, which is followed by the separation of glycated and nonglycated N‐terminal hexapeptides through reversed‐phase HPLC, and finally a reference method—mass spectrometry or capillary electrophoresis—is applied to measure HbA1c specifically 15, 16, 17.
The purpose of this study was to evaluate the analytical performances of the Roche Tina‐quant second and third generation HbA1c assays based on immunoturbidimetry, and HPLC cation‐exchange method used by Arkray Adams HA‐8160 analyzer.
MATERIALS AND METHODS
Blood Samples
This study comprised 2,917 whole blood samples obtained from the subjects submitted for routine testing in our laboratory. HbA1c values ranged from 3.2% to 15%. Whole blood samples were drawn by venipuncture and collected in tubes containing lithium heparin as an anticoagulant. All samples except samples for between‐run and within‐run were stored in room temperature and measurements were conducted in 4 hr.
HbA1c Methods
All HbA1c levels were determined by using two methods according to the manufacturers’ recommendation.
-
Tina‐quant second and third generation assays (Roche Diagnostics, Mannheim, Germany): This assay was performed on the autoanalyzer from Roche and NGSP‐certified. This method is based on the turbidimetric inhibition immunoassay (TINIA) of hemolyzed blood samples. The anti‐HbA1c antibody reacts with a single binding site on HbA1c, forming soluble complex. Polyhaptens react with excess anti‐HbA1c antibody to form insoluble complex and the amount of Ab‐polyhapten complex is measured turbidimetrically. In a hemolyzed blood sample, liberated Hb is determined bichromatically and calculations are made according to IFCC (HbA1c% = HbA1c/Hb × 91.5 + 2.15).
The Tina‐quant third generation HbA1c assay is completely same as the second generation, except the detergent is added to the reagents to improve accuracy. This assay was applied on 103 samples.
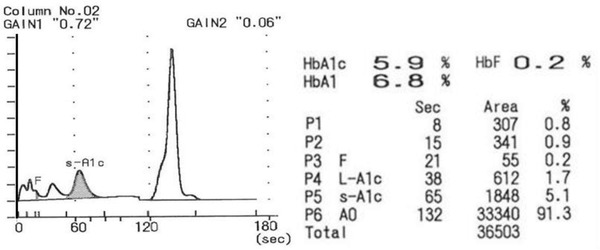
Adams HA‐8160 (Arkray Inc, Kyoto, Japan): HbA1c analyzer is a fully automated HbA1c analyzer using reversed‐phase cation‐exchange chromatography and dual‐wavelength colorimetry (measured at wavelength of 415 nm and blanking wavelength of 500 nm). The sample was automatically hemolyzed by the analyzer. HbA1c, HbA1, and HbF values are presented as the percentage of total Hb after calculations from the peak areas of different Hb fractions. Abnormal patterns suggesting the presence of Hb variants (additional peaks beside HbA peak or HbF value higher than 10%) might be inspected. A chromatogram of a patient's sample is presented in Figure 1.
Figure 1.

A chromatogram obtained from a patient's sample by the HPLC method.
Precision Studies
Imprecision of Tina‐quant second and third generation assays and HPLC method was expressed as the coefficient of variation (CV%) for within‐run and between‐run studies. For this purpose, two levels of HbA1c control materials (high and low levels) of Roche HbA1c and Adams HA‐8160 were studied 20 times within‐run and 20 times on consecutive days.
Data Analyses
Statistical analyses were performed using SPSS 15.0 software (SPSS Inc. Chicago, IL). Linear regression analysis was used for the correlation and linear equations. Bland–Altman plots were performed from method comparison data using MedCalc statistical software.
RESULTS
The results of imprecision studies using Roche HbA1c and Adams HA‐8160 HbA1c controls (low and high) are expressed in Table 1. The second generation Tina‐quant assay had within‐run CV 0.8% and between‐run CV 0.9% for low control (mean value: 6.7 ± 0.05%). For the high control (mean value: 11.4 ± 0.1%), this assay revealed a within‐run CV 1% and between‐run CV 0.96%. The third generation Tina‐quant assay had within‐run CV 1.6% and between‐run CV 2.1% for low control (5.4 ± 0.09%). For the high control (11.6 ± 0.07%), within‐run CV was 0.3% and between‐run CV 0.7%.
Table 1.
(a) Within‐Run Coefficients of Variation of HbA1c Levels Measured by the Tinaquant Second‐ and Third‐ Generation TINIA Methods (Roche) and HPLC Method (Adams HA‐8160). (b) Between‐Day Coefficients of Variation of HbA1c Levels Measured by the Second‐ and Third‐ Generation TINIA Methods (Roche) and HPLC Method (Adams HA‐8160)
| Method | Mean | SD | CV (%) | |
|---|---|---|---|---|
| (a) HbA1c% Within‐run, n = 20 | ||||
| Control low | HPLC | 5.3 | 0.05 | 1.0 |
| TINIA 2nd | 6.7 | 0.05 | 0.8 | |
| TINIA 3rd | 5.4 | 0.09 | 1.6 | |
| Control high | HPLC | 11.5 | 0.01 | 0.6 |
| TINIA 2nd | 11.4 | 0.1 | 1.0 | |
| TINIA 3rd | 11.6 | 0.08 | 0.3 | |
| (b) HbA1c% Between‐day, n = 20 | ||||
| Control low | HPLC | 5.2 | 0.07 | 1.3 |
| TINIA 2nd | 6.7 | 0.05 | 0.9 | |
| TINIA 3rd | 5.37 | 0.12 | 2.1 | |
| Control high | HPLC | 10.9 | 0.09 | 0.9 |
| TINIA 2nd | 11.4 | 0.1 | 0.96 | |
| TINIA 3rd | 11.6 | 0.08 | 0.7 | |
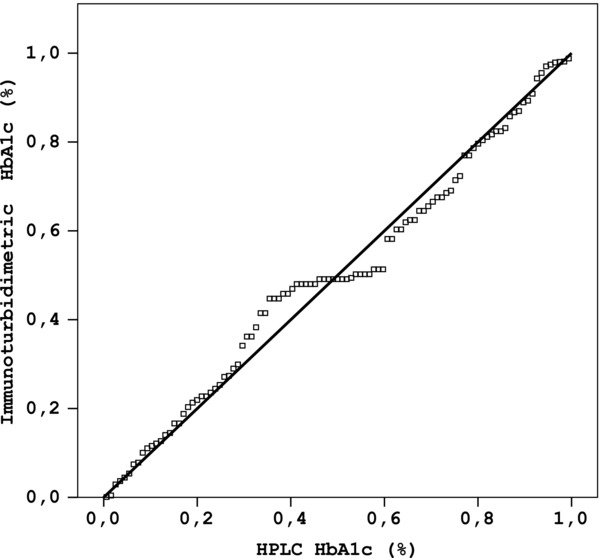
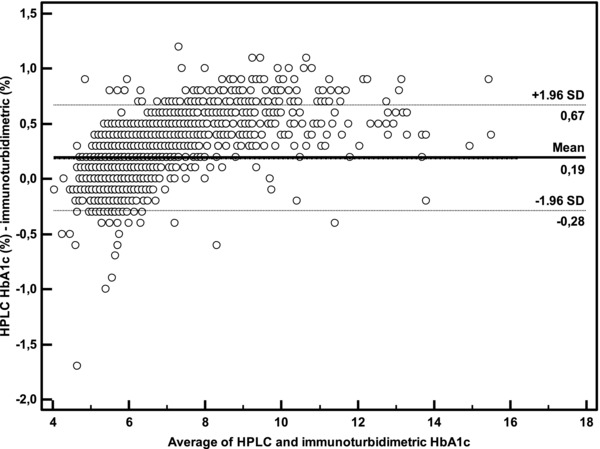
HPLC method on Adams HA‐8160 for the low control (mean value: 5.3 ± 0.05%) had within run CV 1% and between‐run CV 1.3%; for the high control (mean value: 11.5 ± 0.07%) within‐run CV was 0.6% and between‐run CV was 0.9%. The analysis of method comparison is summarized in Figures 2, 3, 4. The second generation HbA1c assay showed a good agreement with HPLC method (y = 1.091x – 0.363; r 2 = 0.96, Fig. 2. Bland–Altman plot of data from HPLC and Tina‐quant second generation assays produced mean bias of 0.19 (−0.3 – 0.7) lower and upper 95% confidence interval (Fig. 3).
Figure 2.

Method comparison plot for the determination of HbA1c using Roche Tina‐quant second generation (TINIA) and Adams HA‐8160 (HPLC) (y = 1.091x – 0.363; r 2 = 0.96).
Figure 3.

Bland–Altman difference plot comparing HbA1c results of Roche Tina‐quant second generation (TINIA) and Adams HA‐8160 (HPLC).
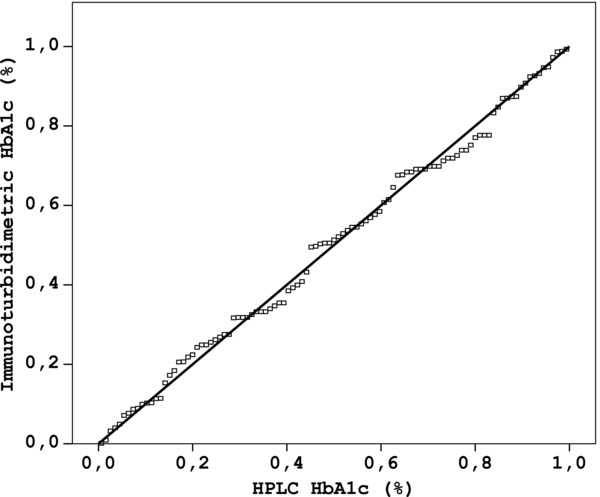
Figure 4.

Method comparison plot for the determination of HbA1c using Roche Tina‐quant third generation (TINIA) and Adams HA‐8160 (HPLC) (y = 0.96x + 0.02, r 2 = 0.98).
When the relationship between the results obtained from HPLC and Tina‐quant third generation assays was investigated in 103 subjects, the performance of third generation assay also showed a good correlation with the HPLC results (y = 0.96x + 0.02, r 2 = 0.98, Fig. 4. Bland–Altman plot of HPLC results against the Tina‐quant third generation results produced mean bias of −0.38 (−0.8 – 0.03) lower and upper 95% confidence interval.
DISCUSSION
The importance of HbA1c percentage levels in the management of diabetes mellitus brings out the need of efficient and reliable methods for the measurement of glycated Hb. Analytical performances of various methods used for this purpose have been examined. Most of these methods are certified for traceability to the Diabetes Control and Complication Trial (DCCT) designated comparison method, which originally was a HPLC method 17, 18, 19.
Although there are serious efforts to improve the standardization of methodology for HbA1c 20, some aspects of the assays still remain controversial. Nowadays, immunoturbidimetric HbA1c assays are most common in clinical laboratories. The immunoassay technique includes an offline sample pretreatment, followed by two different methodologies in dual channel, which have been reported as the reason of imprecision 21. In the present study, mean value obtained from 2,917 subjects for HbA1C was 6.1 ± 1.2% by the second generation Tina‐quant assay and 6.3 ± 1.4% by the HPLC method. The results of the TINIA method were correlated well with those of HPLC (y = 1.091x – 0.363; r 2 = 0.96). The mean HbA1c value obtained from 103 patients was 6.7 ± 1.8% by the Tina‐quant third generation assay. These data were associated well with those obtained from HPLC (y = 0.96x + 0.02, r 2 = 0.98). Several studies have also noted a perfect relation and concordance between HPLC and TINIA methods 22, 23. The CV% values of second generation TINIA and HPLC methods in our study for within‐run and between‐days were also in good agreement with the reference CVs of previous reports 1, 24, 25. It has been recommended that precision of HbA1c assays should be less than 2.5% CV as specified by IFCC working group for HbA1c standardization 26, 27.
Many immunoassay‐based methods have been shown to be affected by the Hb variants such as HbS and HbC 28, 29. Since the antibodies used in these methods recognize the N‐terminal 4–10 residues of the beta chain of Hb molecule, any mutations in this region will affect HbA1c measurements.
In thalassemia minor, a disease particularly common in Mediterranean, Asia, and Africa, approximately 20% of total Hb is fetal hemoglobin (HbF), which contains gamma chains instead of beta chains. Glycosylated gamma chains could not be determined by the immunoassay‐based methods, resulting in underestimated HbA1c levels. Roche Tina‐quant HbA1c second generation contains the antibody that perceives specifically the first four amino acids of Hb beta chain and is not affected from the Hb variants and derivatives 30, 31. Bry et al. reported that glycated Hb assays—immunoassay, cation‐exchange chromatography, and boronate affinity—were not affected by the HbF concentration below 5% of total Hb 28. The cation‐exchange chromatographic methods generally measure the HbA1c concentration by examining the areas of HbA1c and HbA peaks in the HPLC chromatogram in order to provide an accurate determination 28, 32, 33. It was reported that increased HbF peak can be seen properly in front of the HbA1c peak in a chromatogram accomplished by HA‐8160 analyzer, so that the assay is not affected by the presence of high concentration of HbF 23.
In conclusion, the TINIA second generation is a reliable method with very high imprecision and good accuracy, and its results are in good agreement with those obtained by the HPLC method.
REFERENCES
- 1. Sacks DB, Bruns DE, Goldstein DE, Maclaren NK, McDonald JM, Parrott M. Guidelines and recommendations for laboratory analysis in the diagnosis and management of diabetes mellitus. Clin Chem 2002;48:436–472. [PubMed] [Google Scholar]
- 2. Diabetes Control and Complications Trial Research Group . The effect of intensive treatment of diabetes on the development and progression of long‐term complications in insulin‐dependent diabetes mellitus. N Eng J Med 1993;329:977–986. [DOI] [PubMed] [Google Scholar]
- 3. IFCC Working Group web site http://www.ngsp.org
- 4. American Diabetes Association . Test of glycemia in diabetes. Diabetes Care 2001;24:80–82. [Google Scholar]
- 5. Miedema K. Towards worldwide standardization of HbA1c determination. Diabetologica 2004;47:1143–1148. [DOI] [PubMed] [Google Scholar]
- 6. The International Expert Committee . International expert committees report on the role the A1c assay in the diagnosis of diabetes. Diabetes Care 2009;32:1327–1334. [DOI] [PMC free article] [PubMed] [Google Scholar]
- 7. Burtis CA, Ashwood ER, Bruns DE, editors. Tietz textbook of clinical chemistry and molecular diagnostic, fourth edition, Philadelphia: WB Saunders, 2006. p 879–884. [Google Scholar]
- 8. John WG. Haemoglobin A1c: analysis and standardization. Clin Chem Lab Med 2003;41:1199–1212. [DOI] [PubMed] [Google Scholar]
- 9. Little RR, Wiedmeyer HM, England JD, Naito HK, Goldstein DE. Interlaboratory comparison of glycohemoglobin results: College of American Pathologists survey data. Clin Chem 1991;37:1725–1729. [PubMed] [Google Scholar]
- 10. Hoshino T, Okahashi M, Arai H. Survey and assessment of the actual state of routine measurement of glycohaemoglobin/GHb by commercial methods: Warning to the users and providers. J Pharm Biomed Anal 1997;15:1551–1562. [DOI] [PubMed] [Google Scholar]
- 11. Mosca A, Paleari R, Trapolino A, Capani F, Pagano G, Plebani M. A re‐evaluation of glycohemoglobin standardization: Italian experience with 119 laboratories and 12 methods. Eur J Clin Chem Clin Biochem 1997;35:243–248. [PubMed] [Google Scholar]
- 12. Consensus Committee . Consensus statement on the worldwide standardization of the hemoglobin A1C measurement: The American Diabetes Association, European Association for the Study of Diabetes, International Federation of Clinical Chemistry and Laboratory Medicine, and the International Diabetes Federation. Diabetes Care 2007;30:2399–2400. [DOI] [PubMed] [Google Scholar]
- 13. Geistanger A, Arends S, Berding C, et al. Statistical methods for monitoring the relationship between the IFCC reference measurement procedure for Hemoglobin A1c and the designated comparison methods in the United States, Japan and Sweden. Clin Chem 2008;54:1379–1385. [DOI] [PubMed] [Google Scholar]
- 14. Hoelzel W, Weykamp C, Jeppson JO, et al. IFCC reference system for measurement of Hemoglobin A1c in human blood and the national standardization schemes in the United States, Japan, and Sweden: A method‐comparison study. Clin Chem 2004;50:166–174. [DOI] [PubMed] [Google Scholar]
- 15. Finke A, Kobold U, Hoelzel W, Weykamp C, Jeppson JO, Miedema K. Preparation of a candidate primary reference material for the international standardization of HbA1c determinations. Clin Chem Lab Med 1998;36:299–308. [DOI] [PubMed] [Google Scholar]
- 16. Kobold U, Jeppson JO, Dülffer T, Finke A, Hoelzel W, Miedema K. Candidate reference methods for HbA1c based on peptide mapping. Clin Chem 1997;43:1944–1951. [PubMed] [Google Scholar]
- 17. Jeppson JO, Kobold U, Barr JR, et al. Approved IFCC reference method for the measurement of HbA1c in human blood. Clin Chem Lab Med 2002;40:78–89. [DOI] [PubMed] [Google Scholar]
- 18. The DCCT Research Group . Feasibility of centralized measurements of glycated hemoglobin in the diabetes control and complications trial: A multicenter study. Clin Chem 1987;33:2267–2271. [PubMed] [Google Scholar]
- 19. Weykamp C, John WG, Mosca A, et al. The IFCC reference measurement system for HbA1c: A 6‐year progress report. Clin Chem 2008;54:240–248. [DOI] [PubMed] [Google Scholar]
- 20. Sacks DB. Global harmonization of hemoglobin A1c. Clin Chem 2005;51:681–683. [DOI] [PubMed] [Google Scholar]
- 21. Liu L, Hood S, Wang Y, et al. Direct enzymatic assay for HbA1c% in human whole blood samples. Clin Biochem 2008;41:576–583. [DOI] [PubMed] [Google Scholar]
- 22. Ozcelik F, Yiginer Ö, Serdar MA, et al. Comparison of three methods for the measurement of HbA1c. Turk J Biochem 2010;35:344–349. [Google Scholar]
- 23. Thevarajah M, Nordin N, Chew YY. Performance evaluation of the Arkray Adams HA‐8160 HbA1c analyzer. Malaysian J Pathol 2008;30:81–86. [PubMed] [Google Scholar]
- 24. Goldstein DE, Little RR, Lorenz RA, et al. Test of glycemia in diabetes. Diabetes Care 2004;27:1761–1773. [DOI] [PubMed] [Google Scholar]
- 25. Little RR. Glycated hemoglobin standardization. National Glycohemoglobin Standardization Program (NGSP) perspective. Clin Chem Lab Med 2003;41:1191–1198. [DOI] [PubMed] [Google Scholar]
- 26. International Diabetes Federation Clinical Guidelines Task Force , 2005. Global guideline for Type II diabetes. Available at http://www.idf.org
- 27. Goodall I. Standardization destination global IFCC standardization. How, why, where and when. Clin Biochem 2005;26:5–19. [PMC free article] [PubMed] [Google Scholar]
- 28. Bry L, Chen PC, Sacks DB. Effects of hemoglobin variants and chemically modified derivates on assays for glycohemoglobin. Clin Chem 2001;47:153–163. [PubMed] [Google Scholar]
- 29. Sacks DB. Hemoglobin variants and hemoglobin A1c analysis: problem solved. Clin Chem 2003;49:1245–1247. [DOI] [PubMed] [Google Scholar]
- 30. Chachou A, Randoux C, Millart H, Chanard J, Gillery P. Influence of in vivo haemoglobin carbamylation on HbA1c measurements by various methods. Clin Chem Lab Med 2000;38:321–326. [DOI] [PubMed] [Google Scholar]
- 31. Chang J, Hoke C, Ettinger B, Penerian G. Evaluation and interference study of haemoglobin A1c measured by turbidimetric inhibition immunoassay. Am J Clin Pathol 1998;109:274–278. [DOI] [PubMed] [Google Scholar]
- 32. Khuu HM, Robinson CA, Goolsby K, Hardy RW, Konrad RJ. Evaluation of a fully automated high‐performance liquid chromatography assay for haemoglobin A1c. Arch Pathol Lab Med 1999;123:763–767. [DOI] [PubMed] [Google Scholar]
- 33. Weykamp CW, Penders TJ, Sielbelder CW, Muskiet FA, van der Slik W. Interference of carbamylated and acetylated hemoglobins in assays of glycohemoglobin by HPLC, electrophoresis, affinity chromatography and enzyme immunoassay. Clin Chem 1993;39:138–142. [PubMed] [Google Scholar]


