Abstract
Background
Both albuminuria and proteinuria are important disease markers of chronic kidney disease (CKD). Their relationship and the ratio between urinary albumin and protein in patients with CKD have not been investigated. Whether clinical features can affect these measurements is not clear.
Methods
We conducted a cross‐sectional study in 602 CKD patients. Demographic data, including age, gender, and co‐morbidity such as diabetes, hypertension, hyperuricemia, and hyperlipidemia, were reviewed and recorded. Their urinary albumin, total protein, and creatinine were determined and urinary albumin to creatinine ratio (UACR), total protein to creatinine ratio (UPCR), and albumin to total protein ratio (UAPR) were calculated. Their estimated glomerular filtration rate (eGFR) was calculated according to serum creatinine. The correlation between UACR and UPCR was thus analyzed. We also investigated factors associated with these urinary measurements.
Results
UACR and UPCR increased progressively as renal function deteriorated, while UAPR increased to a plateau in CKD stage 4. There was direct relationship between UACR and UPCR. UAPR rose exponentially with the increase of both UACR and UPCR when UACR <500 mg/g or UPCR <1,000 mg/g. Multivariate regression analysis revealed diabetes and hyperuricemia were associated with increased UACR and UPCR, while both urinary parameters were inversely related to male gender and eGFR. Diabetes and hyperuricemia were associated with increased UAPR and UAPR was negatively correlated with age and eGFR.
Conclusion
There was a significant association between UACR and UPCR in patients with CKD. Characteristics of patients, renal function, and co‐morbidities all affected UACR, UPCR, and UAPR.
Keywords: albuminuria, chronic kidney disease, proteinuria
INTRODUCTION
Numerous studies have identified proteinuria or albuminuria as an independent risk factor for all‐cause and cardiovascular mortality as well as adverse renal outcome in diabetes, chronic kidney disease (CKD), and even general populations 1, 2, 3, 4. However, there have been debates on the choice between urine protein and albumin as the screening and follow‐up measurement. Though the National Kidney Foundation classifies microalbuminuria as urine albumin to creatinine ratio (UACR) 30–300 mg/g, and macroalbuminuria as >300 mg/g (nearly equivalent to positive protein dipstick) 5, it also defines proteinuria as urine total protein to creatinine ratio (UPCR) >200 mg/g, and normal as <200 mg/g 6. However, what 30 and 300 mg/g in UACR stand for in UPCR, and UPCR 200 mg/g in UACR have not been clarified.
Normal adults excrete less than 200 mg/day of protein in the urine and among it, albumin excretion is less than 30 mg/day 6. No previous study had addressed how the urine albumin to total protein ratio (UAPR) changed in different circumstances, nor was its clinical significance or implications known in CKD patients. Only on study to the best of our knowledge conducted in general population found the proportion of urine albumin in total protein rose as urine total protein increased 7. Since urine can be used noninvasively and tests of many urinary proteins have been well established, diagnostic potential of urinary proteomics is thus highly anticipated 8. Little is known about factors affecting the determination of UACR and UPCR. Furthermore, the ratio between urinary albumin and total protein has rarely been investigated in CKD patients. In the present study, we aimed to analyze the relationship between urinary excretion of albumin and total protein in a cohort of CKD based on their renal function and amount of urinary excretion of either albumin or protein. Factors affecting UACR, UPCR, and UAPR were also investigated.
MATERAILS AND METHODS
Patients
We recruited a total of 602 patients from nephrology outpatient department during the period from April 2010 to July 2010. All patients have established diagnosis of CKD based on the presence of kidney damage or estimated glomerular filtration rate (eGFR) <60 ml/min/1.73 m2 for more than 3 months, irrespective of etiology 5. Patients who had recent fever, urinary tract infection, indwelling urinary catheter were excluded. Transplant recipients or on dialysis therapy were also excluded.
Study Design
The study design is a retrospective study conducted at a single medical center. Urine albumin, total protein, and creatinine were determined simultaneously in a random urine sample, and UACR (urine albumin divided by urine creatinine), UPCR (urine total protein divided by urine creatinine), and UAPR (urine albumin divided by urine total protein) were calculated thereafter. Urine total protein was measured by colorimetric assay, using Pyrogallol red as dye‐binding, kit (Wako Diagnostics and Wako Chemicals USA, Inc., Richmond, VA). Urine albumin was measured by turbidimetric immunoassay optically at 700 nm, with human albumin as calibrator (Wako Diagnostics and Chemicals USA, Inc.). Urine creatinine was measured by colorimetric assay using MeDiPRO ceatinine kinase test.
Patients were documented for their age, gender, body mass index (BMI), associated diseases such as diabetes (identified by history, diagnosis barcode, current use of oral antidiabetic agents, insulin injections, or serum glycated hemoglobin >6.5%), hypertension (identified by history, diagnosis barcode, systolic blood pressure over 140 mmHg and/or diastolic blood pressure over 90 mmHg for more than two outpatient department visits, or concomitant use of antihypertensive agents), hyperlipidemia (identified by fasting serum total cholesterol or triglyceride above the upper limit of our laboratory reference range, >200 and >150 mg/dl, respectively, or concomitant use of statin or other lipid lowering agents), and hyperuricemia (identified by history, diagnosis barcode, current use of allopurinol or uricosuric agents, or serum uric acid above the upper limit of our laboratory reference range, >8.3 mg/dl). Their renal function eGFR was calculated by equation derived from the Modification of Diet in Renal Disease (MDRD) Study 9. The study protocol was approved by the Ethics Committee on Human Research at our institution (99‐3090B).
Statistics
The characteristics of study subjects were summarized using descriptive statistics with categorical data as counts with percentages and continuous data as mean with standard deviations, except UACR and UPCR as median and interquartile range (25th and 75th percentiles). We have examined the distribution of UAPR by normal Q‐Q plot, which proves normality in our samples. We used chi‐square test to examine differences in categorical variables, Mann–Whitney U‐test in UACR and UPCR, and Student's t‐tests in other continuous variables between diabetics and nondiabetics. We applied Kruskal–Wallis test and Nemenyi‐Damico‐Wolfe‐Dunn's post hoc test to test differences in UACR and UPCR among different CKD stages. Univariate analysis was performed using simple linear regression for categorical and continuous variable. Significant factors identified in univariate analysis were included in the multivariate analysis using multiple linear regression. A P‐value < 0.05 is considered statistically significant. Statistical analyses were performed with R software for windows, version 2.12.0. Copyright © 2010 The R Foundation for Statistical Computing.
RESULTS
Demographic Data
Table 1 lists the demographic characteristics of a total of 602 participants. Male accounted for 60% of study subjects; their mean age was 62.1 ± 13.4 years old; mean eGFR was 45.9 ± 28.6 ml/min/1.73 m2. The proportion of CKD from stage 1 to 5 was 8.3, 20.3, 37.4, 18.4, and 15.6%. Among enrolled patients, 88.9% had hypertension, 41.9% diabetes, 32.1% hyperuricemia, and 66.3% hyperlipidemia.
Table 1.
Demographic Data of 602 Participants, Including Diabetics and Nondiabetics
| Total (N = 602) | Diabetics (N = 252, 41.9%) | Nondiabetics (N = 350, 58.1%) | P‐value | |
|---|---|---|---|---|
| Age, years | 62.1 ± 13.4 | 64.7 ± 10.8 | 60.3 ± 14.7 | <0.0001 |
| Gender, men (%) | 60 | 61.5 | 58.9 | 0.5126 |
| Body mass index, kg/m2 | 25.6 ± 3.8 | 26.6 ± 3.6 | 24.9 ± 3.8 | <0.0001 |
| Hypertension (%) | 88.9 | 95.6 | 84 | <0.0001 |
| Hyperuricemia (%) | 32.1 | 27.4 | 35.4 | 0.0369 |
| Hyperlipidemia (%) | 66.3 | 73 | 61.4 | 0.0030 |
| Serum creatinine, mg/dL | 2.2 ± 1.9 | 2.2 ± 1.8 | 2.2 ± 2.0 | 0.7530 |
| eGFR, ml/min/1.73 m2 (MDRD) | 45.9 ± 28.6 | 43.8 ± 26.8 | 47.4 ± 29.8 | 0.1260 |
| UACR, mg/g | 189 (35–806) | 309 (57–1,286) | 140 (26–564) | <0.0001 |
| UPCR, mg/g | 376 (120–1,256) | 583 (157–2,161) | 311 (94–994) | <0.0001 |
| UAPR | 0.49 ± 0.22 | 0.51 ± 0.20 | 0.46 ± 0.23 | 0.0050 |
| Glycated hemoglobin, % | 7.3 ± 1.5 | |||
| CKD stage 1 and 2 (%) | 28.58 | 27 | 29.7 | 0.5610 |
| CKD stage 3 (%) | 37.38 | 36.5 | 38 | |
| CKD stage 4 (%) | 18.44 | 21 | 16.6 | |
| CKD stage 5 (%) | 15.61 | 15.5 | 15.7 |
Age, body mass index, serum creatinine, eGFR, UAPR, and glycated hemoglobin are expressed as mean ± standard deviations.
Gender, hypertension, diabetes, hyperuricemia, and hyperlipidemia are expressed as percentage.
UACR and UPCR are expressed as median with interquartile range.
eGFR, estimated glomerular filtration rate; MDRD, Modification of Diet in Renal Disease study; UACR, urine albumin to creatinine ratio; UPCR, urine total protein to creatinine ratio; UAPR, urine albumin to total protein ratio; CKD, chronic kidney disease.
P‐value indicates the significance of difference between diabetics and nondiabetics.
In comparison between diabetics and nondiabetics, diabetes was associated with higher UACR, UPCR, and UAPR. Prevalence of hypertension and hyperlipidemia were more commonly seen in diabetics, while hyperuricemia was less observed. With similar eGFR, diabetics were older, had higher BMI.
UACR, UPCR, and UAPR
The median UACR and UPCR and interquartile ranges were 189 (35–806) and 376 (120–1,256) mg/g, respectively. Average UAPR was 0.49 ± 0.22. The distributions of UACR, UPCR, and UAPR of five CKD stages are illustrated in Table 2. At early stage (1 and 2), median UACR was 59 (15–316) mg/g, UPCR 169 (82–621) mg/g, and UAPR 0.44 ± 0.25. At stage 3, UACR was 89 (20–555) mg/g, UPCR 226 (80–814) mg/g, and UAPR 0.47 ± 0.23. There was no significant difference between early stage and stage 3. At stage 4, median UACR was 555 (159–1,556) mg/g, UPCR 937 (352–2,335) mg/g, and UAPR 0.59 ± 0.17, all were significantly higher than that of early stage (all P < 0.0001) and stage 3 (P < 0.0001 for UACR and UPCR, P < 0.01 for UAPR). At stage 5, median UACR was 647 (265–1,617) mg/g, UPCR 1,166 (685–3,027) mg/g, both were significantly higher than that of early stage (both P < 0.0001); the UAPR was 0.49 ± 0.18, which was lower than stage 4 (P < 0.01).
Table 2.
Comparisons of Urine Albumin to Total Protein Ratio (UAPR), Albumin To Creatinine Ratio (UACR), and Total Protein To Creatinine Ratio (UPCR) of Five Chronic Kidney Disease (CKD) Stages
| CKD stage | Number (% of total) | UACR | UPCR | UAPR |
|---|---|---|---|---|
| 1 and 2 | 172 (28.58) | 59 (15–316) | 169 (82–621) | 0.44 ± 0.25 |
| 3 | 225 (37.38) | 89 (20–555) | 226 (80–814) | 0.47 ± 0.23 |
| 4 | 111 (18.44) | 555 (159–1,556)a, b | 937 (352–2,335)a, b | 0.59 ± 0.17a, c |
| 5 | 94 (15.61) | 647 (265–1,617)a, b | 1,166 (685–3,027)a, b | 0.49 ± 0.18d |
UACR and UPCR are expressed as median with interquartile range.
UAPR is expressed as mean ± standard deviations.
P < 0.0001 compared with stages 1 and 2.
P < 0.0001 compared with stage 3.
P < 0.01 compared with stage 3.
P < 0.01 compared with stage 4.
Overall, UACR had a good correlation with UPCR (coefficient of determination, R 2 = 0.94, P < 0.0001, Fig. 1A). There was no significant correlation between
Figure 1.
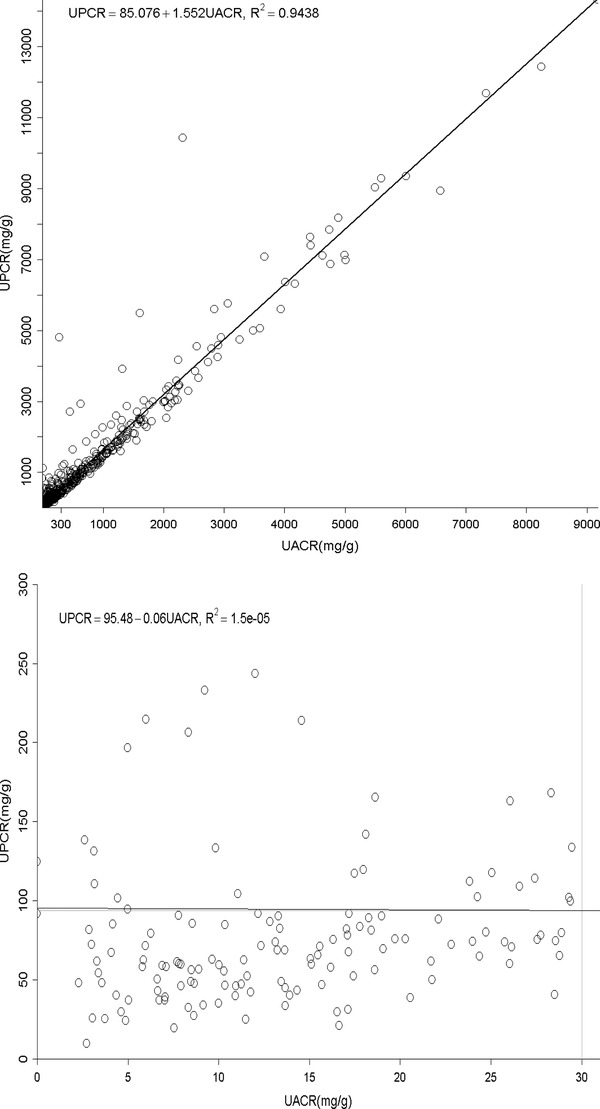
(A) The relationship between urine albumin to creatinine ratio (UACR) and total protein to creatinine ratio (UPCR) of all albuminuria range. (B) The relationship between urine albumin to creatinine ratio (UACR) and total protein to creatinine ratio (UPCR) of normal albuminuria range (<30 mg/g). (C) The relationship between urine albumin to creatinine ratio (UACR) and total protein to creatinine ratio (UPCR) of microalbuminuria range (30–300 mg/g). (D) The relationship between urine albumin to creatinine ratio (UACR) and total protein to creatinine ratio (UPCR) of macroalbuminuria range (>300 mg/g). (E) The relationship between urine total protein to creatinine ratio (UPCR) and albumin to creatinine ratio (UACR) when UPCR < 200 mg/g. (F) The relationship between urine total protein to creatinine ratio (UPCR) and albumin to creatinine ratio (UACR) when UPCR >200 mg/g.
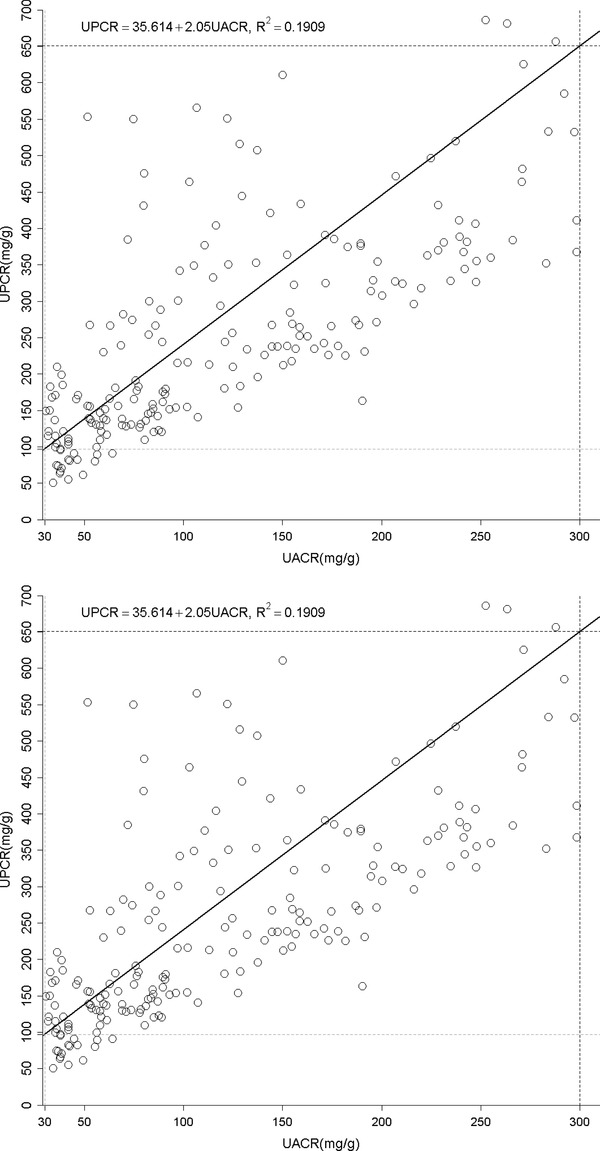
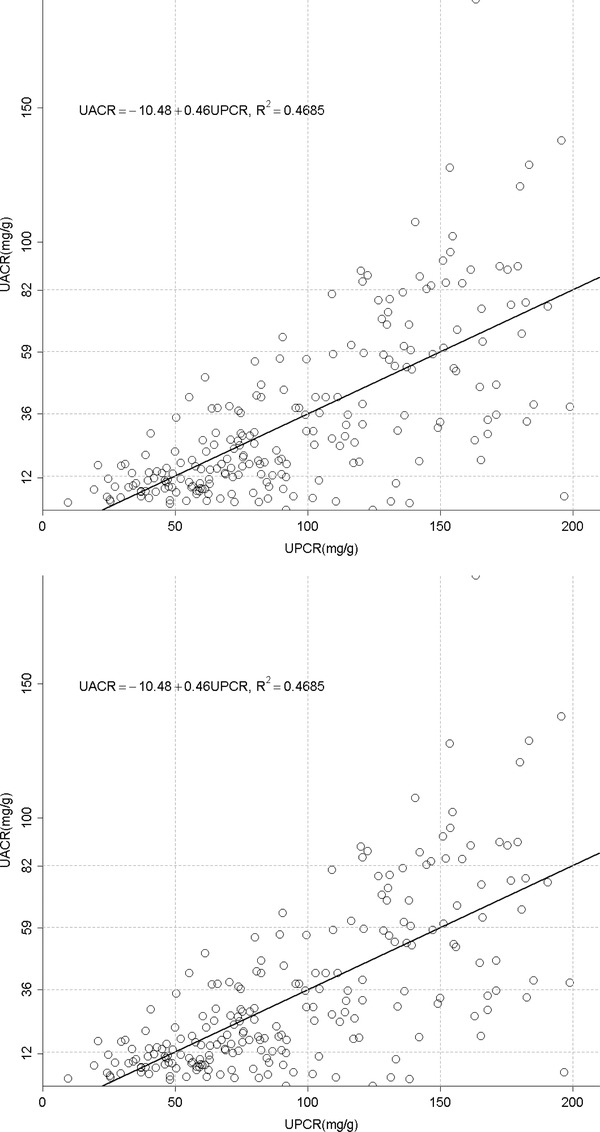
UACR and UPCR at normal range albuminuria (N = 141, Fig. 1B). When confining UACR to microalbuminuria range (N = 209), the correlation was significant (R 2 = 0.19, P < 0.0001, Fig. 1C). After expanding to macroalbuminuria range (N = 252), the correlation was stronger and almost linear (R 2 = 0.93, P < 0.0001, Fig. 1D). As for UPCR, there was direct correlation with UACR either when UPCR <200 mg/g (N = 220, R 2 = 0.47, P < 0.0001, Fig. 1E) or >200 mg/g (N = 382, R 2 = 0.93, P < 0.0001, Fig. 1F). UAPR rose exponentially as UACR and UPCR increased (Figs. 2 and 3). When UACR approached 500 or UPCR 1,000 mg/g, the exponential rises flattened.
Figure 2.
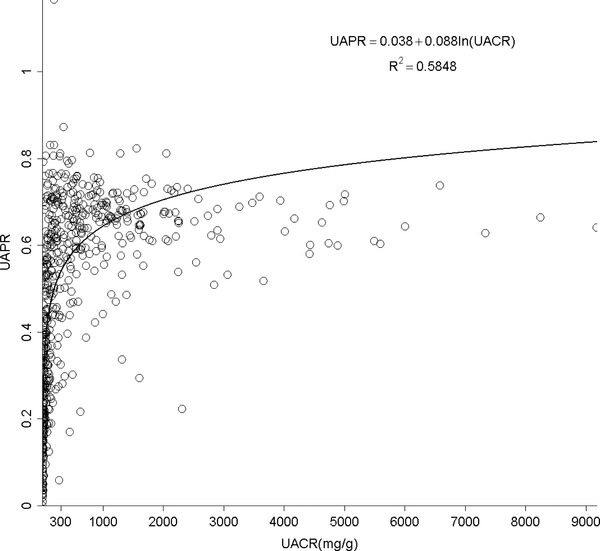
The relationship between urine albumin to total protein ratio (UAPR) and urine albumin to creatinine ratio (UACR).
Figure 3.
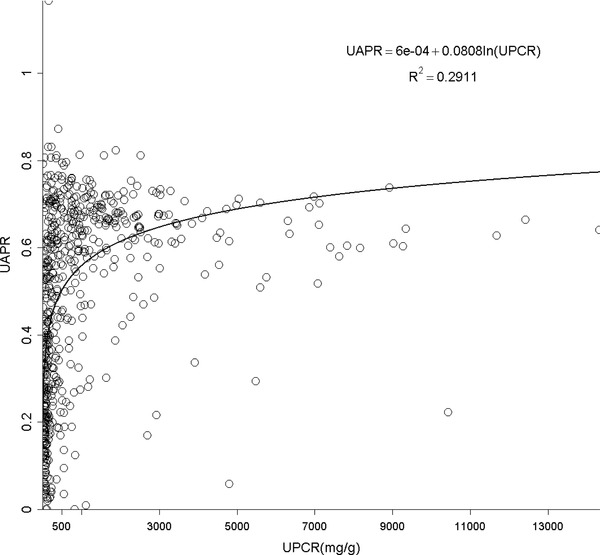
The relationship between urine albumin to total protein ratio (UAPR) and total protein to creatinine ratio (UPCR).
Factors associated with UACR, UPCR, and UAPR
Table 3.
Results of Univariate Analysis of Demographic Data and Clinical Features, Using UAPR, UACR, and UPCR as Dependent Variables
| UACR | UPCR | UAPR (%) | ||||
|---|---|---|---|---|---|---|
| Regression | Regression | Regression | ||||
| coefficient | coefficient | coefficient | ||||
| (95% confidence | (95% confidence | (95% confidence | ||||
| interval) | P‐value | interval) | P‐value | interval) | P‐value | |
| Male | −89.6 (−275.6 to 96.4) | 0.3444 | −257.3 (−554.0 to 39.4) | 0.0891 | 2.1 (−1.5 to 5.7) | 0.2542 |
| Age | 0.8 (−6.0 to 7.6) | 0.8154 | 2.6 (−8.3 to 13.4) | 0.6430 | −0.2 (−0.3 to −0.1) | 0.0056 |
| Body mass index | 5.8 (−18.5 to 30.1) | 0.6395 | 4.0 (−34.8 to 42.8) | 0.8404 | 0.5 (0.1–1.0) | 0.0280 |
| Hypertension | 430.6 (142.7–718.5) | 0.0034 | 634.9 (174.3–1,095.5) | 0.0070 | 7.9 (2.3–13.5) | 0.0058 |
| Diabetes | 466.0 (284.9–647.0) | <0.0001 | 735.3 (445.9–1,024.8) | <0.0001 | 5.1 (1.5–8.6) | 0.0054 |
| Hyperuricemia | 409.4 (216.8–602.1) | <0.0001 | 590.6 (281.9–899.2) | 0.0002 | 10.0 (6.3–13.7) | <0.0001 |
| Hyperlipidemia | 196.2 (4.0–388.5) | 0.0455 | 274.3 (−33.1 to 581.8) | 0.0802 | 4.1 (0.3–7.8) | 0.0330 |
| Serum Creatinine | 155.3 (109.1–201.5) | <0.0001 | 283.6 (210.6–356.6) | <0.0001 | 1.0 (0.1–1.9) | 0.0327 |
| eGFR | −10.6 (−13.7 to −7.6) | <0.0001 | −18.1 (−23.0 to −13.3) | <0.0001 | −0.2 (−0.2 to −0.1) | <0.0001 |
| Glycated hemoglobin | 46.9 (−54.8 to 148.5) | 0.3653 | 65.3 (−96.0 to 226.5) | 0.4263 | 1.6 (0.1–3.2) | 0.0406 |
Table 4.
Results of Multivariate Analysis of Demographic Data and Clinical Features, Using UAPR, UACR, and UPCR as Dependent Variables
| UACR | UPCR | UAPR (%) | ||||
|---|---|---|---|---|---|---|
| Regression | Regression | Regression | ||||
| coefficient | coefficient | coefficient | ||||
| (95% confidence | (95% confidence | (95% confidence | ||||
| interval) | P‐value | interval) | P‐value | interval) | P‐value | |
| Male | −205.1 (−313.6 to −96.6) | 0.0002 | −387.9 (−558.9 to −216.8) | <0.0001 | −0.8 (−4.0 to 2.4) | 0.6331 |
| Age | −2.3 (−6.4 to 1.9) | 0.2797 | −3.1 (−9.6 to 3.5) | 0.3582 | −0.3 (−0.4 to −0.2) | <0.0001 |
| Body mass index | 4.8 (−9.8 to 19.4) | 0.5175 | 8.4 (−14.6 to 31.4) | 0.4743 | 0.3 (−0.1 to 0.8) | 0.1540 |
| Hypertension | 66.3 (−109.2 to 241.7) | 0.4584 | 81.7 (−194.9 to 358.3) | 0.5619 | 3.6 (−1.6 to 8.8) | 0.1789 |
| Diabetes | 205.5 (93.1–317.8) | 0.0004 | 271.4 (94.2–448.6) | 0.0027 | 4.9 (1.6–8.3) | 0.0040 |
| Hyperuricemia | 154.8 (36.7–272.9) | 0.0103 | 256.6 (70.5–442.8) | 0.0070 | 6.0 (2.5–9.5) | 0.0009 |
| Hyperlipidemia | −8.5 (−122.8 to 105.8) | 0.8839 | −36.5 (−216.8 to 143.7) | 0.6906 | 0.6 (−2.8 to 4.0) | 0.7395 |
| eGFR | −6.1 (−8.1 to −4.1) | <0.0001 | −9.3 (−12.5 to −6.2) | <0.0001 | −0.2 (−0.2 to −0.1) | <0.0001 |
Using simple linear regression analysis, we found clinical features had significant relationship with UACR. The presence of hypertension, diabetes, hyperuricemia, hyperlipidemia, and reduced eGFR all were associated with increased UACR. When applying multivariate analysis, male gender, diabetes, hyperuricemia, and eGFR were independent associates of UACR. As for UPCR, the results of univariate and multivariate were similar to that observed in UACR. In terms of UAPR, those clinical features significantly associated with UAPR in simple linear regression were age, BMI, hypertension, diabetes, hyperuricemia, hyperlipidemia, and eGFR. Multivariate analysis revealed age, diabetes, hyperuricemia, and eGFR were independent associates with UAPR. We further compared diabetics and nondiebetics and found that gender, age, hyperuricemia, and eGFR were independent associates of UACR and UPCR in nondiabetics, but only eGFR was identified for diabetics. In nondiabetics, age, eGFR, and hyperuricemia were independent associates of UAPR. As for diabetics, significant associated were age and eGFR.
DISCUSSION
We analyzed and compared the factors affecting UACR and UPCR simultaneously in CKD population. In our examinees, their UACR and UPCR were elevated irrespective of renal function. Diabetes and hypertension have long been regarded as traditional risk factors for proteinuria and CKD 5, and the correlations between diabetes, impaired renal function, and proteinuria/albuminuria have been demonstrated in landmark studies 10, 11. Our results confirmed their impact on proteinuria in a CKD cohort. Although hypertension was associated with increased UACR and UPCR, multivariate analysis did not reveal significant relationship. Since we did not grade the severity of hypertension, it is possible that level of blood pressure may affect these urinary parameters. Of note, our study identified hyperuricemia was accompanied with increased either albuminuria or proteinuria. The concept that uric acid level may play a role in nephropathy has aroused enormous interests recently. New‐onset CKD was found independently correlated with the baseline uric acid level 12. The mechanism linking uric acid and CKD is multiple. Activation of intrarenal renin‐angiotensin and cyclooxygenase‐2 systems, endothelial dysfunction, and inflammation all have been proposed 13, 14. Hypouricemic therapy by allopurinol has been shown to help preserve kidney function in CKD patients 15. Subgroup analysis revealed that hyperuricemia affected UACR, UPCR, and UAPR in nondiabetics, but not in diabetics. Hyperuricemia might be overpowered by diabetes in terms of proteinuria/albuminuria, but plays a significant role mediating proteinuria/albuminuria in CKD patients without diabetes.
Our study indicates a strong correlation between albuminuria and proteinuria in CKD patients. Apparently, this relationship was much more significant as the amount of either albuminuria or proteinuria increased. In normoalbuminuria stage, we did not observe any association. On the contrary, their relationship was still significant in patients with UPCR less than 200 mg/g. As demonstrated in Figure 1E, UPCR 200 mg/g referred to UACR 82 mg/g. From this viewpoint, the cut‐off point of UPCR at 200 mg/g 6 or 45 mg/mmol (400 mg/g) 16 in previous issues to screen and confirm proteinuria will miss a group of patients at microalbuminuria range. It is thus suggested using microalbuminuria as a sensitive method in CKD screening. The rise in UAPR was exponential with the increase in both UACR and UPCR until UACR reached 500 mg/g or UPCR reached 1,000 mg/g, when UAPR reached a plateau around 0.6, a ratio of plasma albumin to total protein. In AusDiab Study, UAPR rose up to an average of 0.73 as UPCR increased up to 800 mg/g without a plateau found in general population 7. It is reasonable to hypothesize that in the initial stage of glomerulopathy, urine albumin leaks and becomes the dominant urine protein component. As the glomerular permselectivity deteriorates progressively, urinary loss of large molecules, such as immunoglobulin and α‐2 macroglobulin, increases. However, UAPR does not rise further and approaches the plasma albumin to total protein ratio. Additionally, ability to reabsorb and metabolize urinary proteins of renal tubule cells also diminishes in association with progressive kidney disease. It is therefore UACR and UPCR increased from early to advanced stage, but UAPR rose from early stage to stage 4, and did not increase further in stage 5.
We found several factors were strongly associated with UAPR. UAPR was inversely associated with age. It is reasonable to speculate that renal disease progresses with age. Aging process may alter architecture of glomeruli as well as tubular function, thus affect the glomerular permselectivity. The presence of diabetes and hyperuricemia not only associated with increased albuminuria and proteinuria but also with increased urinary albumin to protein ratio. Our results also show that with similar eGFR, diabetics had a twofold higher excretion of urinary excretion of albumin and protein. Furthermore, the proportions of hypertension and hyperlipidemia were significantly higher in diabetics. It indicates a more advanced renal lesion with metabolic disturbance in diabetics 17. The underling causal relationship between hyperuricemia and increased UAPR is not clear. Whether hyperuricemia causes renal pathology with resultant glomerulopathy as well as tubulointerstitial lesion or renal disease with high UAPR causes hyperuricemia remains to be determined.
It has been well recognized that proteinuria and albuminuia are surrogate end points for kidney disease progression. They have earlier rise in the course of kidney disease and remain elevated throughout compared to GFR, which remains normal until approaching levels that are associated with kidney failure 18. However, there had been question in literature to compare UPCR to UACR in detecting and monitoring kidney damage 5. Clinical practice guidelines mostly prefer a single‐voided urine specimen as the tool to quantify urine protein, for it is simplicity, consistency, and accuracy compared with 24‐hr urine collections 19. The National Kidney Foundation recommends spot urine albumin measurement by albumin‐specific dipstick or UACR as screening tool for adults at increased risk for CKD, while standard urine protein dipstick is acceptable in general population 5, 20. The KDIGO prefers random untimed spot urine albumin as the first test 21. Caring for Australians with Renal Impairment suggests initial testing for proteinuria as UPCR for high‐risk populations while UACR for diabetes patients and aboriginals and Torres Strait Islanders 22. The UK Renal Association Clinical Practice Guidelines suggests patients being investigated or treated for CKD, proteinuria detected by dipstick testing can be assessed by measurement of either UPCR or UACR, ideally on an early morning urine specimen 16. There appears to be no consensus concerning the golden standard in evaluating proteinuria. Those who support UACR as the method of choice state that UACR is conducted with standardized technology and antibodies specifically directed against albumin, whereas the UPCR is carried out with various pH indicator dyes 23. This may cause higher variability, lower sensitivity, and specificity in UPCR, especially in the low protein range. On the contrary, the indicator dye‐based concentration measurements of UPCR have the advantage of quantitiating fragmented albumin, a byproduct of tubular processing, and metabolism not detected by albumin‐specific antibodies that generated against intact molecules. Besides, UACR may miss nonalbumin proteins as mentioned above 23.
Our study has several limitations. First, 24‐hr urine collection is lacking as standardization of urine protein measurement. We adopted random urine sample without repeated confirmation. However, the simultaneous sampling of albumin and protein might hopefully decrease the variation in correlations between UACR and UPCR, and therefore UAPR. Second, we did not routinely measure serum albumin and serum protein in each CKD patient, so we failed to confirm the hypothesis that the filtered load of albumin and protein might depend partly on serum levels. Third, a longitudinal rather than epidemiologic study is required to evaluate the effectiveness and clinical significance of UAPR in predicting patients’ outcome. Fourth, the etiology for kidney damage is not determined in all participants, so we had difficulty applying UAPR in different renal diseases. Finally, most of our patients have been under medical treatment for their concurrent disease; therefore, UACR, UPCR, and UAPR are results post treatment. The modulatory effect of medications was not determined.
In conclusion, our study provides evidence of good correlation between UACR and UPCR especially when UACR >300 mg/g or UPCR >200 mg/g, whereas the correlation is relatively poor for lower UACR. Factors affected albuminuria and proteinuria were similar in CKD cohort. The UACR, UPCR, and UAPR increased gradually as CKD progressed. Age, diabetes, hyperuricemia, and eGFR were independent factors associated with UAPR.
MT Wu and KK Lam contributed equally to this study.
Conflict of interest statement: The authors declare no competing interests.
REFERENCES
- 1. Iseki K, Kinjo K, Iseki C, Takishita S. Relationship between predicted creatinine clearance and proteinuria and the risk of developing ESRD in Okinawa, Japan. Am J Kidney Dis 2004;44:806–814. [PubMed] [Google Scholar]
- 2. Ishani A, Grandits GA, Grimm RH, Svendsen KH, Collins AJ, Prineas RJ, Neaton JD. Association of single measurements of dipstick proteinuria, estimated glomerular filtration rate, and hematocrit with 25‐year incidence of end‐stage renal disease in the multiple risk factor intervention trial. J Am Soc Nephrol 2006;17:1444–1452. [DOI] [PubMed] [Google Scholar]
- 3. Hemmelgarn BR, Manns BJ, Lloyd A, James MT, Klarenbach S, Quinn RR, Wiebe N, Tonelli M; Alberta Kidney Disease Network. Relation between kidney function, proteinuria, and adverse outcomes. JAMA 2010;303:423–429. [DOI] [PubMed] [Google Scholar]
- 4. Chronic Kidney Disease Prognosis Consortium . Association of estimated glomerular filtration rate and albuminuria with all‐cause and cardiovascular mortality in general population cohorts: a collaborative meta‐analysis. Lancet 2010;375:2073–2081. [DOI] [PMC free article] [PubMed] [Google Scholar]
- 5. National Kidney Foundation . K/DOQI clinical practice guidelines for chronic kidney disease: evaluation, classification, and stratification. Am J Kidney Dis 2002;39:S1–S266. [PubMed] [Google Scholar]
- 6. Levey AS, Cattran D, Friedman A, Miller WG, Sedor J, Tuttle K, Kasiske B, Hostetter T. Proteinuria as a surrogate outcome in CKD: report of a scientific workshop sponsored by the National Kidney Foundation and the US Food and Drug Administration. Am J Kidney Dis 2009;54:205–226. [DOI] [PubMed] [Google Scholar]
- 7. Atkins RC, Briganti EM, Zimmet PZ, Chadban SJ. Association between albuminuria and proteinuria in the general population: the AusDiab Study. Nephrol Dial Transplant 2003;18:2170–2174. [DOI] [PubMed] [Google Scholar]
- 8. Hortin GL, Sviridov D. Diagnostic potential for urinary proteomics. Pharmacogenomics 2007;8:237–255. [DOI] [PubMed] [Google Scholar]
- 9. Levey AS, Bosch JP, Lewis JB, Greene T, Rogers N, Roth D. A more accurate method to estimate glomerular filtration rate from serum creatinine: a new prediction equation. Modification of Diet in Renal Disease Study Group. Ann Intern Med 1999;130:461–470. [DOI] [PubMed] [Google Scholar]
- 10. Parving HH, Gall MA, Skøtt P, Jørgensen HE, Løkkegaard H, Jørgensen F, Nielsen B, Larsen S. Prevalence and causes of albuminuria in non‐insulin‐dependent diabetic patients. Kidney Int 1992;41:758–762. [DOI] [PubMed] [Google Scholar]
- 11. Pinto‐Sietsma SJ, Janssen WM, Hillege HL, Navis G, De Zeeuw D, De Jong PE. Urinary albumin excretion is associated with renal functional abnormalities in a nondiabetic population. J Am Soc Nephrol 2000;11:1882–1888. [DOI] [PubMed] [Google Scholar]
- 12. Sonoda H, Takase H, Dohi Y, Kimura G. Uric acid levels predict future development of chronic kidney disease. Am J Nephrol 2011;33:352–357. [DOI] [PubMed] [Google Scholar]
- 13. Kang DH, Nakagawa T. Uric acid and chronic renal disease: possible implication of hyperuricemia on progression of renal disease. Semin Nephrol 2005;25:43–49. [DOI] [PubMed] [Google Scholar]
- 14. Kanbay M, Yilmaz MI, Sonmez A, Turgut F, Saglam M, Cakir E, Yenicesu M, Covic A, Jalal D, Johnson RJ. Serum uric acid level and endothelial dysfunction in patients with nondiabetic chronic kidney disease. Am J Nephrol 2011;33:298–304. [DOI] [PMC free article] [PubMed] [Google Scholar]
- 15. Siu YP, Leung KT, Tong MK, Kwan TH. Use of allopurinol in slowing the progression of renal disease through its ability to lower serum uric acid level. Am J Kidney Dis 2006;47:51–59. [DOI] [PubMed] [Google Scholar]
- 16. Burden R, Tomson C. Guideline Development Committee, Joint Specialty Committee on Renal Disease of the Royal College of Physicians of London and the Renal Association: identification, management and referral of adults with chronic kidney disease: concise guidelines. Clin Med 2005;5:635–642. [DOI] [PMC free article] [PubMed] [Google Scholar]
- 17. Lorenzo V, Saracho R, Zamora J, Rufino M, Torres A. Similar renal decline in diabetic and non‐diabetic patients with comparable levels of albuminuria. Nephrol Dial Transplant 2010;25:835–841. [DOI] [PubMed] [Google Scholar]
- 18. Stevens LA, Greene T, Levey AS. Surrogate end points for clinical trials of kidney disease progression. Clin J Am Soc Nephrol 2006;1:874–884. [DOI] [PubMed] [Google Scholar]
- 19. Miller WG, Bruns DE, Hortin GL, Sandberg S, Aakre KM, McQueen MJ, Itoh Y, Lieske JC, Seccombe DW, Jones G, Bunk DM, Curhan GC, Narva AS; National Kidney Disease Education Program-IFCC Working Group on Standardization of Albumin in Urine. Current issues in measurement and reporting of urinary albumin excretion. Clin Chem 2009;55:24–38. [DOI] [PubMed] [Google Scholar]
- 20. National Kidney Foundation . Kidney disease outcomes quality improvement (K/DOQI™) clinical practice guidelines and clinical practice recommendations for diabetes and chronic kidney disease. Am J Kidney Dis 2007;49:S1–S180. [Google Scholar]
- 21. Levey AS, Eckardt KU, Tsukamoto Y, Levin A, Coresh J, Rossert J, De Zeeuw D, Hostetter TH, Lameire N, Eknoyan G. Definition and classification of chronic kidney disease: a position statement from kidney disease: improving global outcomes (KDIGO). Kidney Int 2005;67:2089–2100. [DOI] [PubMed] [Google Scholar]
- 22. Caring for Australians with Renal Impairment (CARI) .The CARI guidelines. Urine protein as diagnostic test: testing for proteinuria. Nephrology (Carlton) 2004;9( Suppl 3):S3–S7. [DOI] [PubMed] [Google Scholar]
- 23. Yee J. Albuminuria and prognosis in CKD: truth be told. Adv Chronic Kidney Dis 2011;18:219–221. [DOI] [PubMed] [Google Scholar]


