

Abstract
Serine proteases convert plasminogen to plasmin which is involved in tissue remodeling under physiologic and pathophysiologic conditions, including breast carcinoma invasion and progression. Both urokinase‐type plasminogen activator (uPA) and pro‐uPA associate with uPA receptor (uPAR) on target cells, where plasminogen activator inhibitors (e.g., PAI‐1) may modulate their activities. Expression levels of these factors were compared in breast carcinomas relative to patient characteristics, carcinoma features, and clinical outcome. uPA, uPAR, and PAI‐1 were quantified by enzyme‐linked immunosorbent assay (ELISA) in extracts of 226 biopsies while estrogen receptor (ER) and progestin receptor (PR) were determined by enzyme immunoassay (EIA) or radio‐ligand binding. Each set of assays contained a novel reference specimen with known quantities of each of these five analytes. Levels in ng/mg protein of these biomarkers exhibited ranges: uPA (0–12.3); uPAR (0–19.5); PAI‐1 (0–91.2). When considered independently, expression of uPA, uPAR, or PAI‐1 was unrelated to patient age or menopausal status. Although no correlation was observed between each analyte with stage, grade, or ER/PR status, levels appeared to differ with pathology and nodal status. A dendrogram from hierarchical clustering of uPA, uPAR, and PAI‐1 levels in 106 specimens revealed three clusters of breast cancer patients. Kaplan–Meier analyses of uPA, uPAR, and PAI‐1 indicated a correlation with overall survival (OS), suggesting collective examination of these biomarkers is useful in predicting clinical outcome of breast cancer.
Keywords: uPA, uPAR, PAI‐1, estrogen receptor, progestin receptor, breast carcinoma
INTRODUCTION
Breast carcinoma is the leading form of cancer in women in that there is a one in eight chance of developing it by age of 90 years 1. In 2010, there were 207,090 women diagnosed with breast cancer, and 39,840 women died of the disease (Surveillance Epidemiology and End Results [SEER] data at http://seer.cancer.gov). Even though the American population has an increasing awareness of risks associated with breast cancer leading women to seek early diagnostic testing, there is a need for improved predictors of prognosis and management to improve survival for these patients.
Tumor invasion of the basement membrane and extracellular matrix are associated with metalloproteases, cathepsins, and cellular serine proteases 2. Cellular serine proteases such as urokinase‐type plasminogen activator (uPA) covert plasminogen to plasmin, which is involved in tissue remodeling and directly mediates pericellular proteolysis during cell migration 3 under physiological and pathological conditions (e.g., breast involution and wound healing). uPA and its precursor, pro‐uPA, are secreted from the cells and then bind to same receptor protein (uPA receptor [uPAR]) on the cell surface. Plasminogen activator inhibitors (e.g., PAI‐1) modulate uPA and pro‐uPA activities even when bound to uPAR. Accumulating data examining these analytes independently indicates high levels of uPA, uPAR, and PAI‐1 in tumors are correlated with poor patient prognosis in many types of human cancers 4. uPA is the first proteinase shown to have prognostic significance in human malignancy 4, 5. In breast cancer, uPA was found to be as strong a prognostic marker as nodal status and stronger than tumor size and estrogen receptor (ER) status 4, 6, 7, 8, 9, 10. Although data for malignancies other than breast cancer are preliminary and often conflicting, uPA has been suggested as a prognostic factor in carcinomas of the lung 11, bladder 12, stomach 13, colorectum 14, cervix 15, ovary 16, 17, endometrium 18, kidney 19, brain 20, and soft tissue sarcomas 21.
In several studies, PAI‐1 and uPA have been reported to play a role in mediating breast carcinoma invasion and progression 4, 8, 22, and are considered independent predictive factors of poor relapse‐free and overall survival (OS) in both node‐negative and node‐positive breast cancer patients 8, 23. In several studies, Harbeck and co‐workers reported that levels of uPA and PAI‐1 are useful biomarkers to consider when selecting patients for adjuvant chemotherapy particularly those that are node negative at the time of presentation of breast cancer 24, 25. The purpose of this study was to investigate the distribution and expression levels of uPA, uPAR, and PAI‐1 in breast carcinomas relative to certain patient characteristics (e.g., age, menopausal status, race, family history) and carcinoma features (e.g., ER/PR status, pathological subtype, nodal status, tumor grade, and stage), while examining their interrelationships associated with clinical outcome.
MATERIALS AND METHODS
Patient and Tissue Samples
An IRB‐approved Database and Biorepository composed of de‐identified tissue specimens previously collected under stringent conditions 26 for clinical assays of tumor markers such as ER and progestin receptor (PR) and associated clinical information served as a source of the study materials. De‐identified specimens of primary invasive ductal carcinoma (IDC) obtained between 1988 and 1997 were examined using REMARK criteria 27. Patients were treated with the standard of care at the time of diagnosis. The retrospective study group consisted of 226 de‐identified breast cancer tissue biopsies from patients who underwent surgical procedures. The median patient age was 61.5 years (range 18 to >89). After histopathologic examination, representative tissue samples were frozen immediately, transported to the laboratory on dry ice and stored at −80°C. Patient records included race and age of each patient at diagnosis and levels of ER, PR, uPA, uPAR, and PAI‐1. Menopausal status was assigned using a cutoff of 55 years (i.e., patients less than 55 years were considered premenopausal while those 55 years or greater were considered postmenopausal). Additional records for 106 of these patients included pathology, stage, size of the lesion, tumor grade, nodal status, treatment information, disease‐free survival (DFS) and OS. The median observation time was 66.5 months (range 2–96 months). Characteristics of this patient population with clinical follow‐up are listed in Table 1.
Table 1.
Clinical Characteristics of Patient Population
| Patient parameters | n |
|---|---|
| Median age (range): 59 years (26–89.5) | 106 |
| Median observation time (range): 67 months (2–96) | |
| Median tumor size (range): 24 mm (1–105) | |
| Race | |
| White | 82 |
| Black | 14 |
| Histology | |
| Invasive ductal carcinoma | 79 |
| Lobular carcinoma | 9 |
| Comedocarcinoma | 5 |
| Mucinous carcinoma | 5 |
| Stage | |
| 0 | 4 |
| I | 26 |
| IIA | 30 |
| IIB | 21 |
| IIIA | 3 |
| IIIB | 7 |
| IV | 9 |
| Grade | |
| 1 | 8 |
| 2 | 36 |
| 3 | 38 |
| 4 | 2 |
| Estrogen receptor status | |
| Negative | 38 |
| Positive | 68 |
| Lymph node status | |
| Negative | 47 |
| Positive | 45 |
| Recurrence status | |
| Yes | 17 |
| No | 66 |
| Never disease free | 23 |
Tissue Extraction
Extracts were prepared from 100 mg frozen breast cancer tissue specimens. Samples were sliced using a scalpel, homogenized in TBS buffer (0.02 M Tris‐HCl, 0.125 M NaCl; pH 8.5) containing 1% Triton X‐100 using a POLYTRON PT‐10‐20‐3500 (Kinematia, Gmbn., Luzern, Switzerland). The homogenate was incubated for 16 hr at 4°C and centrifuged at 40,000 g for 60 min at 4°C in a fixed angle 50.3 Ti rotor (Beckman, Palo Alto, CA) to prepare the extracts containing the analytes. Final protein concentration of each extract was adjusted with TBS buffer, pH 8.5, to 2–3 mg/ml.
Determination of uPA, uPAR, and PAI‐1
Biochemical analyses of uPA, uPAR and PAI‐1 were performed using the sandwich ELISA, which employs either murine monoclonal anti‐human uPA, rabbit polyclonal anti‐human uPAR, or anti‐human PAI‐1 antibodies coated on 96‐well plates (IMUBIND, American Diagnostica Inc., Greenwich, CT). The uPA assay recognizes pro‐uPA, high molecular weight uPA, receptor‐bound uPA, and uPA complexed with PAI‐1 and PAI‐2. With the uPAR assay, both soluble and native (membrane associated) uPAR as well as complexes of either uPAR/uPA or uPAR/uPA/PAI‐1 are all recognized. The PAI‐1 assay determined both active and inactive forms of free PAI‐1 and PAI‐1 complexes.
Extracts were diluted 1:20 in assay buffer, and 100 μl aliquots of each extract were incubated overnight at 4°C in precoated micro‐test wells (IMUBIND, American Diagnostica Inc.). Wells were washed thoroughly (four times) using wash buffer, and a secondary biotinylated antibody for each analyte, which recognizes a specific epitope on either uPA, uPAR or PAI‐1 molecules, was added. Wells were washed again after an incubation of 1 hr, and 100 μl of enzyme conjugate was added (streptavidin‐conjugated horseradish peroxidase), leading to the formation of the antibody–enzyme detection complex. After a 1‐hr incubation, wells were washed again. Then 100 μl of perborate 3,3′,5,5′ tetramethylbenzidine substrate was added to each well and reacted with horseradish peroxidase producing a blue solution. Sulfuric acid (0.5 M) was used as a stopping solution, which yielded a yellow color in the reaction. The levels of either uPA, uPAR, or PAI‐1 were quantified by measuring the absorbance at 450 nm, using a microplate reader (DuPont Instruments, Wilmington, DE) and interpolating them with absorbencies of the standard curve. The final concentration of each analyte was expressed in nanogram of uPA, uPAR, or PAI‐1 per microgram extract protein.
Determination of specific binding capacities of ER, PR, and EGFR, and levels of HER‐2/neu
Specific binding capacities of ER 28, PR 28, and epidermal growth factor receptor (EGFR) 29, and the level of human epidermal growth factor receptor‐2 (HER‐2/neu) oncoprotein 30 were determined as described earlier. ER and PR measurements were performed by enzyme immunoassay (EIA) and/or ligand‐binding methods using standardized reagents in the presence of a reference specimen 26.
Statistical analyses
Scatter plots, regressions, box and whisker plots, Kaplan–Meier plots, t‐tests, and analysis of variance (ANOVA) were performed in GraphPad Prism® 5. Cox regressions and hierarchical clustering were performed in IBM® SPSS® Statistics 19.
RESULTS AND DISCUSSION
Relationship of uPA, uPAR, and PAI‐1 with Clinical Parameters
Patient age and menopausal status
To identify associations between patient age and the expression of the uPA family of proteins, correlations of patient age with the concentration uPA, uPAR, and PAI‐1 present in the tissue biopsy were performed (data not shown). Linear regression of the scatter plots revealed no significant correlation of age with either uPA (P = 0.70, n = 221), uPAR (P = 0.08, n = 222), or PAI‐1 levels (P = 0.94, n = 224), similar to the results found by Foekens et al. 8 and by Wolff et al. 31 for correlation with uPA.
To determine associations between the menopausal status of the patient and expression of the uPA family of analytes, concentration uPA, uPAR, and PAI‐1 of tissue biopsies from premenopausal and postmenopausal patients were compared using box and whisker plots (data not shown). To determine differences in protein levels, t‐tests were performed comparing levels in premenopausal patients to those of postmenopausal patients. No significant difference in protein levels was observed for each of the analytes (uPA, P = 0.28; uPAR, P = 0.08; PAI‐1, P = 0.53), implying the endocrine status of a breast cancer patient is not related.
Many studies have linked the risk of breast cancer to the time of natural menopause, but the importance of menopausal status appears related to its duration from menarche 32. This implies women who exhibit an early menarche to first pregnancy interval and have a later menopause are at higher risk for breast cancer. Clavel‐Chapelon et al. 33 found that breast cancer risk increased with age at first full‐term pregnancy by 5% per year for breast cancer diagnosed early or before the menopause and by 3% for cancers diagnosed late or after the menopause. Perhaps the clinical utility of uPA, uPAR, and PAI‐1 may be greater in early‐stage breast cancers of premenopausal patients.
Race and family history
To identify associations between patient race and members of the uPA family, comparisons of analyte protein levels in Black and in White patients were evaluated in breast carcinomas using box and whisker plots (data not shown). To ascertain differences in analyte levels, t‐tests were performed comparing concentrations in biopsies from Black patients (n = 14) to those of White patients (n = 82). No significant difference in analyte levels was observed (uPA, P = 0.50; uPAR, P = 0.22; PAI‐1, P = 0.30).
When comparing the levels of uPA, uPAR, and PAI‐1, it is important to consider that the patient population of this study only examined biopsies from patients of Caucasian and African–American decent. There are populations at higher risk, such as those of Asian descent 34 and Hispanic women 35, which can be correlated with the amount of diagnostic and surveillance care available. When a population of women receiving mammograms was considered, it was shown that African–American women are more likely than Caucasian women to receive additional testing and workup 36.
To identify an association between a patient's family history of breast cancer and the expression of the uPA family, analyte levels in tissue biopsies from patients without a family history of breast cancer were compared to those of women with a family history of breast cancer using box and whisker plots (data not shown). Using t‐tests, no significant differences in analyte levels in breast cancers were observed (uPA, P = 0.19; uPAR, P = 0.66; PAI‐1, P = 0.25).
ER and PR
To assess relationships between ER levels in the breast tissue and the expression of the uPA family of proteins, correlations of ER with either uPA, uPAR, or PAI‐1 levels in the biopsy tissue were performed (data not shown). Linear regression of the scatter plots revealed no significant correlation of ER levels with either uPA (n = 221), uPAR (n = 222), or PAI‐1 (n = 225). Although a previous study 31 reported a correlation of uPA with ER levels determined by reverse‐phase protein microarray, no correlation was found with the steroid hormone receptor status of the medical records of the same patients.
Similar analyses were performed between PR levels in the breast tissue and the uPA family of proteins. Correlations were performed on PR with either uPA, uPAR, or PAI‐1 levels in the biopsy tissue (data not shown). Linear regression of the scatter plots revealed no significant correlation of PR levels with either uPA (n = 220), uPAR (n = 222), or PAI‐1 (n = 226), similar to that observed with ER.
Some studies have suggested that serum proteases are directly modulated by the ER status of the breast carcinoma, leading to a difference in prognostic effectiveness. In a patient population with high ER‐positive cancer, there was a less favorable prognosis for patients with a high PAI‐1 level in their breast cancers when compared to patients with a lower PAI‐1 37. While PAI‐1 levels correlated directly with an increase in histological grade, a negative correlation was observed when PAI‐1 was compared with ER status 38. This correlation may be due to levels of ER and PR mRNA that appear to be inversely related to tumor size and grade 39.
Pathological subtypes
Since breast carcinomas exhibit various types of pathologies, expression levels of the uPA family of analytes were evaluated in biopsies of IDC, lobular carcinoma, comedocarcinoma, or mucinous carcinoma using box and whisker plots (uPA, Fig. 1A; uPAR, Fig. 1B; PAI‐1, Fig. 1C). Although there are fewer patients exhibiting the more rare subtypes (comedocarcinoma and mucinous carcinomas) compared to IDC and lobular carcinoma (Table 1), ANOVA (Kruskal–Wallis) was performed to determine if each of the pathological types exhibit the same median protein level of each analyte. When comparing the expression of uPA in the various cancers exhibiting different pathologies, a P value of 0.001 was obtained indicating the differences in uPA expression in each group were not due to chance. A Dunn's post test indicated a statistically significant difference (P < 0.05) in carcinomas from patients with IDC compared to those with lobular carcinoma.
Figure 1.
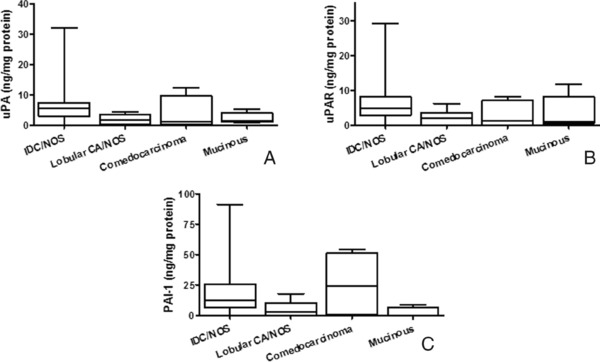
Expression of uPA, uPAR, and PAI‐1 in breast cancer exhibiting various pathologies. Box and whisker plots illustrate levels of uPA (A), uPAR (B), and PAI‐1 (C) in patients with invasive ductal carcinoma (IDC), lobular carcinoma, comedocarcinoma, or mucinous carcinoma.
A P value of 0.004 was obtained when comparing the expression of uPAR in biopsies exhibiting various pathologies, indicating the differences observed in uPAR levels in each group were not due to chance. A Dunn's post test indicated a significant difference (P < 0.05) in carcinomas from patients with IDC compared to those with lobular carcinoma, similar to that observed with uPA. A comparison of the expression of PAI‐1 in cancers classified with various pathologies gave a P value of 0.004, suggesting the differences in PAI‐1 expression in each group also were not due to chance. A Dunn's post test indicated a significant difference (P < 0.05) in between the patients with IDC and those with lobular carcinoma, as well as between patients with IDC and those with mucinous carcinoma.
Aggressive phenotypes of IDC have been reported to exhibit elevated uPAR, as measured by immunohistochemistry, which was not observed in the stromal cells 40. Levels of uPAR and PAI‐1 in myoepithelial cells of ductal carcinoma in situ (DCIS) have been reported to correlate with an increased risk for invasion of the breast carcinoma 41. Hildenbrand et al. suggested PAI‐1 contributes to the loss of the anti‐invasion myoepithelial layer allowing the carcinoma to become more invasive 41.
Tumor grade
Tumor grade is a histological feature associated with the diagnosis of breast cancer and assessment of prognosis of the patient. To identify associations between tumor grade and protein levels of either uPA (Fig. 2A), uPAR (Fig. 2B), or PAI‐1 (Fig. 2C), analytes were compared in grade 1 (n = 9), 2 (n = 35), and 3 tumors (n = 38) using box and whisker plots. No differences in expression of uPA (P = 0.24), uPAR (P = 0.49), or PAI‐1 (P = 0.12) were observed by ANOVA (Kruskal–Wallis), similar to that reported by Wolff et al. 31 for uPA and grade. Hurd et al. 42 determined that uPA, uPAR, and PAI‐1 were expressed in both high‐ and low‐grade DCIS, and that co‐expression of uPA and uPAR may improve identification of DCIS with increased potential for invasion. Furthermore, Manders et al. 23 reported that complexes of uPA and PAI‐1 in high‐grade, node‐negative invasive breast carcinoma indicate a worse prognosis 23. Thus, tumor grade and expression of these analytes appear interrelated.
Figure 2.
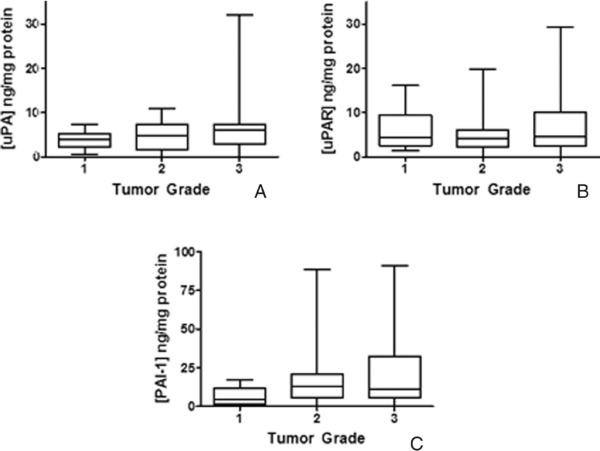
Expression of uPA, uPAR, and PAI‐1 in breast cancer of patients with differing tumor grade. Box and whisker plots illustrate levels of uPA (A), uPAR (B), and PAI‐1 (C) in patients with grade 1, 2, or 3 tumors.
Nodal status
Nodal status of a breast cancer patient is one of the most reliable prognostic markers for predicting metastasis and selecting adjuvant therapeutic treatments. To identify associations between nodal status and levels of either uPA (Fig. 3A), uPAR (Fig. 3B), or PAI‐1 (Fig. 3C), breast cancers from both node‐negative (n = 47) and node‐positive patients (n = 45) were evaluated. t‐tests indicated a significant difference (P = 0.01) in PAI‐1 protein levels in node‐negative patients compared to those of node‐positive patients. No significant difference in protein levels was observed for either uPA (P = 0.08) or uPAR (P = 0.13).
Figure 3.
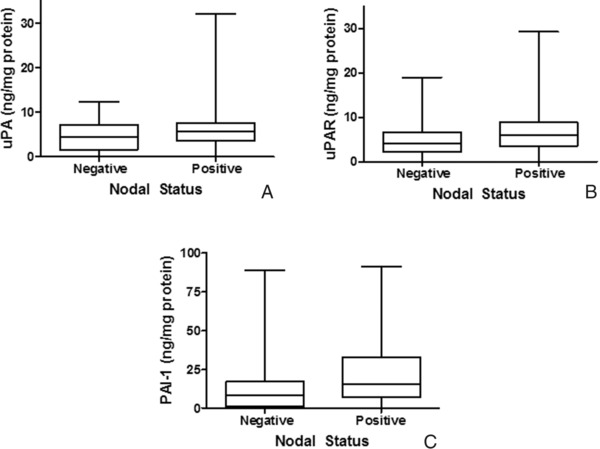
Relationship between nodal status and uPA, uPAR, and PAI‐1 in breast cancer. Box and whisker plots illustrate levels of uPA (A), uPAR (B), and PAI‐1 (C) in node‐negative and node‐positive breast cancer patients.
Wolff et al. 31 found that PAI‐1 expression was correlated with nodal stage, but not with other patient parameters. With the implementation of uPA and PAI‐1 levels as prognostic factors, approximately one‐half of the node‐negative breast cancer patients labeled as low risk from adjuvant chemotherapy were spared adjuvant chemotherapy, while patients with high‐risk node‐negative cancers appeared to benefit from adjuvant chemotherapy 43.
Breast cancer stage
To examine associations between the stage of breast cancer and levels of either uPA (Fig. 4A), uPAR (Fig. 4B), or PAI‐1 (Fig. 4C), box and whisker plots were used to evaluate stage 0 (n = 4), I (n = 26), II (n = 51), III (n = 10), or IV patients (n = 9). No differences in expression of either uPA (P = 0.17), uPAR (P = 0.52), or PAI‐1 (P = 0.32) were observed by ANOVA (Kruskal–Wallis); however, the small sample size in breast cancers of stages 0 and IV may compromise the conclusion.
Figure 4.
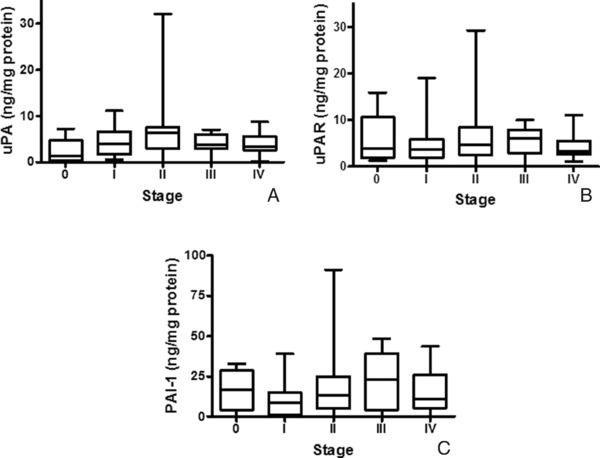
Expression of uPA, uPAR, and PAI‐1 in breast cancer of patients with differing stages of disease. Box and whisker plots illustrate levels of uPA (A), uPAR (B), and PAI‐1 (C) in patients with stage 0, I, II, III, or IV breast carcinoma.
Harbeck and co‐workers 24, 25, 44 reported that uPA and PAI‐1 are particularly useful in classifying high‐risk breast cancer for treatment with adjuvant chemotherapy. However, they did not find these analytes useful to select patients for endocrine therapy, which is consistent with our findings that uPA, uPAR, and PAI‐1 levels in primary breast cancers were unrelated to either ER levels or menopausal status of the patient.
Relationship of uPA, uPAR, and PAI‐1 with patient survival
Cox regressions of uPA, uPAR and PAI‐1 levels were performed independently as a continuous variable for DFS and OS of study patients. None were statistically significant (P values of DFS were: 0.92 for uPA, 0.62 for uPAR, and 0.75 for PAI‐1; P values of OS were 1.00 for uPA, 0.49 for uPAR, and 0.20 for PAI‐1). We then employed Kaplan–Meier plots, which evaluates each analyte categorically, to examine the association of expression levels of either uPA, uPAR, or PAI‐1 with DFS (Fig. 5A, C, and E) and OS (Fig. 5B, D, and F). Although no relationship was observed for uPA or uPAR, the Kaplan–Meier analyses of PAI‐1 appeared to separate patients into groups with either good or poor prognosis, using the median expression value to stratify patients (Fig. 5E and F). However, the relationship only approached statistical significance (DFS, P value = 0.09; OS, P value = 0.07). A previous study 37 reported that patients with high PAI‐1 mRNA expression exhibited a reduced 10‐year DFS and OS. Witzel et al. 37 also reported that PAI‐1 mRNA levels were the strongest prognostic factor for OS by univariate and multivariate analysis in a patient cohort that did not receive chemotherapy.
Figure 5.
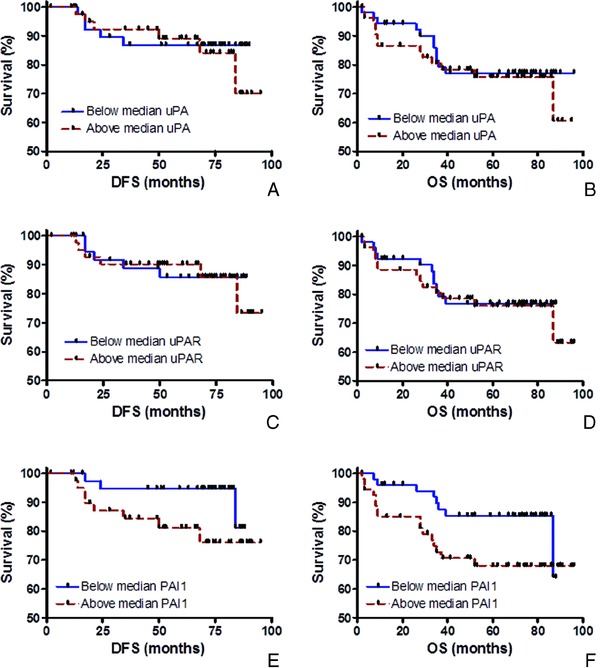
Relationship of uPA, uPAR, and PAI‐1 with patient survival. Kaplan–Meier plots illustrate the associations of protein expression levels with disease‐free survival (DFS) (A, B, and E) and overall survival (OS) (B, D, and F).
Since other studies 24, 25 suggested that the prognostic utility of uPA, uPAR, and PAI‐1 was associated with nodal status of the patient, Kaplan–Meier analyses were repeated in both the node‐negative and node‐positive populations (data not shown). No significant differences in survival were observed when node‐positive patients were stratified either by uPA, uPAR, or PAI‐1 levels. In addition, no significant difference in survival was detected when node‐negative patients were stratified by uPA and PAI‐1 levels. However, statistically significant differences were observed in DFS and OS when node‐negative patients were stratified by uPAR levels (DFS, P value = 0.05; OS, P value = 0.03). Further investigation is warranted due to the small population of only 47 node‐negative patients available for our study.
Hierarchical clustering analyses
In order to investigate the collective association of uPA, uPAR, and PAI‐1 with patient survival, hierarchical clustering was performed using the analyte levels from the breast cancer biopsies of 106 patients with clinical follow‐up. The dendrogram revealed two primary clusters (I and II) of patients based on the collective expression of uPA, uPAR, and PAI‐1. Those clusters were used to stratify the patients used in Kaplan–Meier plots (Fig. 6A and B). Although the differences were not statistically significant for DFS (P = 0.99), patients in clusters I and II appeared to be separated when evaluating OS (P = 0.06, Fig. 6B). Calculation of the P value for OS may be compromised due to the small sample size in cluster II (n = 13) compared to cluster I (n = 93).
Figure 6.
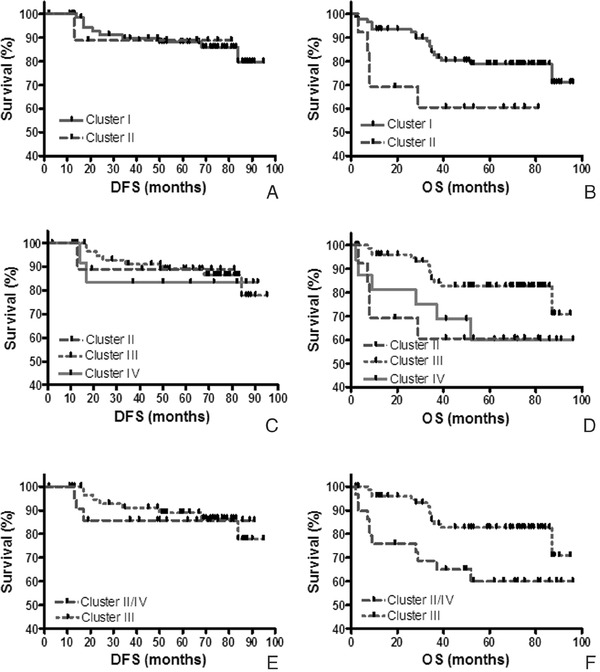
Relationship of hierarchical clustering and patient survival. Kaplan–Meier plots illustrated the association of each cluster with disease‐free survival (DFS) (A, C, and E) and overall survival (OS) (B, D, and F). The patients segregated into clusters I and II from the dendrogram are shown in (A) and (B). Cluster I was subdivided into two secondary clusters (III and IV). The patients segregated into clusters II, III, and IV are shown in (C) and (D). When patients in clusters II and IV were combined and compared to patients in cluster III for DFS and OS, the results are shown in (E) and (F).
Due to the larger patient population present in cluster I (n = 93), the population was analyzed in two secondary clusters (III and IV), in addition to the population in cluster II. When results of each of the three clusters described in the dendrogram were used to stratify the patients (Fig. 6C and D), DFS was not statistically significant in Kaplan–Meier plots (P = 0.97). However, OS was statistically significant (P = 0.05), although cluster IV only contained 16 patients and cluster V contained 13 patients. Therefore, results from patients appearing in clusters IV and V were combined (n = 29), plotted (Fig. 6E and F) and compared to patients from cluster III (n = 77). Although the results for DFS were insignificant (P = 0.85), a statistically significant separation of OS curves was observed (P = 0.02) with a hazard ratio of 0.31 (95% confidence interval of 0.13–0.81). Although Wolff et al. 31 performed unsupervised hierarchical clustering with uPA and PAI‐1 with various signaling molecules and tumor aggressiveness, they did not correlate the resulting clusters with patient's DFS and OS. To our knowledge, use of hierarchical clustering and the resulting dendrogram of biomarker levels from the breast cancer biopsies with clinical outcome appears to be a novel approach.
CONCLUSIONS
Correlations were performed on the levels of uPA, uPAR, and PAI‐1 with various patient and tumor characteristics. Expression of neither uPA, uPAR, nor PAI‐1 in breast cancers appeared to be related to patient age, menopausal status, race or family history of breast cancer when the analytes were evaluated individually. Concentrations of these analytes in a breast cancer biopsy also were independent of ER and PR expression. ANOVA identified an association between tissue pathology and levels of uPA, uPAR, and PAI‐1 (P < 0.05) in a biopsy. uPA, uPAR, and PAI‐1 levels were statistically different in IDCs compared to those with lobular carcinoma, while PAI‐1 levels were also different in patients with IDC compared to those with mucinous carcinoma. No relationship between either tumor grade or stage with uPA, uPAR, or PAI‐1 levels was observed. PAI‐1 levels were increased in node‐positive patients (P < 0.05), but no association was identified between nodal status and either uPA or uPAR content.
Initial survival analyses using Cox regressions did not reveal correlations of uPA, uPAR, and PAI‐1 levels with DFS or OS when the analytes were evaluated individually. However, PAI‐1 expression appeared to be associated with survival when analyzed by Kaplan–Meier plots using the median analyte protein level to stratify the patient population. Since several studies 24, 25 suggested the utility of uPA, uPAR, and PAI‐1 for assessing prognosis and selecting patients for chemotherapy was dependent on nodal status, analyses were repeated in both node‐negative and node‐positive populations. Although no association of uPA, uPAR, and PAI‐1 levels was found with survival in node‐positive patients, there were statistically significant differences in DFS and OS of node‐negative patients when stratified by uPAR levels. Further investigation is warranted due to the small number (47) of patients in the node‐negative cohort. Finally, results from hierarchical clustering of uPA, uPAR, and PAI‐1 expression appeared to reveal the greatest clinical significance for predicting OS, suggesting that the collective examination of these biomarkers is useful in predicting the clinical outcome of breast cancer.
ACKNOWLEDGMENTS
The authors would like to acknowledge the technical assistance of Gerald A. Schmitt.
Grant sponsor: Phi Beta Psi Charity Trust; Grant sponsor: American Diagnostica, Inc.
REFERENCES
- 1. Lester SC. The Breast In: Kumar V, Abbas AK, Fausto N, editors. Robbins and Cotran Pathological Basis of Disease. Philadelphia, PA: Elsevier Inc; 2005. p 1119–1154. [Google Scholar]
- 2. Mignatti P, Rifkin DB. Biology and biochemistry of proteinases in tumor invasion. Physiol Rev 1993;73:161–195. [DOI] [PubMed] [Google Scholar]
- 3. Markus G, Kohga S, Camiolo SM, Madeja JM, Ambrus JL, Karakousis C. Plasminogen activators in human malignant melanoma. J Natl Cancer Inst 1984;72:1213–1222. [PubMed] [Google Scholar]
- 4. Andreasen PA, Kjoller L, Christensen L, Duffy MJ. The urokinase‐type plasminogen activator system in cancer metastasis: A review. Int J Cancer 1997;72:1–22. [DOI] [PubMed] [Google Scholar]
- 5. Duffy MJ, O'Grady P, Devaney D, O'Siorain L, Fennelly JJ, Lijnen HJ. Urokinase‐plasminogen activator, a marker for aggressive breast carcinomas. Preliminary report. Cancer 1988;62:531–533. [DOI] [PubMed] [Google Scholar]
- 6. Duffy MJ, Reilly D, O'Sullivan C, O'Higgins N, Fennelly JJ, Andreasen P. Urokinase‐plasminogen activator, a new and independent prognostic marker in breast cancer. Cancer Res 1990;50:6827–6829. [PubMed] [Google Scholar]
- 7. Foekens JA, Schmitt M, van Putten WL, Peters HA, Bontenbal M, Janicke F, Klijn JG. Prognostic value of urokinase‐type plasminogen activator in 671 primary breast cancer patients. Cancer Res 1992;52:6101–6105. [PubMed] [Google Scholar]
- 8. Foekens JA, Peters HA, Look MP, Portengen H, Schmitt M, Kramer MD, Brunner N, Janicke F, Meijer‐Van Gelder ME, Henzen‐Logmans SC, van Putten WL, Klijn JG. The urokinase system of plasminogen activation and prognosis in 2780 breast cancer patients. Cancer Res 2000;60:636–643. [PubMed] [Google Scholar]
- 9. Janicke F, Schmitt M, Graeff H. Clinical relevance of the urokinase‐type and tissue‐type plasminogen activators and of their type 1 inhibitor in breast cancer. Semin Thromb Hemost 1991;17:303–312. [DOI] [PubMed] [Google Scholar]
- 10. Janicke F, Schmitt M, Pache L, Ulm K, Harbeck N, Hofler H, Graeff H. Urokinase (uPA) and its inhibitor PAI‐1 are strong and independent prognostic factors in node‐negative breast cancer. Breast Cancer Res Treat 1993;24:195–208. [DOI] [PubMed] [Google Scholar]
- 11. Oka T, Ishida T, Nishino T, Sugimachi K. Immunohistochemical evidence of urokinase‐type plasminogen activator in primary and metastatic tumors of pulmonary adenocarcinoma. Cancer Res 1991;51:3522–3525. [PubMed] [Google Scholar]
- 12. Hasui Y, Marutsuka K, Suzumiya J, Kitada S, Osada Y, Sumiyoshi A. The content of urokinase‐type plasminogen activator antigen as a prognostic factor in urinary bladder cancer. Int J Cancer 1992;50:871–873. [DOI] [PubMed] [Google Scholar]
- 13. Nekarda H, Schmitt M, Ulm K, Wenninger A, Vogelsang H, Becker K, Roder JD, Fink U, Siewert JR. Prognostic impact of urokinase‐type plasminogen activator and its inhibitor PAI‐1 in completely resected gastric cancer. Cancer Res 1994;54:2900–2907. [PubMed] [Google Scholar]
- 14. Mulcahy HE, Duffy MJ, Gibbons D, McCarthy P, Parfrey NA, O'Donoghue DP, Sheahan K. Urokinase‐type plasminogen activator and outcome in Dukes’ B colorectal cancer. Lancet 1994;344:583–584. [DOI] [PubMed] [Google Scholar]
- 15. Kobayashi H, Fujishiro S, Terao T. Impact of urokinase‐type plasminogen activator and its inhibitor type 1 on prognosis in cervical cancer of the uterus. Cancer Res 1994;54:6539–6548. [PubMed] [Google Scholar]
- 16. Kuhn W, Pache L, Schmalfeldt B, Dettmar P, Schmitt M, Janicke F, Graeff H. Urokinase (uPA) and PAI‐1 predict survival in advanced ovarian cancer patients (FIGO III) after radical surgery and platinum‐based chemotherapy. Gynecol Oncol 1994;55:401–409. [DOI] [PubMed] [Google Scholar]
- 17. Tecimer C, Doering DL, Goldsmith LJ, Meyer JS, Abdulhay G, Wittliff JL. Clinical relevance of urokinase‐type plasminogen activator, its receptor and inhibitor type 1 in ovarian cancer. Int J Gynecol Cancer 2000;10:372–381. [DOI] [PubMed] [Google Scholar]
- 18. Tecimer C, Doering DL, Goldsmith LJ, Meyer JS, Abdulhay G, Wittliff JL. Clinical relevance of urokinase‐type plasminogen activator, its receptor, and its inhibitor type 1 in endometrial cancer. Gynecol Oncol 2001;80:48–55. [DOI] [PubMed] [Google Scholar]
- 19. Hofmann R, Lehmer A, Buresch M, Hartung R, Ulm K. Clinical relevance of urokinase plasminogen activator, its receptor, and its inhibitor in patients with renal cell carcinoma. Cancer 1996;78:487–492. [DOI] [PubMed] [Google Scholar]
- 20. Bindal AK, Hammoud M, Shi WM, Wu SZ, Sawaya R, Rao JS. Prognostic significance of proteolytic enzymes in human brain tumors. J Neurooncol 1994;22:101–110. [DOI] [PubMed] [Google Scholar]
- 21. Choong PF, Ferno M, Akerman M, Willen H, Langstrom E, Gustafson P, Alvegard T, Rydholm A. Urokinase‐plasminogen‐activator levels and prognosis in 69 soft‐tissue sarcomas. Int J Cancer 1996;69:268–272. [DOI] [PubMed] [Google Scholar]
- 22. Costantini V, Sidoni A, Deveglia R, Cazzato OA, Bellezza G, Ferri I, Bucciarelli E, Nenci GG. Combined overexpression of urokinase, urokinase receptor, and plasminogen activator inhibitor‐1 is associated with breast cancer progression: An immunohistochemical comparison of normal, benign, and malignant breast tissues. Cancer 1996;77:1079–1088. [DOI] [PubMed] [Google Scholar]
- 23. Manders P, Tjan‐Heijnen VC, Span PN, Grebenchtchikov N, Geurts‐Moespot A, van Tienoven DT, Beex LV, Sweep FC. Complex of urokinase‐type plasminogen activator with its type 1 inhibitor predicts poor outcome in 576 patients with lymph node‐negative breast carcinoma. Cancer 2004;101:486–494. [DOI] [PubMed] [Google Scholar]
- 24. Harbeck N, Schmitt M, Kates RE, Kiechle M, Zemzoum I, Janicke F, Thomssen C. Clinical utility of urokinase‐type plasminogen activator and plasminogen activator inhibitor‐1 determination in primary breast cancer tissue for individualized therapy concepts. Clin Breast Cancer 2002;3:196–200. [DOI] [PubMed] [Google Scholar]
- 25. Harbeck N, Kates RE, Schmitt M. Clinical relevance of invasion factors urokinase‐type plasminogen activator and plasminogen activator inhibitor type 1 for individualized therapy decisions in primary breast cancer is greatest when used in combination. J Clin Oncol 2002;20:1000–1007. [DOI] [PubMed] [Google Scholar]
- 26. Wittliff JL, Pasic R, Bland KI. Steroid and peptide hormone receptors: Methods, quality control, and clinical use In: Bland K, Copeland E, editors. The Breast: Comprehensive Management of Benign and Malignant Diseases. Philadelphia: W.B. Saunders Co.; 1998. p 458–498. [Google Scholar]
- 27. McShane LM, Altman DG, Sauerbrei W, Taube SE, Gion M, Clark GM. Reporting recommendations for tumor marker prognostic studies (REMARK). J Natl Cancer Inst 2005;97:1180–1184. [DOI] [PubMed] [Google Scholar]
- 28. Pasic R, Djulbegovic B, Wittliff JL. Comparison of sex steroid receptor determinations in human breast cancer by enzyme immunoassay and radioligand binding. J Clin Lab Anal 1990;4:430–436. [DOI] [PubMed] [Google Scholar]
- 29. Fekete M, Wittliff JL, Schally AV. Characteristics and distribution of receptors for [D‐TRP6]‐luteinizing hormone‐releasing hormone, somatostatin, epidermal growth factor, and sex steroids in 500 biopsy samples of human breast cancer. J Clin Lab Anal 1989;3:137–147. [DOI] [PubMed] [Google Scholar]
- 30. Sanfilippo JS, Miseljic S, Yang AR, Doering DL, Shaheen RM, Wittliff JL. Quantitative analyses of epidermal growth factor receptors, HER‐2/neu oncoprotein and cathepsin D in nonmalignant and malignant uteri. Cancer 1996;77:710–716. [DOI] [PubMed] [Google Scholar]
- 31. Wolff C, Malinowsky K, Berg D, Schragner K, Schuster T, Walch A, Bronger H, Hofler H, Becker KF. Signalling networks associated with urokinase‐type plasminogen activator (uPA) and its inhibitor PAI‐1 in breast cancer tissues: New insights from protein microarray analysis. J Pathol 2011;223:54–63. [DOI] [PubMed] [Google Scholar]
- 32. Stavraky K, Emmons S. Breast cancer in premenopausal and postmenopausal women. J Natl Cancer Inst 1974;53:647–654. [DOI] [PubMed] [Google Scholar]
- 33. Clavel‐Chapelon F, Gerber M. Reproductive factors and breast cancer risk. Do they differ according to age at diagnosis? Breast Cancer Res Treat 2002;72:107–115. [DOI] [PMC free article] [PubMed] [Google Scholar]
- 34. Zheng W, Wen W, Gao YT, Shyr Y, Zheng Y, Long J, Li G, Li C, Gu K, Cai Q, Shu XO, Lu W. Genetic and clinical predictors for breast cancer risk assessment and stratification among Chinese women. J Natl Cancer Inst 2010;102:972–981. [DOI] [PMC free article] [PubMed] [Google Scholar]
- 35. Bird Y, Moraros J, Banegas MP, King S, Prapasiri S, Thompson B. Breast cancer knowledge and early detection among Hispanic women with a family history of breast cancer along the U.S.‐Mexico border. J Health Care Poor Underserved 2010;21:475–488. [DOI] [PMC free article] [PubMed] [Google Scholar]
- 36. Kapp JM, Walker R, Haneuse S, Buist DS, Yankaskas BC. Are there racial/ethnic disparities among women younger than 40 undergoing mammography? Breast Cancer Res Treat 2010;124:213–222. [DOI] [PMC free article] [PubMed] [Google Scholar]
- 37. Witzel ID, Milde‐Langosch K, Wirtz RM, Roth C, Ihnen M, Mahner S, Zu EC, Janicke F, Muller V. Comparison of microarray‐based RNA expression with ELISA‐based protein determination of HER2, uPA and PAI‐1 in tumour tissue of patients with breast cancer and relation to outcome. J Cancer Res Clin Oncol 2010;136:1709–1718. [DOI] [PMC free article] [PubMed] [Google Scholar]
- 38. Levicar N, Kos J, Blejec A, Golouh R, Vrhovec I, Frkovic‐Grazio S, Lah TT. Comparison of potential biological markers cathepsin B, cathepsin L, stefin A and stefin B with urokinase and plasminogen activator inhibitor‐1 and clinicopathological data of breast carcinoma patients. Cancer Detect Prev 2002;26:42–49. [DOI] [PubMed] [Google Scholar]
- 39. Tong D, Czerwenka K, Sedlak J, Schneeberger C, Schiebel I, Concin N, Leodolter S, Zeillinger R. Association of in vitro invasiveness and gene expression of estrogen receptor, progesterone receptor, pS2 and plasminogen activator inhibitor‐1 in human breast cancer cell lines. Breast Cancer Res Treat 1999;56:91–97. [DOI] [PubMed] [Google Scholar]
- 40. Kotzsch M, Bernt K, Friedrich K, Luther E, Albrecht S, Gatzweiler A, Magdolen V, Baretton G, Zietz C, Luther T. Prognostic relevance of tumour cell‐associated uPAR expression in invasive ductal breast carcinoma. Histopathology 2010;57:461–471. [DOI] [PubMed] [Google Scholar]
- 41. Hildenbrand R, Schaaf A, Dorn‐Beineke A, Allgayer H, Sutterlin M, Marx A, Stroebel P. Tumor stroma is the predominant uPA‐, uPAR‐, PAI‐1‐expressing tissue in human breast cancer: Prognostic impact. Histol Histopathol 2009;24:869–877. [DOI] [PubMed] [Google Scholar]
- 42. Hurd TC, Sait S, Kohga S, Winston J, Martinick M, Saxena R, Lankes H, Markus G, Harvey S, Gibbs JF. Plasminogen activator system localization in 60 cases of ductal carcinoma in situ. Ann Surg Oncol 2007;14:3117–3124. [DOI] [PubMed] [Google Scholar]
- 43. Janicke F, Prechtl A, Thomssen C, Harbeck N, Meisner C, Untch M, Sweep CG, Selbmann HK, Graeff H, Schmitt M. Randomized adjuvant chemotherapy trial in high‐risk, lymph node‐negative breast cancer patients identified by urokinase‐type plasminogen activator and plasminogen activator inhibitor type 1. J Natl Cancer Inst 2001;93:913–920. [DOI] [PubMed] [Google Scholar]
- 44. Harbeck N, Kates RE, Look MP, Meijer‐Van Gelder ME, Klijn JG, Kruger A, Kiechle M, Janicke F, Schmitt M, Foekens JA. Enhanced benefit from adjuvant chemotherapy in breast cancer patients classified high‐risk according to urokinase‐type plasminogen activator (uPA) and plasminogen activator inhibitor type 1 (n = 3424). Cancer Res 2002;62:4617–4622. [PubMed] [Google Scholar]