Abstract
Vitamin D plays a vital role not only in bone health but also in pathophysiology of many other body functions. In recent years, there has been significant increase in testing of 25‐hydroxyvitamin D (25‐OH vitamin D), a marker of vitamin D deficiency. The most commonly used methods for the measurement of 25‐OH vitamin D are immunoassays and liquid chromatography tandem mass spectrometry (LC‐MS‐MS). Since immunoassays suffer from inaccuracies and interferences, LC‐MS‐MS is a preferred method. In LC‐MS‐MS methods, 25‐OH vitamin D is extracted from serum or plasma by solid‐phase or liquid‐phase extraction. Because these extraction methods are time consuming, we developed an easy method that uses simple protein precipitation followed by injection of the supernatant to LC‐MS‐MS. Several mass‐to‐charge (m/z) ratio transitions, including commonly used transitions based on water loss, were evaluated and several tube types were tested. The optimal transitions for 25‐OH vitamin D2 and D3 were 395.5 > 269.5 and 383.4 > 257.3, respectively. The reportable range of the method was 1–100 ng/mL, and repeatability (within‐run) and within‐laboratory imprecision were <4% and <6%, respectively. The method agreed well with the solid‐phase extraction methods. J. Clin. Lab. Anal. 26:349‐357, 2012. © 2012 Wiley Periodicals, Inc.
Keywords: vitamin D, 25‐hydroxyvitamin D2, 25‐hydroxyvitamin D3, tandem mass spectrometry
INTRODUCTION
Vitamin D plays a vital role in calcium and phosphorus metabolism, and bone health. In addition to its well‐known function in bone health, vitamin D plays important roles in the physiology and pathophysiology of many other body functions 1, 2, 3, 4. The role of vitamin D has been implicated in diabetes, cardiovascular diseases, cancer, multiple sclerosis, and immune system functions 1. It has been known for years that elderly population and patients with renal and liver disease are at high risk of vitamin D deficiency 1, 5, 6. In recent years, a number of epidemiological studies have shown that vitamin D deficiency is fairly common in the general population 1, 7, 8, 9. The best markers of nutritional deficiency of vitamin D are vitamin D metabolites 25‐hydroxyvitamin D2 and D3 (25‐OH vitamin D2 and D3). Due to an increased awareness of vitamin D deficiency, clinical laboratories have seen significant increase in the testing of 25‐OH vitamin D2 and D3. The common methods for the measurement of vitamin D metabolites are immunoassays and chromatographic methods 10, 11, 12, 13, 14. Due to high sensitivity and specificity, and ability to differentiate between D2 and D3, liquid chromatography tandem mass spectrometry (LC‐MS‐MS) using electrospray or atmospheric pressure chemical ionization (APCI) is a preferred method. Current LC‐MS‐MS methods for the measurement of 25‐OH vitamin D2 and D3 that involve liquid–liquid or solid‐phase extractions are laborious and time consuming 15, 16. We describe an easy LC‐MS‐MS method that uses simple protein precipitation followed by injection of the supernatant to LC‐MS‐MS. This method of analyzing 25‐OH vitamin D2 and D3 without prior extraction was compared with widely accepted solid‐phase extraction methods.
MATERIALS AND METHODS
Chemicals and Reagents
25‐OH vitamin D2 and D3 were purchased from Cerilliant (Round Rock, TX). In addition, certified material containing 25‐OH vitamin D2 and D3 was purchased from National Institute of Standards and Technology (NIST). Internal standard, 25‐OH vitamin D3 (26, 26, 26, 27, 27, 27‐d6), was purchased from Cerilliant. Calibrators were prepared in 7% bovine serum albumin prepared in phosphate buffered saline and ranged from 1 to 100 ng/mL for 25‐OH vitamin D2 and D3. Quality control material was purchased from UTAK Laboratories (Valencia, CA).
Sample Collection and Processing
Before complete method validation, different tube types were evaluated for the method suitability. To compare different tube types, samples from three volunteers were collected in EDTA, heparin with and without gel, clot activator red top with and without gel tubes. Serum or plasma was separated by centrifugation of blood at 3,000g for 10 min. After optimizing mass‐to‐charge (m/z) transitions, it was determined that many tubes were suitable. However, most of the studies were performed on red‐top tubes since these tubes are more versatile and suitable for other chemistry assays.
Sample Preparation
To 200 μL aliquots of patient sample (serum or plasma), controls or calibrators, 200 μL of refrigerated acetonitrile containing 50 ng/mL deuterated internal standard 25‐OH vitamin D3 (26, 26, 26, 27, 27, 27‐d6) were added. The samples were then vortexed and left at room temperature for 10 min. Next, the samples were centrifuged at 10,000g for 10 min. Finally, the supernatants were transferred to autosampler vials and 30 μL was injected on LC‐MS/MS for analysis.
HPLC‐MS‐MS Conditions and Operation
Shimadzu Prominence HPLC (Lenexa, KS) linked to Applied Biosystems 4000 QTrap (Foster City, CA) was used for the analysis. Chromatographic separation involved reverse phase 5 μm, 5 cm × 46 mm, C18 SupelcosilTM analytical column (Bellefonte, PA), and mobile phases, water, and methanol containing 0.1% formic acid. HPLC parameters are given in Table 1. Positive ion APCI and various multiple reactions monitoring (MRM), m/z transitions, were used and optimized for MS‐MS analysis. The optimized m/z transitions were 25‐OH vitamin D2 (395.5 > 269.5 and 395.5 > 377.5), 25‐OH vitamin D3 (383.4 > 257.3 and 383.4 > 365.5), and 25‐OH vitamin D3‐d6 (389.3 > 211.5; Table 2). Optimized MS‐MS parameters are given in Table 3. Commonly used m/z transitions involving water loss, 413.5 > 395.5 for 25‐OH vitamin D2, 401.2 > 383.2 for 25‐OH vitamin D3 and 407.2 > 389.2 for 25‐OH vitamin D3‐d6 were also optimized and evaluated. The data were analyzed using Applied Biosystems Analyst Software (Foster City, CA). The data from Analyst Software were exported to Microsoft Excel for better resolution graphing.
Table 1.
HPLC Parameters
| Time (min) | Events | Parameter (%) |
|---|---|---|
| 0.00 | Pump B | 80 |
| 4.00 | Pump B | 100 |
| 5.00 | Pump B | 100 |
| 6.00 | Pump B | 80 |
| 6.10 | Stop |
Column temperature was 45°C and the flow rate was 1 mL/min. Gradient was made from 100% water containing 0.1% formic acid (A) and 100% methanol containing 0.1% formic acid (B).
Table 2.
Optimized m/z Transitions for 25‐Hydroxyvitamin D2, 25‐Hydroxyvitamin D3 and 25‐Hydroxyvitamin D3 (26, 26, 26, 27, 27, 27‐d6)
| Analyte | Q1 | Q3 | Qualifier ion |
|---|---|---|---|
| 25‐Hydroxyvitamin D2 | 395.5 | 269.5 | 377.5 |
| 25‐Hydroxyvitamin D3 | 383.4 | 257.3 | 365.5 |
| 25‐Hydroxyvitamin D3 | 389.3 | 211.5 | n/a |
| (26, 26, 26, 27, 27, 27‐d6). | |||
Table 3.
MS‐MS Parameters
| Nebulizer, curtain, collision gas | Nitrogen |
|---|---|
| Curtain gas (psi) | 40 |
| Nebulizer current (μA) | 3 |
| Turbo flow pressure, | 55 |
| Gas 1 (psi) | |
| Detector temperature | 450°C |
| Collision gas (GAD) | Medium |
| Declustering potential (V) | D3 = 86.0, D3(d6) = 85.0 |
| D2 = 84.0 | |
| Entrance potential (V) | 10.0 |
| Exit potential (V) | D3 = 9.0, D3(d6) = 11.0, D3 Qual = 12.0 |
| D2 = 10.0, D2 Qual = 10.0 | |
| Collision energy (eV) | D3 = 20.0, D3(d6) = 38.0, D3 Qual = 18.0 |
| D2 = 29.0, D2 Qual = 28.0 |
RESULTS
The method was evaluated for accuracy, linearity (reportable range), limits of quantitation, interferences, repeatability, and within‐laboratory imprecision. The method was also evaluated for ion suppression and compared with widely used solid‐phase extraction methods. Before validation of these parameters, the m/z transitions were optimized. For the assay of 25‐OH vitamin D2 and D3, commonly used m/z transitions are water loss from the molecular ions; m/z 413.5 > 395.5 for 25‐OH vitamin D2, and m/z 401.2 > 383.2 for 25‐OH vitamin D3, respectively. These m/z transitions yielded peaks with poor resolution and significant baseline noise and showed numerous erroneous peaks (Figs. 1 and 2). These artifacts were seen in all the tubes tested (EDTA, heparin green top with and without gel, and clot activator red‐top tubes with and without gel). This led to investigation and optimization of other m/z transitions that did not involve water loss from the molecular ions. Table 2 shows the optimized m/z transitions for 25‐OH vitamin D2, 25‐OH vitamin D3, and 25‐OH vitamin D3‐d6. Figures 1 and 2 show the chromatograms for 25‐OH vitamin D2 and 25‐OH vitamin D3 comparing m/z transitions based on water loss and m/z transitions listed in Table 2. The data for different m/z transitions were collected simultaneously from the same sample injections. The transitions listed in Table 2 yielded better resolution, improved baseline, and no significant erroneous peaks. This was true with all the tube types tested.
Figure 1.
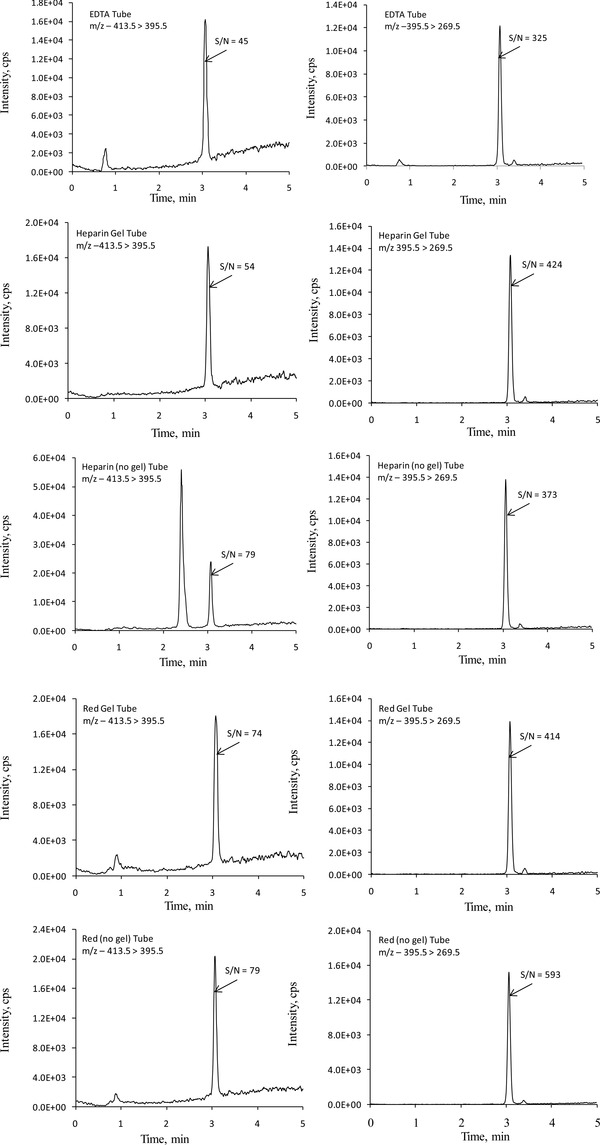
Representative LC‐MS‐MS chromatograms for 25‐hydroxyvitamin D2 comparing m/z transitions 413.5 > 395.5 (left) and 395.5 > 269.5 (right). Samples were prepared by adding 1 mL of serum‐based control to each tube type. Data from all the transitions were collected simultaneously from the same injection. The average concentration of 25‐hydroxyvitamin D2, from different tubes, was 30.2 ng/mL. The variation in measured concentrations among different tube types was <5%. Since different transitions give different sized peaks, for better comparison, the signal‐to‐noise (S/N) ratios of the peaks of interest are provided.
Figure 2.
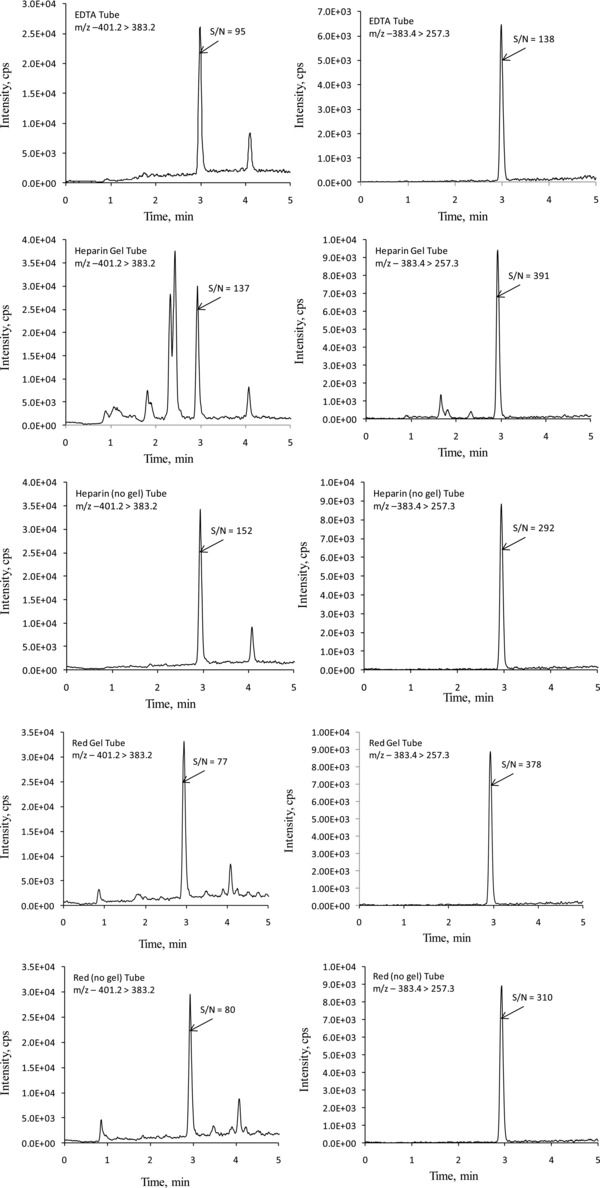
Representative LC‐MS‐MS chromatograms for 25‐hydroxyvitamin D3 comparing m/z transitions 401.2 > 383.2 (left) and 383.4 > 257.3 (right). The samples were collected in different tube types from a volunteer, and prepared as described in Materials and Methods. Data from all the transitions were collected simultaneously from the same injection. The average concentration of 25‐hydroxyvitamin D3, from different tubes, was 41.5 ng/mL. The variation in measured concentrations among different tube types was <5%. Since different transitions give different sized peaks, for better comparison, the signal‐to‐noise (S/N) ratios of the peaks of interest are provided.
Linearity (reportable range) was determined by analyzing seven levels of calibrators. Linearity (reportable range) of the method was established from 1 to 100 ng/mL for 25‐OH vitamin D2 and D3 (Fig. 3). The lower limit of quantitation was 1 ng/mL. This was based on the fact that the signal‐to‐noise (S/N) ratios for 1 ng/mL 25‐OH vitamin D2 and D3 calibrators were 18.1 and 11.2 (>10), respectively. Concentration that gives S/N ratio of >10 is generally acceptable as limit of quantitation. Accuracy/recovery was also calculated from these data. The measured values deviated <10% (<20% for the
Figure 3.
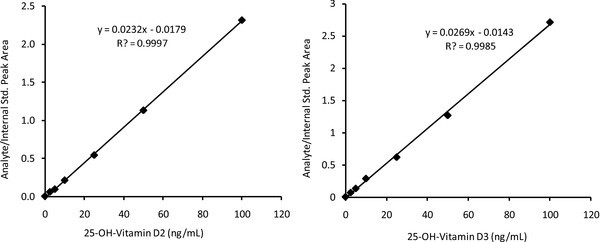
Linearity (reportable range) of 25‐hydroxyvitamin D2 (left) and 25‐hydroxyvitamin D3 (right). The concentrations of calibrators were 1, 2.5, 5, 10, 25, 50, and 100 ng/mL.
lowest calibrator) from the target values. Furthermore, the measured values on NIST‐certified materials were within 10% of the target values.
Repeatability and within‐laboratory precision were evaluated by assaying three levels of controls in duplicate from 40 independent runs. Clinical Laboratory Standards Institute's (CLSI) EP15‐A2 guidelines were used to calculate repeatability and within‐laboratory precision. Coefficients of variations for repeatability and within‐laboratory precisions for vitamin D2 and D3 were less than 5% and 6%, respectively (Table 4).
Table 4.
Repeatability and Within‐Laboratory Imprecision for Three Levels of Quality Controls of 25‐OH Vitamin D2 and D3
| 25‐OH Vitamin D2 | 25‐OH Vitamin D3 | |||||
|---|---|---|---|---|---|---|
| Mean (ng/mL) | 13.8 | 40.8 | 99.9 | 11.0 | 24.8 | 61.5 |
| Repeatability CV | 4.4 | 3.2 | 2.8 | 4.4 | 4.1 | 3.4 |
| Within‐laboratory CV | 5.7 | 4.6 | 3.7 | 5.7 | 5.7 | 5.1 |
Repeatability (formerly called within‐run imprecision) was calculated by taking the average of variances of replicates from different days, and within‐laboratory imprecision was calculated from repeatability and variances of daily means as described in Clinical Laboratory Standards Institute (CLSI) EP15 A2 guidelines 31.
Ion suppression was determined by comparing the peak areas of internal standard in the blank samples with that of areas of internal standard in the controls, calibrators, and patient samples. Blank samples refer to the samples in which deionized water instead of other matrices such as 7% BSA, serum, or plasma was used. Internal standard counts in the controls, calibrators, and patient samples were within 10% of each other. As shown in Figure 4, no significant ion suppression was noted.
Figure 4.
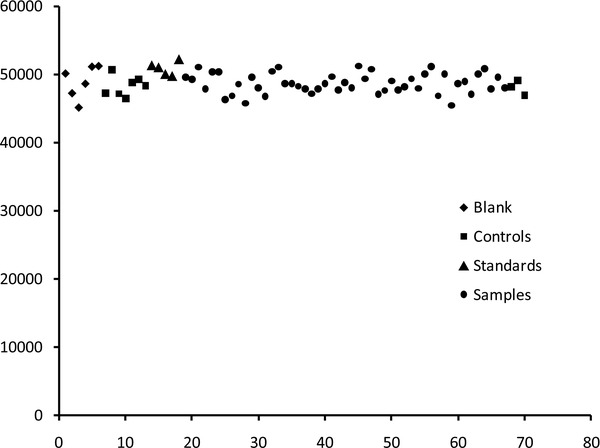
Ion suppression studies based on internal standard counts in the blank, controls, calibrators, and patient samples. No significant ion suppression was observed.
The results of the current method were compared with the well‐established solid‐phase extraction methods as reported by our reference laboratories (Mayo Laboratories or Quest Diagnostics). For comparison, reference samples with sufficient volume were split into two aliquots, one for the reference laboratory and the other for our own laboratory. Samples were stored at −20°C and tested in batches of 10–20 samples. As shown in Figure 5, the current method is in agreement with the solid‐phase extraction methods. Since vitamin D2 comes only from exogenous sources and is not widely prescribed, the number of samples with 25‐OH vitamin D2 was only 21.
Figure 5.
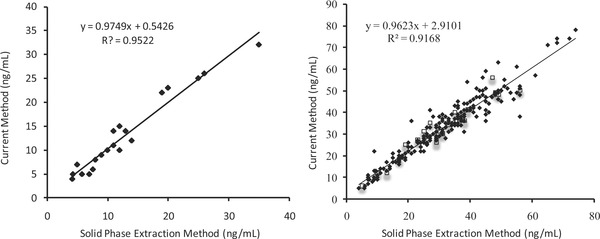
Comparison of 25‐hydroxyvitamin D2 (left) and 25‐hydroxyvitamin D3 (right) concentrations using solid‐phase extraction method and current simple protein precipitation method. Samples represented by closed diamonds were compared with Mayo Laboratories (N = 21 for 25‐hydroxyvitamin D2 and N = 221 for 25‐hydroxyvitamin D3), and the samples represented by open squares were compared with Quest Diagnostics (N = 0 for 25‐hydroxyvitamin D2 and N = 20 for 25‐hydroxyvitamin D3).
DISCUSSION
It has been well established that vitamin D plays important role not only in bone health, but in the physiology and pathophysiology of many other body functions 1, 2, 3, 4. In recent years, it has become evident that vitamin D deficiency is a common health problem 1, 5, 6. Measurement of vitamin D metabolites, 25‐OH vitamin D2 and D3 are considered the best markers for the evaluation of nutritional deficiency of vitamin D 4. This is due to the fact that 25‐OH vitamin D2 and D3 have higher concentrations in the blood and have longer half‐lives of three weeks as compared to the active metabolite 1,25‐dihydroxyvitamin D. Measurement of 1,25‐dihydroxyvitamin D is not considered adequate for checking nutritional status of vitamin D because of its shorter half‐life of only 4 h 15, 17. However, the analysis of 1,25‐dihydroxyvitamin D is useful in those patient who suffer from certain diseases such as lymphoma, sarcoidosis, hypocalcemia, chronic renal disease, hypophosphatemia, hypomagnesemia, vitamin D dependent rickets, hyperparathyroidism, or hypoparathyroidism 15, 17, 18.
Commonly used methods for the measurement of 25‐OH vitamin D2 and D3 include competitive immunoassays such as competitive protein binding assay, enzyme‐linked immunosorbant assay (ELISA), radioimmunoassay, and chemiluminescent immunoassay 13, 14, 15, and chromatographic methods such as gas chromatography mass spectrometry or liquid chromatography with ultraviolet or mass spectrometer detectors 10, 19, 20, 21, 22, 23.
Immunoassays are fast and convenient, but have a number of limitations and disadvantages. Immunoassays suffer from cross‐reactivity with other compounds 13, 14, 24, do not provide separate concentrations of 25‐OH vitamin D2 and D3, and often are less accurate as compared to chromatographic methods. Also, since both 25‐OH vitamin D2 and D3 are metabolized to active forms, the ideal immunoassays should measure these compounds equimolarly. However, this is not the case because certain immunoassays detect 25‐OH vitamin D3 more preferentially than 25‐OH vitamin D2 17. It may be important to measure both 25‐OH vitamin D2 and D3 as it has been shown that 1,25‐dihydroxyvitamin D3 may be more active than 1,25‐dihydroxyvitamin D2 25, 26.
An additional limitation of immunoassays is that a number of these methods suffer from inaccuracies. Recently Farrell et al. 13 studied the performance of five automated immunoassays and a radioimmunoassay with two LC‐MS‐MS methods. Although most immunoassays had good precision, many suffered from inaccuracies. Radioimmunoassay performed better than the automated immunoassays. This was due to the fact that it involves clean‐up using an acetonitrile extraction step. In addition, the use of organic solvents such as acetonitrile eliminates interference from heterophile antibodies. The use of organic solvents as clean‐up step is not possible with automated immunoassays and makes these methods more prone to interferences and inaccuracies. This is evident from the fact that radioimmunoassay and LIASION‐automated immunoassay use the same antibody, but the former assay shows better concordance with LC‐MS‐MS method 13. Furthermore, many automated immunoassays suffer from significant positive bias, particularly at low levels. For example, Roche and LIASION assays showed bias of +35% for 25‐OH vitamin D at levels <8 ng/mL 13. It should be noted that although radioimmunoassay is better than automated immunoassays, it is not preferred because it uses radioactivity and is very time consuming. Furthermore, many immunoassays suffer from inaccuracies that are vitamin D binding protein concentration dependent. A recent study looked at the affect of vitamin D binding protein concentrations on the accuracy of five immunoassays as compared to tandem mass spectrometry 14. Most immunoassays suffered from vitamin D binding protein concentrations dependent inaccuracies. For example, when samples from pregnant women were tested, one method categorized 67% of the patients as vitamin D sufficient, where as another method categorized only 24% as vitamin D sufficient 14.
Given the above limitations of immunoassays, chromatographic methods for the measurement of 25‐OH vitamin D2 and D3 are preferred. Both gas and liquid chromatographic methods that use different detectors are available for the measurement of 25‐OH vitamin D2 and D3. Liquid chromatography methods with ultraviolet or mass spectrometry detectors are preferred over gas chromatography. In recent years, LC‐MS‐MS has become the most widely used chromatographic method for the assay of 25‐OH vitamin D2 and D3, and it is considered a “gold standard” method 21, 24, 27.
In chromatographic methods, a common step involved in the measurement of 25‐OH vitamin D2 and D3 is the release of these compounds from the proteins followed by liquid–liquid or solid‐phase extraction. In liquid–liquid extraction method, internal standard is added to the sample followed by extraction of 25‐OH vitamin D2 and D3 with an organic solvent such as hexane or n‐heptane 16. Organic solvent is then evaporated and reconstituted in an organic solvent for analysis. In a typical solid‐phase extraction method, the sample is diluted with water after addition of internal standard, and then extracted with reverse solid‐phase cartridges 21. Methods involving online solid‐phase extractions are also available 28. Once 25‐OH vitamin D2 and D3 are extracted, they are analyzed by tandem mass spectrometry using electrospray or APCI. Both liquid–liquid and solid‐phase extraction methods are time consuming and produce a lot of organic solvent and other waste. In the present study, we explored the possibility of extracting 25‐OH vitamin D2 and D3 directly into acetonitrile and then analyzing the extract without further liquid–liquid or solid‐phase extraction.
Upon beginning of our study, the commonly used m/z transitions based on water loss from the molecular ions 16, 21, 29 were optimized using positive ion APCI. These m/z transitions yielded poor resolution and erroneous peaks. These problems were seen in all the tube types tested, that is, EDTA, heparin with and without gel, and red top with and without gel tubes. Similar issues of erroneous peaks and interferences with certain brands of polypropylene containers have been reported 30. Also, it is important to note that the interferences and erroneous peaks were different in different tube types. For example, heparin‐gel tubes showed the largest interfering peaks. Therefore, it is important to validate different tube types before using the method for patient testing. In our study, this led to optimization of other m/z transitions that were not based on water loss. These m/z transitions, as shown in the results, yielded better resolution, higher sensitivity, and no erroneous peaks that interfered with the peaks of interest. The method presented here showed high sensitivity, low imprecision, and wide analytical measurement range, and yielded results that were in agreement with the results obtained by solid‐phase extraction methods.
REFERENCES
- 1. Holick MF. Vitamin D deficiency. N Engl J Med 2007;357:266–281. [DOI] [PubMed] [Google Scholar]
- 2. Hewison M. Vitamin D and immune function: An overview. Proc Nutr Soc 2012;71:50–61. [DOI] [PubMed] [Google Scholar]
- 3. Lee JH, O'Keefe JH, Bell D, Hensrud DD, Holick MF. Vitamin D deficiency an important, common, and easily treatable cardiovascular risk factor? J Am Coll Cardiol 2008;52:1949–1956. [DOI] [PubMed] [Google Scholar]
- 4. Rosen CJ. Clinical practice. Vitamin D insufficiency. N Engl J Med 2011;364:248–254. [DOI] [PubMed] [Google Scholar]
- 5. Pramyothin P, Holick MF. Vitamin D supplementation: Guidelines and evidence for subclinical deficiency. Curr Opin Gastroenterol 2012;28:139–150. [DOI] [PubMed] [Google Scholar]
- 6. Scragg R. Vitamin D and public health: An overview of recent research on common diseases and mortality in adulthood. Public Health Nutr 2011;14:1515–1532. [DOI] [PubMed] [Google Scholar]
- 7. Ali FN, Arguelles LM, Langman CB, Price HE. Vitamin D deficiency in children with chronic kidney disease: Uncovering an epidemic. Pediatrics 2009;123:791–796. [DOI] [PubMed] [Google Scholar]
- 8. Beastall G, Rainbow S. Vitamin D reinvented: Implications for clinical chemistry. Clin Chem 2008;54:630–632. [DOI] [PubMed] [Google Scholar]
- 9. Misra M, Pacaud D, Petryk A, Collett‐Solberg PF, Kappy M. Vitamin D deficiency in children and its management: Review of current knowledge and recommendations. Pediatrics 2008;122:398–417. [DOI] [PubMed] [Google Scholar]
- 10. El‐Khoury JM, Reineks EZ, Wang S. Progress of liquid chromatography‐mass spectrometry in measurement of vitamin D metabolites and analogues. Clin Biochem 2011;44:66–76. [DOI] [PubMed] [Google Scholar]
- 11. Heath DD, Flatt SW, Thomson CA, Jacobs ET, Pruitt MA, Rock CL. Evaluation of 25‐hydroxyvitamin D quantification using a commercial HPLC kit method. Br J Biomed Sci 2011;68:86–91. [DOI] [PubMed] [Google Scholar]
- 12. Lensmeyer GL, Wiebe DA, Binkley N, Drezner MK. HPLC method for 25‐hydroxyvitamin D measurement: Comparison with contemporary assays. Clin Chem 2006;52:1120–1126. [DOI] [PubMed] [Google Scholar]
- 13. Farrell CJ, Martin S, McWhinney B, Straub I, Williams P, Herrmann M. State‐of‐the‐art vitamin D assays: A comparison of automated immunoassays with liquid chromatography‐tandem mass spectrometry methods. Clin Chem 2012;58:531–542. [DOI] [PubMed] [Google Scholar]
- 14. Heijboer AC, Blankenstein MA, Kema IP, Buijs MM. Accuracy of 6 routine 25‐hydroxyvitamin D assays: Influence of vitamin D binding protein concentration. Clin Chem 2012;58:543–548. [DOI] [PubMed] [Google Scholar]
- 15. Musteata ML, Musteata FM. Overview of extraction methods for analysis of vitamin D and its metabolites in biological samples. Bioanalysis 2011;3:1987–2002. [DOI] [PubMed] [Google Scholar]
- 16. Saenger AK, Laha TJ, Bremner DE, Sadrzadeh SM. Quantification of serum 25‐hydroxyvitamin D(2) and D(3) using HPLC‐tandem mass spectrometry and examination of reference intervals for diagnosis of vitamin D deficiency. Am J Clin Pathol 2006;125:914–920. [DOI] [PubMed] [Google Scholar]
- 17. Hollis BW. Measuring 25‐hydroxyvitamin D in a clinical environment: Challenges and needs. Am J Clin Nutr 2008;88:507S–510S. [DOI] [PubMed] [Google Scholar]
- 18. Holick MF, Binkley NC, Bischoff‐Ferrari HA, et al. Evaluation, treatment, and prevention of vitamin D deficiency: An Endocrine Society clinical practice guideline. J Clin Endocrinol Metab 2011;96:1911–1930. [DOI] [PubMed] [Google Scholar]
- 19. Eyles D, Anderson C, Ko P, et al. A sensitive LC/MS/MS assay of 25OH vitamin D3 and 25OH vitamin D2 in dried blood spots. Clin Chim Acta 2009;403:145–151. [DOI] [PubMed] [Google Scholar]
- 20. Gentili A, Caretti F. Evaluation of a method based on liquid chromatography‐diode array detector‐tandem mass spectrometry for a rapid and comprehensive characterization of the fat‐soluble vitamin and carotenoid profile of selected plant foods. J Chromatogr A 2011;1218:684–697. [DOI] [PubMed] [Google Scholar]
- 21. Singh RJ. Quantitation of 25‐OH‐vitamin D (25OHD) using liquid tandem mass spectrometry (LC‐MS‐MS). Methods Mol Biol 2010;603:509–517. [DOI] [PubMed] [Google Scholar]
- 22. van den Ouweland JM, Beijers AM, Demacker PN, van Daal H. Measurement of 25‐OH‐vitamin D in human serum using liquid chromatography tandem‐mass spectrometry with comparison to radioimmunoassay and automated immunoassay. J Chromatogr B Analyt Technol Biomed Life Sci 2010;878:1163–1168. [DOI] [PubMed] [Google Scholar]
- 23. Becker N, McClellan AC, Gronowski AM, Scott MG. Inaccurate 25‐hydroxyvitamin D results from a common immunoassay. Clin Chem 2012;58:948–950. [DOI] [PubMed] [Google Scholar]
- 24. Singh RJ. Are clinical laboratories prepared for accurate testing of 25‐hydroxy vitamin D? Clin Chem 2008;54:221–223. [DOI] [PubMed] [Google Scholar]
- 25. Leventis P, Kiely PD. The tolerability and biochemical effects of high‐dose bolus vitamin D2 and D3 supplementation in patients with vitamin D insufficiency. Scand J Rheumatol 2009;38:149–153. [DOI] [PubMed] [Google Scholar]
- 26. Trang HM, Cole DE, Rubin LA, Pierratos A, Siu S, Vieth R. Evidence that vitamin D3 increases serum 25‐hydroxyvitamin D more efficiently than does vitamin D2. Am J Clin Nutr 1998;68:854–858. [DOI] [PubMed] [Google Scholar]
- 27. Kleerekoper M, Schleicher RL, Eisman J, Bouillon R, Singh RJ, Holick MF. Clinical applications for vitamin D assays: What is known and what is wished for. Clin Chem 2011;57:1227–1232. [DOI] [PubMed] [Google Scholar]
- 28. Singh RJ, Taylor RL, Reddy GS, Grebe SK. C‐3 epimers can account for a significant proportion of total circulating 25‐hydroxyvitamin D in infants, complicating accurate measurement and interpretation of vitamin D status. J Clin Endocrinol Metab 2006;91:3055–3061. [DOI] [PubMed] [Google Scholar]
- 29. Maunsell Z, Wright DJ, Rainbow SJ. Routine isotope‐dilution liquid chromatography‐tandem mass spectrometry assay for simultaneous measurement of the 25‐hydroxy metabolites of vitamins D2 and D3. Clin Chem 2005;51:1683–1690. [DOI] [PubMed] [Google Scholar]
- 30. Schleicher RL, Pfeiffer CM. Vitamin D testing: How will we get it right? Clinical Laboratory News 2009;35:10–12. [Google Scholar]
- 31. Clinical and Laboratory Standards Institute . User Verification of Performance for Precision and Trueness, CLSI document EP15‐A2, Wayne, PA; 2005. [Google Scholar]


