

Abstract
Background
Conventional automated hematology analyzers have limitations in platelet measurements such as poor accuracy and precision in the low count range and interference by nonplatelet particles. In order to improve it, the newly developed XN‐Series automated hematology analyzers (Sysmex Corporation, Kobe, Japan) have been installed with a new dedicated channel for platelet analysis (PLT‐F), which is based on a fluorescence flow cytometry method with uses of a novel fluorescent dye specifically staining platelets. We evaluated the basic performance of this new PLT‐F channel.
Methods
Basic performance of the PLT‐F channel in within‐run reproducibility and assay linearity was studied using standard methods. Correlation was studied between PLT‐F and a conventional automated hematology analyzer (XE‐2100) and immunoplatelet analysis using anti‐CD61 monoclonal antibody (Cell‐Dyn Sapphire; Abbott Laboratories). The assay interference by nonplatelet particles such as fragmented red and white blood cells was evaluated by using clinical samples, respectively, from burn injury and acute leukemia.
Results
Basic performance of the PLT‐F platelet counting was satisfactory in within‐run reproducibility, linearity and correlation with the conventional analyzer. The correlation was satisfactory also with the immunoplatelet analysis, even for samples from a patient with burn injury, and those with white blood cell fragments displayed, platelet abnormal flag and low platelet counts (<50 × 109/l).
Conclusion
The platelet counting performance of the PLT‐F channel of the XN Series had improved accuracy and precision in the low range and in abnormal samples, avoiding the interference by nonplatelet particles.
Keywords: automated hematology analyzer, PLT‐F channel, platelet counting, thrombocytopenia, nonplatelet particle
INTRODUCTION
Accurate platelet counting in the low count range is of prime importance for deciding if a platelet transfusion is needed and for monitoring the course of platelet counts after cancer chemotherapy 1, 2. There are a number of factors that influence accuracy in platelet counting in the low range by conventional automated hematology analyzers. Among such factors, nonplatelet particles with platelet‐sized fragmented red and white blood cells cause falsely high analysis results. In such a case, the platelet count is verified by the manual method or immunoplatelet analysis using anti‐CD61 monoclonal antibody 3, 4. However, the manual method has problems in skill requirement, assay variation because of skill difference among personnel and a labor‐intensive procedure. The immunoplatelet analysis is difficult to use routinely in many medical facilities because of practical reasons such as the requirement of a dedicated analyzer, expensive reagents, and large sample volume of 1 ml or more. To solve these issues, the newly developed XN‐Series automated hematology analyzers are equipped with a PLT‐F channel, which uses a flow cytometry‐based platelet counting method wherein platelets are specifically stained with a novel fluorescent dye, in addition to the PLT‐I channel based on an electrical impedance method and the PLT‐O channel based on an optical method, which have been provided in the conventional X‐Class (XE and XT‐Series) analyzers (Sysmex Corporation, Kobe, Japan; 5). We evaluated the basic performance of the PLT‐F channel in platelet counting and the usefulness of this channel in analysis of samples containing interfering nonplatelet particles.
MATERIALS AND METHODS
Samples
Clinical samples used in the study were submitted to the clinical laboratory of Tokai University Hospital for a complete blood count test and sampled during a 6‐month period from September 2010 to March 2011. Peripheral blood was taken with addition of EDTA‐2K as an anticoagulant. Samples from a concentrated platelet bag for transfusion were used for the linearity study in a high range of platelet count. The study was approved by Institutional Review Board for clinical research of Tokai University Hospital (12R116).
Instruments
The newly developed automated hematology analyzer XN‐2000 (XN) was used as an instrument 5. XN counts and classifies blood cells by the DC (direct current) detection method and flow cytometry using a semiconductor laser. In platelet counting by the PLT‐F channel, platelets are stained with a fluorescent oxazine dye that is specifically bound with nucleic acid‐rich platelet organelles such as ribosomes and mitochondria. They are irradiated with a semiconductor laser beam, and then the forward scattered light and side fluorescence intensities of each platelet are plotted on a 2D scattergram to differentiate and count the platelets (Fig. 1). This technique enables specific differentiation of platelets from other blood cells and interfering particles such as red blood cell fragments. Moreover, the analyzed sample volume of the PLT‐F channel is about five times larger than those of conventional methods, in order to obtain highly precise data even with low platelet count samples. XN also measures PLT‐I and PLT‐O by the electric impedance and optical methods, respectively. We used an automated hematology analyzer XE‐2100 (XN) for comparison with XN. Cell‐Dyn Sapphire (CD61 method, Abbott Diagnotics, Lake Forest, IL), an immunological platelet analysis system with use of FITC‐labeled mouse monoclonal antibody against the platelet membrane glycoprotein GPIIIa (CD61), a recommended international reference method, was used as the reference 3.
Figure 1.
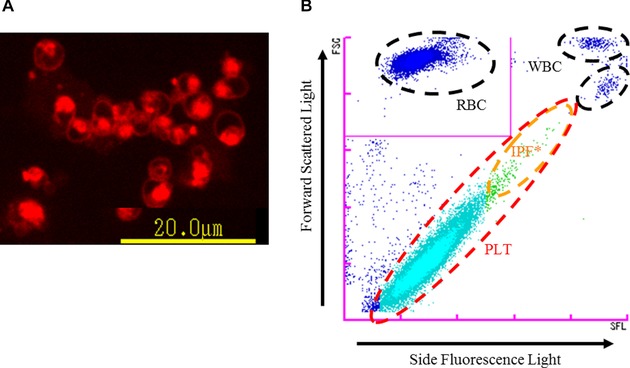
Principle of PLT‐F channel. (A) Platelets stained with the dedicated reagent of PLT‐F (fluorescent microscopy image). The staining pattern of platelets by the fluorescent dye is localized, reflecting its specific binding to nucleic acid‐rich organelles. (B) PLT‐F scattergram. After platelets are stained with fluorescence dye (A), they are differentiated using information from the forward scattered light and side fluorescence intensity (B).* IPF, immature platelet fraction.
Within‐Run Reproducibility
Within‐run reproducibility was evaluated using samples with three concentrations (low, normal, and high), and coefficient of variation (CV%) continuously measured ten times was determined. The CV continuously measured five times was calculated using samples with a low platelet count (≤50 × 109/l) and positive for “PLT abnormal distribution” flag (n = 3).
Assay Linearity
Assay linearity of a high range was evaluated, using a nine‐point dilution series of a sample made from a concentrated platelet bag for transfusion with CELLPACK DCL, the diluent specific for XN. For evaluating linearity in a low range, a healthy patient sample was diluted with CELLPACK DCL to prepare an 11‐pont dilution series. Samples of each dilution level were measured three times and the mean value was used for evaluation.
Storage Stability
Samples (n = 3) from healthy patients were stored at either 4°C or room temperature, and the storage stability of PLT‐F was examined from collection to after 48 h. Samples (n = 3) with a low platelet count (≤100 × 109/l) were stored at room temperature, and their storage stability from collection to after 7 h was studied.
Correlation With XE‐2100
The correlation of platelet counts was studied for PLT‐I (XE) versus PLT‐I (XN), PLT‐O (XN), and PLT‐F (XN), and also was studied for PLT‐O (XE) versus PLT‐I (XN), PLT‐O (XN), and PLT‐F (XN) using samples (n = 764 and n = 35, respectively) that did not trigger the “PLT abnormal distribution” flag in the XE analysis. To ascertain causes of the discrepancy in platelet counts between different methods, the distribution patterns of XN PLT‐F and RET scattergrams, which measured reticulocytes and PLT‐O, were examined.
Correlation With Immunoplatelet
Correlation of platelet counts was studied for CD61 versus PLT‐I (XE, n = 21) and CD61 versus PLT‐I (XN), PLT‐O (XN), and PLT‐F (XN, n = 21) using samples of a platelet count ≤50 × 109/l (XE) that did not trigger the “PLT abnormal distribution” flag in XE. Correlation of platelet counts was also studied for CD61 versus PLT‐I (XE, n = 42) and CD61 versus PLT‐I (XN), PLT‐O (XN), and PLT‐F (XN, n = 45) using samples that triggered the “PLT abnormal distribution” flag in XE. The correlation was also studied using selected samples of a platelet count ≤50 × 109/l among the above (XN, n = 13; XE, n = 12).
Performance Evaluation of PLT‐F Channel in the Analysis of Abnormal Samples
The assay performance of PLT‐F channel in the analysis of abnormal samples containing white and red cell fragments was evaluated. Platelet counts measured by CD61 of samples from two patients with acute leukemia at initial diagnosis, which had a large number of small (platelet‐sized) to large white blood cell fragments, were compared with PLT‐I (XN), PLT‐O (XN), and PLT‐F (XN) counts. The within‐run reproducibility of samples (n = 8) collected from a patient with burn injury, which had small red blood cell fragments, was examined by PLT‐F and the measurement was continuously repeated five times in each sample. The correlation of platelet counts was studied for CD61 versus PLT‐I (XE) and CD61 versus PLT‐I (XN), PLT‐O (XN), and PLT‐F (XN) using samples (n = 32) from a patient with burn injury. Samples from a burn injury patient were analyzed for the platelet count at different time points during the clinical course by CD61 versus PLT‐I (XE), PLT‐I (XN), PLT‐O (XN), and PLT‐F (XN) to examine the influence of fragmented red blood cell on the platelet count by each method.
RESULTS
Within‐Run Reproducibility
The CV of samples of the three different concentrations studied (41.3, 245.0, and 886.3 × 10⁹/l by PLT‐F) was in the range 1.0–4.6% for PLT‐I, 1.6–6.3% for PLT‐O, and 0.7–1.6% for PLT‐F, the CVs remaining small throughout the low to high ranges of concentration. The comparison of the three methods showed that the within‐run reproducibility was best (the CV was smallest) with PLT‐F. The CV of the three samples with low platelet counts that had triggered the “PLT abnormal distribution” flag in the XE was in the range 10.9–27.9% for PLT‐I, 3.3–11.4% for PLT‐O, and 1.9–8.3% for PLT‐F. Thus, the PLT‐F had the best within‐run reproducibility.
Assay Linearity
The dilution linearity was shown in high platelet concentrations ranged up to 3,800 × 109/l for PLT‐I (y = 0.9888x + 19.946), 3,510 × 109/l for PLT‐O (y = 0.993x + 28.725), and 4,132 × 109/l for PLT‐F (y = 0.9882x +2.2539). The dilution linearity was also shown in the low platelet concentration range of 4–45 × 109/l for PLT‐I (y = 0.9882x + 0.849), 4–46 × 109/l for PLT‐O (y = 1.0118x + 0.7396), and 5–46 × 109/l for PLT‐F (y = 0.9812x − 0.3103). Thus, the PLT‐F method showed good linearity, the line passing closer to the origin, as compared to PLT‐I and PLT‐O in the low and high count ranges.
Storage Stability
Platelet counting of the three samples taken from healthy patients remained stable up to 48 h at both 4°C and at room temperature. Even samples with low platelet counts were stable for 7 h after collection (data not shown).
Correlation With XE‐2100
The correlation of the platelet counts of samples that did not trigger the “PLT abnormal distribution” flag was good, the correlation coefficients (rs) being respectively 0.979, 0.966, and 0.968 for PLT‐I (XE) versus PLT‐I (XN), PLT‐O (XN), and PLT‐F (XN), and 0.991, 0.988, and 0.989 for PLT‐O (XE) versus PLT‐I (XN), PLT‐O (XN), and PLT‐F (XN).
Correlation With Immunoplatelet
The correlation coefficients (rs) of platelet counts measured by CD61 versus the three methods in XN using samples (n = 21) that had a platelet count below 50 × 109/l and did not show “PLT abnormal distribution” flag in XE were, respectively, 0.813, 0.967, and 0.994 for PLT‐I (XN), PLT‐O (XN), and PLT‐F (XN). Thus, the correlation was highest with PLT‐F (Fig. 2A). Correlation with CD61 revealed r values of 0.995, 0.997, and 0.997 for PLT‐I (XN), PLT‐O (XN), and PLT‐F (XN), respectively, with samples that triggered the “PLT abnormal distribution” flag in XE (Fig. 2B). There was not much difference among the correlation coefficients for platelet counts by CD61 versus the three methods in XN. However, for samples with a platelet count below 50 × 109/l, the corresponding r values were 0.725, 0.822, and 0.986, respectively, for PLT‐I (XN), PLT‐O (XN), and PLT‐F (XN, Fig. 2C). With PLT‐I, two samples gave results that differed from the CD61 counts by more than 20 × 109/l (Fig. 2C, white dots). The XN RET scattergram, which counted the reticulocyte, showed dots in the fragmented red blood cell and microcytic red blood cell areas, and the “fragments” flag was displayed. The PLT‐F scattergram did not show any interfering particles in the platelet area.
Figure 2.
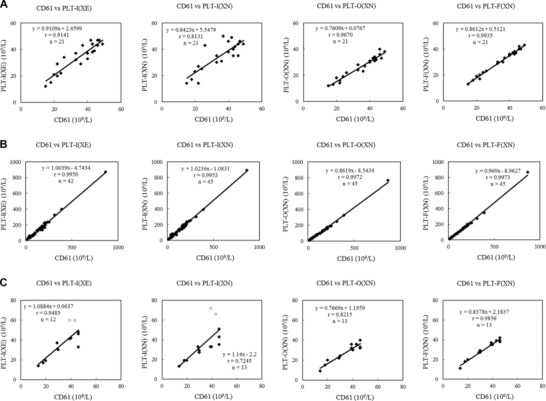
Correlation of platelet counts between CD61 and XN. (A) Samples that did not display the “PLT abnormal distribution” flag and had a platelet count below 50 × 109/l. (B) Samples that displayed the “PLT abnormal distribution” flag. (C) Samples with a platelet count below 50 × 109/l among samples that displayed the “PLT abnormal distribution” flag. White dots show results with PLT‐I that differed from the CD61 counts by more than 20 × 109/l.
Performance Evaluation of PLT‐F Channel in the Analysis of Abnormal Samples
The platelet count of a sample from a patient with acute leukemia (Case 1) was 11 × 109, 26 × 109, 20 × 109, and 15 × 109/l by CD61, PLT‐I, PLT‐O, and PLT‐F, respectively. The peripheral blood had small fragments of the white blood cell but only a flag warning of low platelet count was displayed in XN analysis. The platelet dots were dispersed in the RET scattergram of XN, and contamination of white blood cell fragments could not be ruled out. The fragments of white blood cell were plotted in the WBC area of the PLT‐F scattergram, with no intrusion into the immature platelet fraction (IPF) area. The platelet count by PLT‐F matched with that by CD61 (Fig. 3). The platelet count of a sample from another patient with acute leukemia (Case 2) was 15 × 109, 25 × 109, 19 × 109, and 7 × 10⁹/l, by CD61, PLT‐I, PLT‐O, and PLT‐F, respectively. The peripheral blood showed white blood cell fragments that were larger or smaller than red blood cells. Flags warning of low platelet counts, platelet aggregation, and abnormal RET scattergram were displayed in XN. The white blood cell fragments were seen as an abnormal cluster above the IPF area of high fluorescence intensity in the PLT‐F scattergram, and this cluster was recognized as white blood cells. The platelet count by PLT‐F was slightly lower than the CD61 count, and influence of white blood cell fragments could not be found (Fig. 3). On the other hand, in the PLT histogram curve showed some fluctuations in the region representing cells with volume larger than 15 fL (Fig. 3, dashed line in the PLT‐I histogram).
Figure 3.
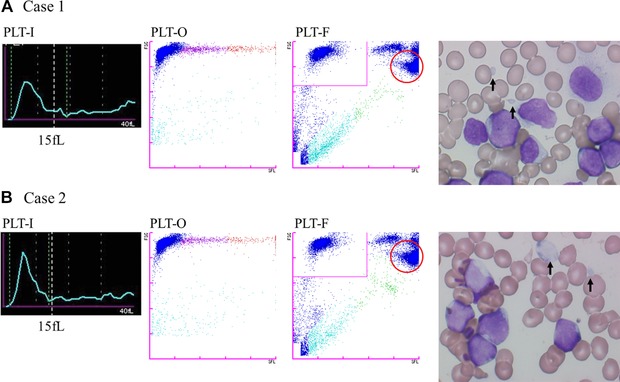
Histograms (PLT‐I) and scattergrams (PLT‐O and PLT‐F) of samples appeared white blood cell fragments. Dashed line in the PLT‐I histogram shows platelet volume 15 fL. In PLT‐F scattergram, the boundary line between the PLT and WBC areas is in the zone between them with few dots of particles. The part circled with the red line is believed to be where white blood cell fragments are plotted.
In the performance evaluation of the PLT‐F method, using samples from a burn injury patient, the within‐run reproducibility of the PLT‐F counts was good (CV 1.2–4.4%), the CV being small even in samples with a low platelet count (Table 1). The correlation of the PLT counts measured by CD61 and other methods was the highest with PLT‐F (XN, r = 0.979), and the slope of the regression equation was also close to 1 (Fig. 4A). As for the monitoring of changes in the platelet count with samples from the burn injury patient, both the PLT‐I and PLT‐O methods gave results considerably different from those of CD61 soon after the injury because of the influence of fragmented red blood cells and microcytes. However, these differences decreased gradually with time and no influence of the contamination of red blood cell fragments was seen after day 4. On the other hand, the platelet counts by PLT‐F corresponded with those by CD61 throughout the study period (Fig. 4B).
Table 1.
Within‐Run Reproducibility of Platelet Counts by PLT‐F Method in Analysis of Samples From a Burn Injury Patient
| Platelet counts by PLT‐F method (× 109/l) | ||||||
|---|---|---|---|---|---|---|
| Sample no. | Max | Min | Range | Mean | SD | CV% |
| 1 | 21 | 20 | 1 | 20.2 | 0.4 | 2.0 |
| 2 | 33 | 30 | 3 | 32.0 | 1.4 | 4.4 |
| 3 | 43 | 42 | 1 | 42.4 | 0.5 | 1.2 |
| 4 | 75 | 72 | 3 | 73.2 | 1.3 | 1.8 |
| 5 | 83 | 80 | 3 | 81.4 | 1.1 | 1.4 |
| 6 | 156 | 151 | 5 | 153.2 | 1.9 | 1.2 |
| 7 | 167 | 162 | 5 | 164.2 | 1.9 | 1.2 |
| 8 | 173 | 168 | 5 | 171.2 | 2.2 | 1.3 |
n = 5.
Figure 4.
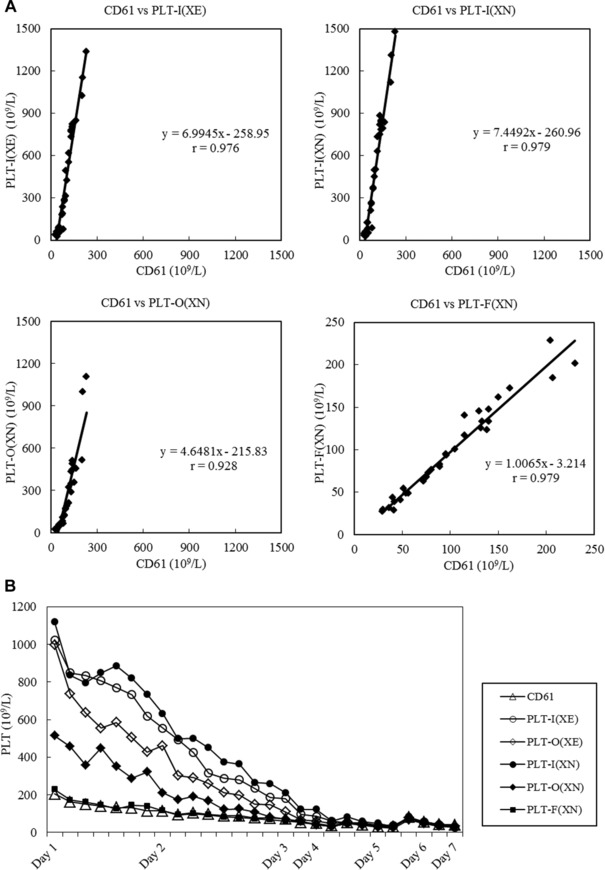
Correlation with CD61 platelet counts and monitoring of platelet counts in samples from burn injury patients. (A) Correlation of platelet counts between CD61 and XN using samples from burn injury patients. (B) Monitoring of platelet counts in burn injury samples.
DISCUSSION
We evaluated the basic analytical performance of the newly dedicated platelet counting channel, the PLT‐F, of the automated hematology analyzer XN‐2000. As for the within‐run reproducibility, the CV of PLT‐F counts was small compared to PLT‐I and PLT‐O and the difference was more clear in the low platelet count samples. Dilution linearity was confirmed over a wide range, from low to high platelet counts, in PLT‐F as in other analysis methods.
CD61 immunological platelet analysis method is a highly platelet specific method that uses a monoclonal antibody against the platelet membrane protein GPIIIa (CD61), and is a recommended international standard method 6, 7. CD61 has been reported to give results that are highly correlated with those of the manual method (Brecher–Cronkite method) even in samples with a low platelet count (≤50 × 109/l). Among the various methods tested here, PLT‐F gave higher correlation with CD61 compared to PLT‐I and PLT‐O for samples with a platelet count ≤50 × 109/l. Moreover, the PLT‐F method showed good linearity, the line passing close to the origin. This seems to be because of better accuracy of the PLT‐F method compared to PLT‐I and PLT‐O in the low count range. Samples that showed a discrepancy ≥20 × 109/l between CD61 and PLT‐I counts with XN analyzers displayed the “fragments” flag, which indicated the presence of fragmented red blood cells or microcytes, and these appear to have interfered with the platelet counting in the PLT‐I channel.
Nonplatelet particles that can cause falsely high platelet counts include white and red cell fragments. White blood cell fragments are often seen in cases where there is an extreme increase in white blood cells, such as in leukemia. Quite often these fragments are of about the same size as platelets, resulting in falsely high platelet counts by PLT‐I and PLT‐O 4, 8. Among the PLT‐I, PLT‐O, and PLT‐F platelet counting of samples with white blood cell fragments studied here, the counts by PLT‐I were the highest in comparison to CD61. In the platelet histogram, the curve formed a shoulder followed by an irregularly wavy pattern in the region of cells larger than 15 fL. This suggested the possibility of white blood cell fragments being counted as platelets. The PLT‐O method gave slightly higher platelet counts than CD61. The platelet count of Case 1 determined by PLT‐F matched with that by CD61. The PLT‐F platelet count of Case 2 was slightly lower than by CD61. In the scattergram, the boundary between the platelets and white blood cell fragments passed through an area where only a few dots were plotted. Thus, there was no abnormality in the manner of defining the borderline, and the cause of the low platelet count of Case 2 could not be identified. Nevertheless, the two cases studied here did not give falsely high counts in the PLT‐F analysis. This result suggested that platelet analysis by PLT‐F could possibly avoid the influence of white blood cell fragments. These results point to the need for further investigations with a larger number of cases to determine “optimal algorithms and differentiation criteria” for discriminating white blood cell fragments from platelets.
The PLT‐I and PLT‐O counts of samples from patients with burn injury are often falsely high because of the small fragmented red blood cells are inadvertently registered as platelets. In contrast, the immunological method of platelet counting is useful for samples of burn injury cases as it is not affected by nonplatelet particles like small fragmented red blood cells, and gives accurate platelet counts. In the present study, the counts by PLT‐I and PLT‐O appeared to be falsely high, as they were much higher than those of CD61. In monitoring of the burn injury case, the platelet counts of the CD61 and PLT‐F methods were quite similar whereas the PLT‐I and PLT‐O counts remained higher than them up to day 4. These results confirmed that in the analysis of burn injury samples, the PLT‐F method was not influenced by small fragmented red blood cells, a cause of falsely high values, and gave results similar to those of CD61. Furthermore, PLT‐F counting of samples from burn injury patients had good within‐run reproducibility, the CV being small.
We believe the improved accuracy and precision of platelet counting with the PLT‐F over the PLT‐O analysis of samples containing interfering nonplatelet particles is due to the difference of specificity to platelets between fluorescent dyes, oxazine, and polymethine, respectively. The nonspecific binding of the latter to the cellular membrane has been a cause of falsely counting of the small fragmented red blood cells as the platelets, which has been minimized in the former.
With the XE analyzer, when “PLT abnormal distribution” flag appears in the PLT‐I analysis, a message prompting analysis by PLT‐O is displayed. With such samples, the PLT‐O analysis is additionally carried out through the RET channel. However, there is often considerable discrepancy between the PLT‐I and PLT‐O counts. The reporting of platelet counts relies on automatic assessment by the analyzer's switching function, which selects one of the two methods 9, 10. In our laboratory, when the cause of such a difference cannot be ascertained by observation of the blood smears, the platelet counting is performed by a manual method (indirect method) for confirmation. When the difference is considerably large, the CD61 immunological analysis is also carried out and the results are reported. In such types of samples, the additional handy procedure of PLT‐F analysis would allow us to report accurate platelet counts.
The operation of the analyzer for PLT‐F analysis is simple, rapid, and inexpensive, and the required sample volume is small (88 μl). PLT‐F analysis obviates a need for the dedicated equipment and expensive reagents required for an immunological method. It can be employed for routine testing to provide rapid analysis and reporting on a 24‐h basis. Therefore, the analyzer would contribute to more appropriate clinical decision making such as in blood transfusion, as it provides highly accurate and rapid platelet counting, and would be useful for efficient operation of hematological or clinical laboratories. This is supportive of a previous report on the performance evaluation of the XN series, which has suggested that the analyzer improves confidence of results and workflow efficiency in a routine hematology laboratory 5.
In conclusion, the performance evaluation of the platelet counting of PLT‐F, a new function of the automated hematology analyzers XN‐Series, confirmed that it could provide better precision and accuracy of analysis for low platelet counts and even with abnormal samples, avoiding the interference by nonplatelet particles such as that in burn injury and leukemia.
ACKNOWLEDGMENTS
We thank Kazutoyo Sakairi, Mitsuko Ota, Nagisa Nakazawa, and Takayuki Seto working in Clinical Laboratory of Tokai University Hospital, for their contribution in performing the research by technical support in the measurement of clinical samples.
REFERENCES
- 1. Segal HC, Briggs C, Kunka S, et al. Accuracy of platelet counting haematology analysers in severe thrombocytopenia and potential impact on platelet transfusion. Br J Haematol 2005;128:520–525. [DOI] [PubMed] [Google Scholar]
- 2. Saliba RM, Komanduri KV, Giralt S, et al. Leukemia burden delays lymphocyte and platelet recovery after allo‐SCT for AML. Bone Marrow Transplant 2009;43:685–692. [DOI] [PMC free article] [PubMed] [Google Scholar]
- 3. Trabuio E, Valverde S, Antico F, Manoni F, Gessoni G. Performance of automated platelet quantification using different analysers in comparison with an immunological reference method in thrombocytopenic patients. Blood Transfus 2009;7:43–48. [DOI] [PMC free article] [PubMed] [Google Scholar]
- 4. Gill JE, Davis KA, Cowart WJ, Nepacena FU, Kim YR. A rapid and accurate closed‐tube immunoassay for platelets on an automated hematology analyzer. Am J Clin Pathol 2000;114:47–56. [DOI] [PubMed] [Google Scholar]
- 5. Briggs C, Longair I, Kumar P, Singh D, Machin SJ. Performance evaluation of the Sysmex haematology XN modular system. J Clin Pathol 2012;65:1024–1030. [DOI] [PubMed] [Google Scholar]
- 6. Harrison P, Ault KA, Chapman S, et al. An interlaboratory study of a candidate reference method for platelet counting. Am J Clin Pathol 2001;115:448–459. [DOI] [PubMed] [Google Scholar]
- 7. Grimaldi E, del Vecchio L, Scopacasa F, et al. Evaluation of the platelet counting by Abbott CELL‐DYN SAPPHIRE haematology analyser compared with flow cytometry. Int J Lab Hematol 2009;31:151–160. [DOI] [PubMed] [Google Scholar]
- 8. Li S, Salhany KE. Spurious elevation of automated platelet counts in secondary acute monocytic leukemia associated with tumor lysis syndrome. Arch Pathol Lab Med 1999;123:1111–1114. [DOI] [PubMed] [Google Scholar]
- 9. Briggs C, Kunka S, Machin SJ. The most accurate platelet count on the Sysmex XE‐2100. Optical or impedance? Clin Lab Haematol 2004;26:157–158. [DOI] [PubMed] [Google Scholar]
- 10. Briggs C, Harrison P, Grant D, Staves J, MacHin SJ. New quantitative parameters on a recently introduced automated blood cell counter—The XE 2100. Clin Lab Haematol 2000;22:345–350. [DOI] [PubMed] [Google Scholar]