

Abstract
Background
Both immunoassays and chromatographic methods are available for therapeutic drug monitoring of mycophenolic acid (MPA), an immunosuppressant. We studied the suitability of cloned enzyme donor immunoassay (CEDIA) assay for routine monitoring of MPA by comparing values obtained by the CEDIA assay with corresponding values obtained by using a high‐performance liquid chromatography combined with ultraviolet detection (HPLC‐UV) method. J. Clin. Lab. Anal. 27:77–80, 2013. © 2012 Wiley Periodicals, Inc.
Methods
We compared MPA concentrations obtained by a reference HPLC‐UV method and CEDIA assay on Hitachi 917 analyzer (Roche Diagnostics, Indianapolis, IN) using 60 patient specimens (18 liver transplant recipient and 42 kidney transplant recipients).
Results
When MPA concentrations in all 60 transplant recipients obtained by the HPLC‐UV (x‐axis) method were compared with corresponding values obtained by the CEDIA method (y‐axis), the following regression equation was obtained: y = 1.1558x + 0.2876 (r = 0.97). Interestingly, much lower bias was observed in 42 renal transplant recipients as revealed by the following regression equation; y = 1.1181x + 0.2745 (r = 0.98). However, more significant positive bias was observed in 18 liver transplant recipients as following regression equation as observed: y = 1.3337x + 0.1493 (r = 0.94).
Conclusions
We conclude that MPA concentrations determined by the CEDIA assay showed significant positive bias compared to HPLC‐UV method. Therefore, caution must be exercised in interpreting therapeutic drug monitoring result of MPA if CEDIA assay is used.
Keywords: mycophenolic acid, CEDIA, HPLC‐UV, positive bias
INTRODUCTION
Mycophenolic acid (MPA), an immunosuppressant, is administered as mycophenolate mofetil (brand name CellCept), the 2‐morpholinoethyl ester of MPA due to poor bioavailability of the parent drug 1. After oral administration, mycophenolate mofetil is rapidly and completely absorbed, and is quickly de‐esterified in the blood and tissues into the pharmacologically active MPA 2. Almost all the drug (>99%) can be found in the plasma compartment and therapeutic drug monitoring can be conducted using plasma or serum specimen. MPA has an elimination half‐life of 8–18 hours (mycophenolate mofetil) and is conjugated with glucuronic acid in the liver to the primary inactive metabolite, 7‐O‐glucuronide MPA 3. Another minor active metabolite is acyl glucuronide 4. Suggested therapeutic range of MPA (trough serum or plasma level) is 1.0 to 3.5 μg/ml 5.
MPA in serum or plasma can be determined by using high‐performance liquid chromatography combined with ultraviolet detection (HPLC‐UV) or liquid chromatography combined with mass spectrometry. However, cloned enzyme donor immunoassay (CEDIA) MPA marketed by Thermo Scientific (Fremont, CA) was approved by the FDA in 2010 for clinical use, which can be easily adopted on automated analyzers for rapid determination of MPA concentration in clinical laboratories. The objective of our study is to resolve conflicting reports in the literature regarding suitability of CEDIA assay for routine TDM of MPA because one published report indicated a very wide range of positive bias in the magnitude of 15% to 52.3% among heart, kidney, and liver transplant patients while another report described average positive bias of 18% in the CEDIA assay compared to a reference HPLC‐UV method 6, 7. Here we report our findings.
MATERIALS AND METHODS
The CEDIA MPA assay kits were obtained from Thermo Scientific and assays were run using a Hitachi 917 analyzer (Roche Diagnostics, Indianapolis, IN). HPLC system (Alliance 2695 HPLC system) was purchased from Waters Corporation (Milford, MA). This HPLC system is coupled with an ultraviolet detector (UV detector Model 486) which was also purchased from Waters Corporation. The HPLC column was a C‐18 reverse‐phase column (30 × 100 mm, particle size 5 μm). All solvents used were HPLC grade. For this study, sera from 60 transplant recipients were used (42 renal transplant and 18 liver transplant recipients). These serum specimens are routinely submitted to our laboratory for therapeutic drug monitoring of MPA. After running the tests and reporting the results, these specimens are stored for a week and then discarded. This study was performed using left‐over discarded specimens after deidentification according to our Institutional Review Board's approved protocol for research using left‐over deidentified specimens.
The HPLC‐UV analysis of MPA was accomplished by using a linear gradient of mobile phase A (methanol) and mobile phase B (0.01 M phosphate buffer at pH 3) with initial mobile phase A to B ration of 35% A and 65% B and the run time of 21 min. The HPLC column was heated at 40°C and UV detector was set at 254 nm. MPA carboxy butoxy ether was used as the internal standard. This method is adopted from the report of Tsina et al. with modification 8. The assay is linear for MPA concentration between 0.2 and 40 μg/ml. There are also other published reports in the literature for analysis of MPA using HPLC‐UV and any such method is suitable for routine therapeutic drug monitoring of MPA in a toxicology laboratory 9, 10, 11, 12, 13, 14.
The CEDIA MPA tests were run using a Hitachi 917 analyzer using parameters provided by the manufacturer of the CEDIA kits (Thermo Scientific). This assay uses recombinant DNA technology. The assay is based on the enzyme β‐galactosidase, which has been genetically engineered into two inactive fragments termed as enzyme donor and enzyme acceptor. These fragments spontaneously combine together to form active enzyme that cleaves a substrate generating color. The assay analyte (MPA) competes with analyte conjugated to enzyme donor part of β‐galactosidase for limited number of antibody binding sites. The amount of active enzyme formed (if analyte is present in the sample, then it binds with the antibody leaving the conjugated part of enzyme donor molecule to combine with enzyme acceptor part of the molecule) and the resultant color change is directly proportional to the concentration of MPA in the serum specimen.
RESULTS
The within‐run precision analysis of the CEDIA MPA assay of low control showed a coefficient of variation (CV) of 9.3% (mean: 0.75 μg/ml, SD: 0.07, n = 20), while the CV of between run precision was 13.3% (mean: 0.98 μg/ml, SD: 0.13, n = 20). The CV of within‐run precision of the high control was 1.5% (mean: 6.67 μg/ml, SD: 0.10, n = 20) while the CV of between‐run precision of the high control was 4.9% (mean: 6.97 μg/ml, SD: 0.34, n = 20). We determined within‐run precision using a single run for low and high control. However, for determining between‐run precision, low and high controls were run one time each for 20 consecutive days. The CEDIA MPA was linear for a MPA concentration of 10 μg/ml and the detection limit of the assay was determined as 0.3 μg/ml.
When MPA concentrations in 60 patient specimen (42 renal transplant recipients and 18 liver transplant recipients) obtained by using the HPLC‐UV method (x‐axis) were compared with concentrations obtained by using CEDIA assay (y‐axis), we observed the following regression equation (Fig. 1):
Figure 1.

Linear regression showing comparison of MPA concentrations obtained by HPLC and CEDIA assay in 60 transplant recipients.
However, when we compared MPA concentration obtained by using the HPLC‐UV method in 42 renal transplant recipients with corresponding concentrations obtained by using the CEDIA assay, we observed the following regression equation (Fig. 2):
Figure 2.
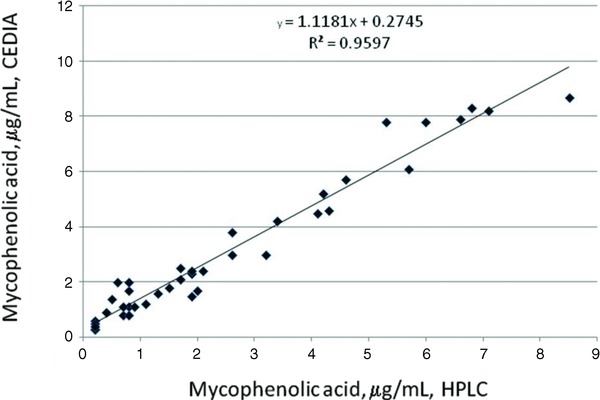
Linear regression showing comparison of MPA concentrations obtained by HPLC and CEDIA assay in 42 kidney transplant recipients.
In addition, when we compared MPA concentration obtained by using the HPLC‐UV method in 18 liver transplant recipients with corresponding concentrations obtained by using the CEDIA assay, we observed the following regression equation (Fig. 3):
Figure 3.

Linear regression showing comparison of MPA concentrations obtained by HPLC and CEDIA assay in 18 liver transplant recipients.
Although, the overall bias in measurement of MPA using CEDIA was 15.6% compared to the HPLC‐UV reference method, 21 of 60 specimens analyzed showed positive bias over 20% (Table 1). In only one specimen, MPA concentration determined by the CEDIA assay was lower (1.5 μg/ml) compared to the HPLC‐UV assay (1.9 μg/ml), indicating negative bias in the CEDIA assay. In general, it is considered that a bias over 20% may have clinical significance.
Table 1.
MPA Concentrations in Patients Showing More than 20% Positive Bias between the CEDIA Assay and HPLC‐UV Method
| Mycophenolic Acid, μg/ml | |||
|---|---|---|---|
| Transplant type | CEDIA | HPLC‐UV | Positive bias |
| Liver | 9.3 | 7.4 | 25.7% |
| Liver | 5.4 | 4.2 | 28.6% |
| Liver | 4.4 | 3.0 | 46.7% |
| Liver | 1.6 | 1.0 | 60% |
| Liver | 1.9 | 1.2 | 58.3% |
| Liver | 2.7 | 1.9 | 42.1% |
| Liver | 7.7 | 3.8 | 102.6% |
| Liver | 3.2 | 2.4 | 33.3% |
| Liver | 1.0 | 1.3 | 53.8% |
| Liver | 1.1 | 0.8 | 37.5% |
| Renal | 7.9 | 6.5 | 21.5% |
| Renal | 2.5 | 1.7 | 47.0% |
| Renal | 7.4 | 6.0 | 23.3% |
| Renal | 2.1 | 1.7 | 23.5% |
| Renal | 2.3 | 1.9 | 21.0% |
| Renal | 5.7 | 4.6 | 23.9% |
| Renal | 1.1 | 0.7 | 57.1% |
| Renal | 8.3 | 6.8 | 22.1% |
| Renal | 3.7 | 2.9 | 27.6% |
| Renal | 5.2 | 4.2 | 23.8% |
| Renal | 7.8 | 5.3 | 47.2% |
DISCUSSION
The package insert of the CEDIA MPA assay stated that the acyl glucuronide metabolite of MPA has 158% cross‐reactivity with the mycophenolic assay. Therefore, positive bias is expected in the CEDIA MPA assay compared to a chromatographic method where metabolite cross‐reactivity is not an issue. Shipkova et al. observed an overall positive bias of 41.7% in MPA concentrations determined by the CEDIA assay in kidney transplant recipients compared to a specific HPLC‐UV method. Moreover, the authors observed a higher positive bias of 52.3% in MPA concentrations liver transplant recipients using the CEDIA MPA immunoassay but only 15% bias in heart transplant recipients 6. Westley et al. also however observed an overall 18% in the CEDIA MPA assay compared to a reference HPLC‐UV method 7.
Our result indicates that average bias between CEDIA MPA assay and the HPLC‐UV method was 11.8% with kidney transplant recipients but much higher (33.3%) with liver transplant recipients. However in our study, the average bias was 15.6% combining both liver and kidney transplant recipients, which is consistent with report of Westley et al. 7 and this overall positive bias is significantly less than observed by Shipkova et al. in both kidney and liver transplant recipients.
Examining the raw data where CEDIA MPA assay determined a MPA level more than 20% compared to the HPLC assay, it was obvious that there were more significant positive bias in MPA concentrations as determined by the CEDIA assay in liver transplant recipients than kidney transplant recipients. Of 18 liver transplant recipient, ten patients (55.5%) showed positive bias over 20%. In addition, 11 of 42 kidney transplant recipients (26.1%) showed positive bias over 20%. The magnitude of positive bias was also more significant in liver transplant group.
CONCLUSION
The overall 15.6% positive bias in measuring MPA concentration using the CEDIA assay compared to a reference HPLC‐UV method is most likely due to metabolite cross‐reactivity. Because of the wide reference range of MPA (1.0–3.5 μg/ml), CEDIA assay can be used for routine therapeutic drug monitoring of MPA, if a chromatographic method is not available in the laboratory. However, results should be interpreted with caution especially for liver transplant recipients because values may be falsely elevated by 50% or more in some patients. Although less likely, more than 50% positive bias may be also be observed in kidney transplant recipients using the CEDIA assay compared to a reference HPLC‐UV method. For any patient, if clinical picture does not match with MPA concentration determined by the CEDIA assay, it is recommended to send the specimen to a reference laboratory to determine the true MPA concentration using a chromatographic reference method.
REFERENCES
- 1. Wu JC. Mycophenolate mofetil: Molecular mechanisms of action. Perspex Drug Discov Design 1994;2:185–204. [Google Scholar]
- 2. Bullingham RE, Nicholls AJ, Kamm BR. Clinical pharmacokinetics of mycophenolate mofetil. Clin Pharmacokinet 1998;34:429–455. [DOI] [PubMed] [Google Scholar]
- 3. Korecka M, Nikolic D, van Breemen RB, Shaw LM. Inhibition of inosine monophosphate dehydrogenase by mycophenolic acid glucuronide is attributable to the presence of trace quantities of mycophenolic acid. Clin Chem 1999;45:1047–1050. [PubMed] [Google Scholar]
- 4. Kaplan B, Meier‐Kriesche HU, Friedman G, et al. The effect of renal insufficiency on mycophenolic acid protein binding. J Clin Pharmacol 1999;39:715–720. [DOI] [PubMed] [Google Scholar]
- 5. Tredger JM, Brown NW, Adams J, et al. Monitoring mycophenolate in liver transplant recipients: Toward a therapeutic range. Liver Transpl 2004;10:492–502. [DOI] [PubMed] [Google Scholar]
- 6. Shipkova M, Schutz E, Besenthal I, et al. Investigation of the crossreactivity of mycophenolic acid glucuronide metabolites and of mycophenolic acid mofetil in the Cedia MPA assay. Ther Drug Monit 2010;32:79–85. [DOI] [PubMed] [Google Scholar]
- 7. Westley IS, Ray JE, Morris RG. CEDIA mycophenolic acid assay compared with HPLC‐UV in specimens from transplant recipients. Ther Drug Monit 2006;28:632–636. [DOI] [PubMed] [Google Scholar]
- 8. Tsina I, Kaloostian M, Lee R, et al. High performance liquid chromatographic method for the determination of mycophenolate mofetil in human plasma. J Chromatogr B Biomed Appl 1996;681:347–353. [DOI] [PubMed] [Google Scholar]
- 9. Shipkova M, Armstrong VW, Kiehl MG, et al. Quantification of mycophenolic acid in plasma samples collected during and immediately after intravenous administration of mycophenolate mofetil. Clin Chem 2001;47 1485–1488. [PubMed] [Google Scholar]
- 10. Zeng L, Nath CE, Shaw PJ, et al. HPLC‐UV assay for monitoring total and unbound mycophenolic acid concentration in children. Biomed Chromatogr 2009;23:92–100. [DOI] [PubMed] [Google Scholar]
- 11. Elbarbry FA, Shoker A. Simple high performance liquid chromatographic assay for mycophenolic acid in renal transplant patients. J Pharm Biomed Anal 2007;43:788–792. [DOI] [PubMed] [Google Scholar]
- 12. Patel CG, Akhlaghi F. High performance liquid chromatography method for the determination of mycophenolic acid and its acyl and phenol glucuronide metabolites in human plasma. Ther Drug Monit 2006;28:116–112. [DOI] [PubMed] [Google Scholar]
- 13. Irtan S, Azougagh S, Monchaud C, et al. Comparison of high performance liquid chromatography and enzyme multiplied immunoassay technique for monitoring mycophenolic acid in renal transplant recipients. Pediatr Nephrol 2008;23:1859–1856. [DOI] [PubMed] [Google Scholar]
- 14. Brown NW, Franklin ME, Einarsdottir EN, et al. An investigation into the bias between liquid chromatography‐tandem mass spectrometry and an enzyme multiplied immunoassay technique for the measurement of mycophenolic acid. Ther Drug Monit 2010;32:420–426. [DOI] [PubMed] [Google Scholar]