

Abstract
Background
Dimension Vista® analyzer combines four technologies (photometry, nephelometry, V‐LYTE® integrated multisensor potentiometry, and LOCI® chemiluminescence) into one high‐throughput system.
Methods
We assessed analytical performance of assays routinely performed in our emergency laboratory according to the VALTEC protocol, and practicability.
Results
Precision was good for most parameters. Analytical domain was large and suitable for undiluted analysis in most clinical settings encountered in our hospital. Data were comparable and correlated to our routine analyzers (Roche Modular DP®, Abbott AXSYM®, Siemens Dimension® RxL, and BN ProSpec®). Performance of nephelometric and LOCI modules was excellent. Functional sensitivity of high‐sensitivity C‑reactive protein and cardiac troponin I were 0.165 mg/l and 0.03 ng/ml, respectively (coefficient of variation; CV < 10%). The influence of interfering substances (i.e., hemoglobin, bilirubin, or lipids) was moderate, and Dimension Vista® specifically alerted for interference according to HIL (hemolysis, icterus, lipemia) indices. Good instrument performance and full functionality (no reagent or sample carryover in the conditions evaluated, effective sample‐volume detection, and clot detection) were confirmed. Simulated routine testing demonstrated excellent practicability, throughput, ease of use of software and security.
Conclusion
Performance and practicability of Dimension Vista® are highly suitable for both routine and emergency use. Since no volume detection and thus no warning is available on limited sample racks, pediatric samples require special caution to the Siemens protocol to be analyzed in secured conditions. Our experience in routine practice is also discussed, i.e., the impact of daily workload, “manual” steps resulting from dilutions and pediatric samples, maintenances, flex hydration on instrument's performance on throughput and turnaround time. J. Clin. Lab. Anal. 26:384‐397, 2012. © 2012 Wiley Periodicals, Inc.
Keywords: integrated analyzer, automation, consolidation, practicability, performance, functional sensitivity, interference
INTRODUCTION
The Dimension Vista® (Siemens Healthcare Diagnostics) is the first in a new class of multiparametric analyzers available for general chemistries, immunoassays, and specific proteins. It combines four detection technologies (photometry, nephelometry, V‐LYTE® integrated multisensor technology, and LOCI® advanced chemiluminescence); 1 into one high‐throughput workstation. Vista® is a fully automated system that analyses serum, plasma, urine, cerebrospinal, and other body fluids in emergency (STAT), as well as routine mode. All analyses are performed on aliquots stored onboard, allowing immediate sample release. Add‐on tests, dilutions, rerun, reflex testing, or panic repeat can therefore be easily and quickly performed without requiring access to the primary sample. Vista® can handle up to 200 samples/hr and perform up to 1,500 tests/hr. An eight‐test, basic metabolic panel (“BMP”: Na, K, Cl, total CO2, glucose, urea, creatinine, calcium) requires less than 100 μl sample and is completed in 3.1 min in STAT mode. Troponin analysis is completed in up to 11 min. The analyzer is connected to a Siemens EasyLink™ Data Management System for retrieval and processing of patient data. Quality controls (QCs) can be stored onboard on Vista® and QC results can be managed on Easylink® as configured by the operator.
The aim of the study was to evaluate in the clinical laboratory of a tertiary teaching hospital (i) the analytical performance (precision, linearity, functional sensitivity, comparability, interference) of assays used in an emergency setting (chemistry, enzymes, and the proteins cardiac troponin I [cTnI], N‐terminal pro‐B‐type natriuretic peptide [Nt‐proBNP], and β chorionic gonadotrophin [βHCG]); (ii) the performance of the instrumentation itself (reagent and sample carryover, sample‐volume detection, and clot detection); and (iii) the practicability of the system under routine laboratory conditions.
METHODS
Instrument
Vista® was installed and the laboratory staff was trained prior to the study to acquaint themselves with the operation and use of the system. During the evaluation study, software versions Vista® SW 2.0.2 then 3.0 were used.
Methods and Reagents
The methods evaluated were performed with reagents, buffers, calibrators, and adaptations available from Siemens Healthcare Diagnostics (Table 1).
Table 1.
Analytical Characteristics and Calibration Procedures of Dimension Vista® Methods
| Analyte | Mnemonic | Calibrator | Calibration frequency | Calibration type | Sample (μl)a | Reagent 1 | Reagent 2 | Reagent 3 | Reaction time min | Principle of methods/technology | Wavelength (nm) |
|---|---|---|---|---|---|---|---|---|---|---|---|
| α1‐acid glycoprotein | A1AG | PROT1 CAL | 45 days | non linear 6 points | 7.7a | 127.6 | 7 | 15.3 | 6 | Specific antibodies/Nephelometry | 840 |
| α 1‐antitrypsin | A1AT | PROT1 CAL | 45 days | non linear 6 points | 13.7a | 109.6 | 27.4 | 6 | Specific antibodies/Nephelometry | 840 | |
| Albumin | ALB | CHEM 4 CAL | 90 days | linear 2 points | 1.67 | 41.7 | 2.2 | Bromocresol purple/polychromatism end point | 540, 600, 700 | ||
| Alkaline Phosphatase | ALP | ALP CAL | 90 days | linear 2 points | 3 | 6 | 19.29 | 19.29 | 5.6 | AMP/Calibration/37°C/bichromatic kinetic | 405, 510 |
| Alanine Aminotransferase | ALT | ENZ 2 CAL | 90 days | linear 2 points | 14.58 | 12.5 | 33.33 | 5.3 | L‐Alanine/α‐KG/NADH in NAD/Calibration/37°C/bichromatic kinetic | 340, 700 | |
| Amylase | AMY | ENZ 1 CAL | 90 days | linear 2 points | 5.25 | 82.1 | 3.4 | CNPG3/ Calibration/37°C / bichromatic kinetic | 405, 577 | ||
| Aspartate Aminotransferase | AST | ENZ 2 CAL | 90 days | linear 2 points | 13.33 | 33.33 | 21.67 | 5.3 | L‐Aspartate/α KG/NADH in NAD/Calibration/37°C/bichromatic kinetic | 340, 700 | |
| Beta HCG | BHCG | BHCG CAL | 30 days | non linear 6 points | 2 | 25 | 25 | 100 | 10 | LOCI/Chemiluminescence (flash) | 680, 612 |
| Urea | UREA | CHEM 1 CAL | 30 days | linear 2 points | 1.2 | 36 | 2.6 | Urease and GLDH/bichromatic kinetic | 340, 383 | ||
| Calcium | CA | CHEM 1 CAL | 90 days | linear 2 points | 1.67 | 48.33 | 11 | 1.2 | Cresolphthalein Complexone/bichromatic end point | 577, 540 | |
| Cholesterol | CHOL | CHEM 1 CAL | 90 days | linear 2 points | 1.25 | 36.5 | 10.8 | 5.6 | Cholesterol esterase (Stadtman adapté/Liedtke) bichromatic end point | 540, 452,700 | |
| Creatine Kinase | CK | CK CAL | 90 days | linear 2 points | 5.77 | 39.15 | 4.9 | CP/ADP/NADP in NADPH/Calibration/37°C/bichromatic kinetic | 340, 405 | ||
| Creatinine | CREA | CHEM 1 CAL | 90 days | linear 2 points | 8 | 29.6 | 7.2 | 1.2 | Picrate in alkaline buffer(Jaffé)/bichromatic kinetic | 510, 600 | |
| CRP | CRP | PROT2 CAL | 45 days | non linear 7 points | 1.37a | 118 | 27.3 | 5.8 | Specific antibodies/Nephelometry | 840 | |
| Cardiac Troponin I | cTnI | cTnI CAL | 30 days | non linear 6 points | 20 | 20 | 20 | 13 | 10 | LOCI/Chemiluminescence (flash) | 680, 612 |
| Direct Bilirubin | DBIL | TDBIL CAL | 90 days | linear 2 points | 5 | 12.5 | 25 | 4.9 | Diazo‐Caffeine/Benzoate (Jendrassik‐Grof) w/blank/bichromatic end point | 540, 700 | |
| Ferritin | FERR | LOCI 4 CAL | 30 days | non linear 5 points | 2 | 20 | 20 | 100 | 10 | LOCI/Chemiluminescence (flash) | 680, 612 |
| γ Glutamyl Transferase | GGT | ENZ 1 CAL | 90 days | linear 2 points | 11.43 | 26.79 | 1.9 | GCNA/Calibration/37°C/bichromatic kinetic | 405, 600 | ||
| Glucose | GLU | CHEM 1 CAL | 90 days | linear 2 points | 1.2 | 22.4 | 2 | Hexokinase, UV/bichromatic end point | 340, 383 | ||
| Haptoglobin | HAPT | PROT1 CAL | 45 days | non linear 6 points | 7.1a | 114 | 7 | 28.6 | 6 | Specific antibodies/Nephelometry | 840 |
| hsCRP | hsCRP | PROT2 CAL | 45 days | non linear 7 points | 1.37 | 118 | 27.3 | 5.8 | Specific antibodies/Nephelometry | 840 | |
| Lactic Acid | LA | CHEM 1 CAL | 90 days | linear 2 points | 1.8 | 9 | 33.8 | 9 | 8.9 | Lactate in Pyruvate/NAD in NADH/Calibration/37°C/bichromatic end point | 340, 383 |
| Lactate Dehydrogenase | LDH | ENZ 1 CAL | 90 days | linear 2 points | 6 | 21.43 | 38.57 | 2 | L‐Lactate/NAD in NADH/Calibration/37°C/bichromatic kinetic | 340, 383 | |
| Lipase | LIP | ENZ 1 CAL | 45 days | linear 2 points | 1.9 | 48 | 48 | 3.1 | Methyl resorufin ester substrate/Calibration/37°C/bichromatic kinetic | 577, 700 | |
| Microalbuminuria | MALB | PROT3 CAL | 45 days | non linear 7 points | 10 | 117.5 | 20 | 19 | Specific antibodies/Nephelometry | 840 | |
| N‐terminal pro‐BNP | PBNP | PBNP CAL | 30 days | non linear 6 points | 8 | 20 | 20 | 15 | 10 | LOCI/Chemiluminescence (flash) | 680, 612 |
| Phosphorus | PHOS | CHEM 2 CAL | 90 days | linear 2 points | 1.3 | 21.3 | 8.5 | 8.5 | 2.9 | Phosphomolybdate UV/bichromatic end point | 340, 700 |
| Triglycerides | TG | CHEM 2 CAL | 90 days | linear 2 points | 1.6 | 55 | 5.6 | Lipoprotein Lipase‐ GK‐ GPO‐ POD bichromatic end point | 510, 700 | ||
| Total Bilirubin | TBIL | TDBIL CAL | 90 days | linear 2 points | 5 | 125 | 23.5 | 7.5 | Diazo‐(J‐G) w/blank/bichromatic end point | 540, 700 | |
| Total CO2 | CO2 | CHEM 3 CAL | 90 days | linear 2 points | 1.9 | 38 | 1.9 | Enzymatic/bichromatic kinetic | 405, 700 | ||
| Total proteins | TP | CHEM 4 CAL | 90 days | linear 2 points | 6.2 | 34.7 | 34.7 | 3.8 | Biuret/bichromatic end point | 540, 700 | |
| Transferrin | TRF | PROT1 CAL | 45 days | non linear 5 points | 7.1a | 114.3 | 7 | 28.6 | 6 | Specific antibodies/Nephelometry | 840 |
| Urine/CSF proteins | UCFP | UCFP CAL | 60 days | non linear 5 points | 3.7 | 128.68 | 2 | Pyrogallol red/bichromatic end point | 600, 700 | ||
| Uric Acid | URCA | CHEM 1 CAL | 90 days | linear 2 points | 6.6 | 50.8 | 10 | 4.9 | Uricase/bichromatic end point | 293, 700 | |
| Na, K, Cl | Na, K, Cl | STD A – B | 4 hr | 25 | 0.35 | Indirect Potentiometry |
1/20 prediluted sample. The indicated volume is in the reaction cup.
Specimens and Control Solutions
Two or three QC levels from Siemens Healthcare Diagnostics (Dade Tru Liquid Urine; Dade Tru Liquid Monitrol; Dade Bili; Prot 1, 2 and 3 Controls; Dade Cardiac XL; Liquid Immunoassay) as well as urine, plasma, and serum samples from our laboratory were used. Blood was collected in vacuum tubes with or without lithium heparinate (Beckton Dickinson®). Plasma pools were used for precision, functional sensitivity, and interference studies that required high sample volumes. Pools were centrifuged, and plasma was separated and either used immediately or stored in aliquots at −80°C. Before analysis, pools were thawed at room temperature and centrifuged.
Evaluation Protocol
The evaluation was performed according to the VALTEC protocol as recommended by the French Society of Biological Chemistry (Société Française de Biologie Clinique) 2, 3, 4. For cTnI and Nt‐proBNP, limits have not been published by Vassault et al. 4 or elsewhere and consequently are not configured in the Valtec software. We, thus verified that the analytical performances of Vista® were at least those of Dimension RXL® method.
Imprecision
To study within‐run imprecision, QC and plasma pool were tested 20‐fold in the same run. To evaluate between‐run imprecision, onboard bar‐coded QC were automatically assessed daily at scheduled times. Appropriate criteria for the evaluation of the imprecision were published by Vassault et al. in 1999 4.
Linearity
Linearity was checked using either manual dilutions of plasma or the ability of Vista® to automatically check linearity from dilutions of the highest calibrator level. Manual dilutions were performed using plasma pool or diluents recommended by Siemens Healthcare Diagnostics (concentrations/activities ranging from 1% to 100%).
Limit of Detection and Functional Sensitivity
The limit of detection (LOD) was determined for cTnI and high‐sensitivity C‐reactive protein (hsCRP) as the lowest concentration that can be statistically distinguished from a reaction blank. Twenty blank samples (Siemens Healthcare Diagnostics recommended diluent) were analyzed in duplicate in the same run, and LOD was calculated from the calibration curve.
The functional sensitivity is the lowest concentration corresponding to a total coefficient of variation (CV) of 10%. To assess within‐run functional sensitivity of cTnI and hsCRP, plasma pools were tested 20‐fold in duplicate in the same run. cTnI between‐run functional sensitivity was also evaluated according to Panteghini 5. Briefly, plasma pools were assessed in duplicate on 21 consecutive days using three reagent lots and three calibrations.
Accuracy Evaluation by Method Comparison
Each method on Vista® was compared with its respective method on our routine analyzers (Abbott AXSYM® [βHCG], Siemens Dimension RxL® [ferritin, cTnI, Nt‐proBNP], BN ProSpec® [specific plasma proteins], and Roche Modular DP® 6 [other tests]) by analyzing plasma samples selected from the routine laboratory in order to cover the pathophysiological analytical ranges. Measurements were carried out on multiple days to mimic routine conditions. All parameters were analyzed by both methods within 8 hr except glucose, bilirubin, and total CO2, which were analyzed within 2 hr.
Interference
Effects of hemolysis (H), turbidity‐latescence (L), and bilirubin‐icterus (I) were evaluated according to the VALTEC protocol 2, 3 by overloading a plasma pool with increasing concentrations of red blood cell hemoglobin lysate (Hb up to 621 μmol/l corresponding to 1 g/dl prepared as recommended 2, 3 and measured by the cyanide‐free sodium lauryl sulfate (SLS)‐hemoglobin method on Sysmex® analyser), total bilirubin (Sigma; up to 1,710 μmol/l), and Intralipid™ triglycerides (TG; up to 12.54 mmol/l). For each test, measured values were expressed as a percentage of baseline concentration (before overloading) The cut‐off point in determining HIL interference levels was fixed for all analytes to values exceeding 10% deviation between baseline and measured value 7.
Reagent‐Related Carryover
In order to minimize potential reagent carryover, Vista® configuration does not allow location of susceptible tests on the same server (refrigerated area that contains reagents, calibrators, and QCs). In order to study the carryover of TG and aspartate aminotransferase (AST) toward the respective determinations of lipase and lactate dehydrogenase (LDH), Vista® configuration was modified and reagents were loaded on the same server, so that the same potentially contaminated reagent probe was used. Ten determinations of lipase and LDH were processed (C1). Then the sequence TG‐lipase or AST‐LDH was processed 10‑fold (C2).
Sample‐Related Carryover
Sample‐related carryover between high‐ and low‐concentration plasma samples was studied with creatine kinase (CK) for photometry, hsCRP for nephelometry, and βHCG for LOCI. Three high‐concentration specimens (H1, H2, H3), alternatively followed by three low‐concentration specimens (L1, L2, L3), were processed five‐fold.
To study between urine and plasma carryover, urea and creatinine were measured five‐fold for urine and plasma separately. Mean concentrations Um and Pm were calculated. Then the following urine‐plasma sequence was processed: U1‐P1, U2‐P2, … U5‐P5.
Conventional carryover studies are made difficult on Dimension Vista® because the sequence of specimen analysis is optimized and controlled by the software. To control the sequence of specimen analysis, each sample was ordered and loaded sequentially on separated racks after the previous sample was taken into account by the Dimension Vista®.
Sample‐Volume Detection
Seven‐milliliter and 5‐ml tubes as well as 1.5‐ml Dimension cups were filled with plasma at 20%, 10%, and 5% of total capacity until sample was detected as insufficient when testing a BMP panel (Na, K, Cl, C02, glucose, urea creatinine, calcium). Cups were loaded either on standard racks with recommended adapter or on racks specified for optimal sampling.
Clot Detection
To evaluate the ability of Vista® to detect the impact of fibrin on sampling and/or test results, 0.7, 1.5, and 3 ml of plasma were added to thrombin tubes (1.4 units NIH thrombin, BD Vacutainer®), allowed to clot for 5 min, and loaded alternatively with ten control nonclotted plasma for BMP analysis.
Practicability and Daily Typical Workload
We evaluated the capacity of Vista® to process a 1‐day, standard workload in our hospital laboratory. The daily typical workflow was performed with plasma and urine samples with a mixture of tubes (5, 7 ml, and urine), cups and emergency requests. Samples from the whole previous day were stored, preordered on Vista® and analyzed as quickly as possible in the absence of any interfering event. Emergency requests were introduced via the STAT input lane during routine workload processing. Turnaround time (TAT) was calculated on the basis of the total time between submission of the sample to Vista® and completion of all analyses. Analytical time per test was also calculated in the best conditions to optimize the instrument's performance. The impact of the daily workload, limited sample racks (pediatric samples), maintenances, flex hydration on the instrument's performance was not studied.
Statistical Analysis
Statistical analysis and results were obtained from PC VALTEC 97 3, 8, 9, 10. Mean (m), standard deviation (SD), and CV were calculated; P < 0.05 was considered as significant. Methods comparisons were done according to Passing–Bablok.
RESULTS
Within‐Run and Between‐Run Imprecision
Imprecision CVs were acceptable for most parameters according to VALTEC (4; Table 2). Unacceptable within‐run results were obtained for urea (mean level 17.3 mmol/l; CV 2.25 for 1.9% accepted according to Valtec) and between‐run chloride, total CO2, low creatinine, direct bilirubin, and AST.
Table 2.
Within‐run and Between‐run Imprecision of Dimension Vista® Methods
| Analyte | Within run (n = 20) | Between‐run (n = 29) | ||||||
|---|---|---|---|---|---|---|---|---|
| PLASMA | m | CV% | m | CV% | m | CV% | m | CV% |
| Sodium (mmol/l) | 135.85 | 0.27 | 148.25 | 0.30 | 127.15 | 1.63 | 142.50 | 1.03 |
| Potassium (mmol/l) | 4.83 | 0.19 | 5.68 | 0.24 | 4.80 | 1.72 | 5.41 | 0.41 |
| Chloride (mmol/l) | 95.10 | 0.90 | 105.05 | 0.21 | 103.30 | 1.69 | 108.15 | 4.34 |
| Total CO2 (mmol/l) | 17.91 | 1.37 | 28.08 | 1.44 | 17.12 | 12.30 | 26.20 | 7.28 |
| Total Proteins (g/l) | 43.10 | 0.71 | 71.95 | 0.55 | 46.25 | 2.79 | 70.18 | 1.34 |
| Urea (mmol/l) | 6.18 | 1.67 | 17.30 | 2.25 | 6.31 | 1.86 | 17.48 | 2.07 |
| Creatinine (μmol/l) | 102.74 | 3.84 | 634.24 | 0.76 | 112.50 | 7.16 | 686.44 | 1.28 |
| Glucose (mmol/l) | 5.23 | 1.12 | 14.56 | 1.17 | 6.16 | 1.13 | 17.12 | 1.16 |
| Triglycerides (mmol/l) | 1.20 | 2.57 | 2.15 | 1.06 | 2.34 | 2.92 | nd | nd |
| Cholesterol (mmol/l) | 10.59 | 1.15 | 21.82 | 1.49 | 2.77 | 2.36 | 5.39 | 1.47 |
| Calcium (mmol/l) | 2.53 | 0.89 | 2.90 | 1.18 | 2.45 | 1.46 | 2.80 | 1.21 |
| Phosphorus (mmol/l) | 1.59 | 0.94 | 2.37 | 1.40 | 1.66 | 2.15 | 2.24 | 3.59 |
| Uric Acid (μmol/l) | 300 | 0.95 | 607 | 0.98 | 316.09 | 2.31 | 678.71 | 2.14 |
| Lactic Acid (mmol/l) | 2.35 | 2.18 | 5.73 | 1.51 | nd | nd | nd | nd |
| Total Bilirubin (μmol/l) | 15.54 | 1.87 | 60.98 | 0.89 | 119.36 | 1.76 | 335.43 | 2.69 |
| Direct Bilirubin (μmol/l) | 6.72 | 4.56 | 26.11 | 2.05 | 104.68 | 2.36 | nd | nd |
| AST (IU/l) | 28.70 | 3.77 | 188.00 | 0.91 | 32.69 | 7.77 | 194.00 | 1.14 |
| ALT (IU/l) | 43.90 | 2.33 | 106.35 | 2.54 | 36.53 | 5.80 | 77.67 | 2.82 |
| ALP (IU/l) | 102.95 | 2.39 | 404.95 | 1.71 | 146.33 | 4.08 | 430.32 | 3.57 |
| GGT (IU/l) | 57.60 | 2.21 | 152.10 | 0.70 | 59.00 | 3.36 | 144.73 | 1.79 |
| CK (IU/l) | 165.80 | 1.20 | 402.95 | 1.05 | 162.79 | 2.43 | 377.61 | 2.94 |
| LDH (IU/l) | 175.60 | 1.76 | 402.85 | 1.61 | 168.11 | 2.82 | 378.79 | 4.19 |
| Amylase (IU/l) | 104.85 | 0.64 | 320.95 | 0.81 | 114.45 | 1.59 | 347.10 | 2.04 |
| Lipase (IU/l) | 134.75 | 2.39 | 406.25 | 1.89 | 198.35 | 4.97 | 313.20 | 5.07 |
| cTnI (ng/ml) | 0.256 | 2.68 | 1.338 | 0.94 | 0.134 | 4.11 | 3.20 | 2.96 |
| βHCG (IU/l) | 7.40 | 2.06 | 22.19 | 1.04 | nd | nd | nd | nd |
| Nt‐proBNP (pg/ml) | 173.44 | 0.97 | 805.74 | 1.36 | nd | nd | 1,964 | 4.44 |
| Albumin (g/l) | 29.82 | 1.99 | 48.57 | 1.41 | 26.01 | 3.02 | 44.51 | 2.13 |
| α1‐acid glycoprotein (g/l) | 0.83 | 2.21 | 1.25 | 1.56 | 0.54 | 4.20 | 0.74 | 4.21 |
| α1‐antitrypsin (g/l) | 0.98 | 3.47 | 2.34 | 3.49 | 0.98 | 3.26 | 1.31 | 3.92 |
| Haptoglobin (g/l) | 0.81 | 2.30 | 1.19 | 1.58 | 0.75 | 4.05 | 0.98 | 3.69 |
| CRP (mg/l) | 12.05 | 3.57 | 47.76 | 1.47 | 12.46 | 5.23 | 52.11 | 3.52 |
| hsCRP(mg/l) | 1.21 | 1.83 | 3.90 | 1.31 | 1.45 | 4.12 | 4.50 | 2.41 |
| Ferritin (ng/ml) | 55.89 | 1.43 | 239.80 | 1.44 | 55.41 | 1.74 | 375.74 | 4.02 |
| Transferrin (g/l) | 2.55 | 2.01 | 3.17 | 2.13 | 2.07 | 1.58 | 3.56 | 2.20 |
| URINE | m | CV% | m | CV% | m | CV% | m | CV% |
|---|---|---|---|---|---|---|---|---|
| Sodium (mmol/l) | 75.90 | 0.84 | 146.05 | 0.61 | 86.20 | 3.84 | 165.63 | 1.86 |
| Potassium (mmol/l) | 28.96 | 0.63 | 82.85 | 0.72 | 28.45 | 0.72 | 80.26 | 0.50 |
| Chloride (mmol/l) | 56.45 | 0.90 | 159.90 | 0.35 | 61.13 | 3.01 | 179.35 | 0.55 |
| Urea (mmol/l) | 139.71 | 1.87 | 309.65 | 1.53 | 146.58 | 2.45 | 260.02 | 2.11 |
| Creatinine (mmol/l) | 5.61 | 0.92 | 13.41 | 0.68 | 6.59 | 3.42 | 13.02 | 3.28 |
| Glucose (mmol/l) | 1.19 | 1.47 | 15.12 | 0.79 | 1.32 | 1.42 | 16.35 | 0.87 |
| Proteins (g/l) | 1.42 | 6.00 | 7.01 | 1.50 | nd | nd | 6.69 | 1.99 |
| Microalbuminuria (mg/l) | nd | nd | nd | nd | nd | nd | nd | nd |
Bold: CV exceeds the acceptable limit according to VALTEC; nd, not done.
Appropriate criteria for the evaluation of the imprecision were published by Vassault et al. in 1999 4.
Linearity
Using both manual plasma dilution and Vista® automatic calibrator dilution, we confirmed the upper limit of the linearity range specified by the manufacturer for all parameters (Table 3). Manual‐dilution linearity showed overall recovery of theoretical values between 87.3% and 120% (for creatinine and bilirubin, respectively). Protein assay was linear from 3.9 to 107 g/l. The absence of hook effect could be verified in routine practice, with patient samples with βHCG concentrations of 280,900 IU/l, Nt‐proBNP 861,800 pg/ml, ferritin 129,100 ng/ml, and cTnI 688 ng/mL.
Table 3.
Analytical Range
| Analyte | Specified by Siemens | Verified by automatic dilutiona | Verified by manual dilutionb | Units |
|---|---|---|---|---|
| Total proteins | 0–120 | 0–122 | 3.9–107.6 | g/l |
| Creatinine | 9–1,768 | 0–1,874 | 8–1,956 | μmol/l |
| Glucose | 0.06–27.75 | 0–29 | 0.9–29 | mmol/l |
| Total bilirubin | 2–428 | 0–465 | 5.4–363 | μmol/l |
| CRP | 3.1–190 | nd | 11–183 | mg/l |
| Ferritin | 0.5–2,000 | 0–2,072 | 124–1,979 | ng/ml |
| βHCG | 1–1,000 | 0–1,085 | 18–930 | IU/l |
| cTnI | 0.015–40 | 0–41.8 | 2.4–38.3 | ng/ml |
| Nt‐proBNP | 5–35,000 | 0–37,830 | 1,529–24,466 | pg/ml |
| AST | 0–1,000 | 0–1,098 | nd | U/l |
| ALT | 0–1,000 | 0–1,047 | nd | U/l |
Automatic dilution linearity assessed using Dimension Vista® automatic calibrator dilution functionality.
Manual dilution linearity assessed by analyzing dilutions of a plasma with high analyte content.
LOD and Functional Sensitivity of cTnI and hsCRP
LOD of cTnI and hsCRP were 0.0144 ng/ml and 0.0129 mg/l, respectively. Within‐run functional sensitivities of cTnI and hsCRP were 0.026 ng/ml and 0.165 mg/l, respectively (Fig. 1A,B). Between‐run cTnI functional sensitivity was 0.03 ng/ml (Fig. 1C).
Figure 1.
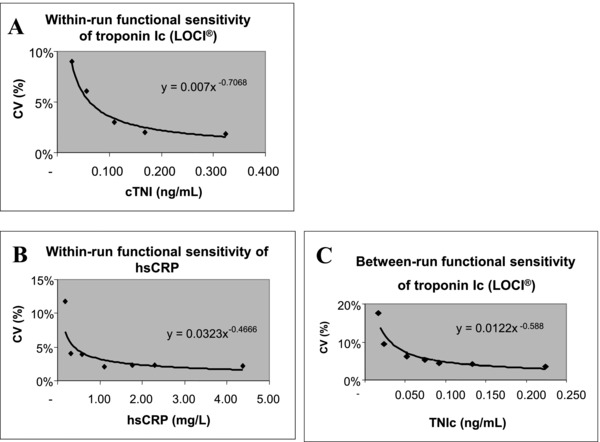
Functional sensitivities of cardiac troponin I (cTnI) and C‐reactive protein (hsCRP): within‐run for cTnI (A) and hsCRP (B) and between‐run for cTnI (C).
Accuracy Evaluation by Method Comparison
A good correlation was observed between analyzers for most chemistry methods, nephelometry, and LOCI immunoanalysis methods (Table 4). For most parameters, results between analyzers were comparable. A proportional difference was found for enzymes and bilirubin; a constant difference was detected for plasma albumin.
Table 4.
Accuracy Evaluation by Method Comparison with Patient Specimens
| Analyte plasma | n | Min–max | Corr. Coeff. | Slope (95% CI) | Intercept (95% CI) | Comments |
|---|---|---|---|---|---|---|
| Sodium | 177 | 120–154 | 0.89 | 1.03 (1.00 to 1.17) | −4.76 (−22.83 to 0.00) | Acceptable |
| Potassium | 173 | 2.2–6.1 | 0.99 | 1.01 (1.00 to 1.05) | −0.03 (−0.19 to −0.01) | Acceptable |
| Chloride | 129 | 80–113 | 0.94 | 1.05 (1.00 to 1.20) | –1.62 (−16.40 to 3.00) | Acceptable, differences dispersion |
| Total CO2 | 72 | 20–42 | 0.95 | 1.00 (0.90 to 1.00) | −1.00 (−1.00 to 1.08) | Acceptable |
| Proteins | 149 | 33–90 | 0.97 | 0.95 (0.92 to 0.99) | 2.01 (0.35 to 4.44) | Acceptable |
| Urea | 188 | 1.8–45 | 1.00 | 0.98 (0.97 to 1.00) | −0.31 (−0.40 to −0.21) | Acceptable |
| Creatinine | 189 | 21–710 | 1.00 | 1.08 (1.07 to 1.11) | −0.03 (−2.32 to 1.02) | Acceptable |
| Glucose | 92 | 2.5–12.4 | 1.00 | 1.07 (1.05 to 1.09) | 0.048 (−0.08 to 0.15) | Acceptable |
| Calcium | 165 | 1.40–2.77 | 0.95 | 0.94 (0.89 to 1.00) | 0.13 (−0.01 to 0.23) | Acceptable, differences dispersion |
| Phosphorus | 141 | 0.56–2.63 | 0.99 | 0.97 (0.94–1.00) | −0.03 (−0.07 to −0.01) | Acceptable |
| Lactic Acid | 125 | 0.4–35 | 1.00 | 0.99 (0.96 to 1.00) | −0.01 (−0.03 to 0.02) | Acceptable |
| Cholesterol | 104 | 2.0–7.3 | 0.99 | 0.98 (0.95 to 1.00) | 0.04 (−0.06 to 0.16) | Acceptable |
| Triglycerides | 127 | 0.37–5.84 | 1.00 | 0.93 (0.92 to 0.94) | −0.01 (−0.02 to −0.00) | Acceptable |
| Uric acid | 113 | 130–706 | 0.99 | 1.04 (1.01 to1.07) | −18.8 (−27.16 to −11.76) | Acceptable |
| bilirubin | 132 | 2–142 | 1.00 | 0.86 (0.82 to 0.88) | 0.49 (0.13 to 1.00) | Proportional difference |
| Amylase | 137 | 8–239 | 0.98 | 0.83 (0.81 to 0.86) | 2.8 (0.71 to 3.71) | Proportional difference |
| AST | 147 | 11–364 | 1.00 | 1.00 (0.97 to 1.00) | −2.00 (−2.00 to −1.04) | Acceptable |
| ALT | 142 | 7–264 | 0.99 | 1.04 (1.00 to 1.08) | 3.13 (1.50 to 4.00) | Acceptable (imprecision in low values) |
| GGT | 136 | 9–506 | 1.00 | 1.38 (1.37 to 1.39) | −8.28 (−9.30 to −7.72) | Proportional difference |
| ALP | 129 | 25–438 | 0.99 | 1.06 (1.04 to 1.08) | 4.88 (3.49 to 6.54) | Proportional difference |
| LDH | 129 | 183–1,400 | 0.99 | 0.47 (0.46 to 0.48) | 3.63 (−2.53 to 9.53) | Proportional difference |
| CK | 130 | 10–772 | 1.00 | 0.94 (0.93 to 0.96) | −3.640 (−4.99 to −2.24) | Acceptable |
| Lipase | 65 | 7–188 | 1.00 | 2.86 (2.82 to 2.91) | −0.53 (−2.49 to 0.84) | Proportional difference |
| Albumin | 123 | 18–50 | 0.96 | 0.96 (0.91 to 1.02) | −5.48 (−7.87 to −3.55) | Constant difference |
| α1‐antitrypsin | 137 | 0.16–3.4 | 0.97 | 1.02 (0.95 to 1.05) | −0.01 (−0.05 to 0.09) | Acceptable |
| Haptoglobin | 80 | 0.06–2.72 | 0.99 | 1.02 (0.98 to 1.05) | 0.08 (0.03 to 0.11) | Acceptable |
| α1‐AGP | 127 | 0.32–3.12 | 0.99 | 1.03 (1.00 to 1.06) | 0.04 (0.01 to 0.06) | Acceptable |
| Transferrin | 118 | 1.02–4.10 | 0.98 | 0.95 (0.90 to 0.97) | 0.09 (0.04 to 0.22) | Acceptable |
| CRP | 134 | 4–308 | 0.99 | 1.05 (1.02 to 1.07) | 1.21 (1.01 to 1.50) | Acceptable |
| Ferritin | 87 | 8–1,074 | 1.00 | 0.99 (0.97 to 1.01) | 0.46 (−1.18 to 4.11) | Acceptable |
| βHCG | 62 | 0–541 | 1.00 | 0.93 (0.90 to 0.96) | 0.65 (−0.03 to 1.06) | Acceptable |
| Nt‐proBNP | 38 | 9–5,938 | 0.99 | 1.38 (1.31 to 1.50) | –7.69 (−23.24 to 11.88) | unstandardized methoda |
| cTnI | 163 | 0–23.9 | 1.00 | 1.16 (1.11 to 1.19) | ‐0.03 (−0.03 to −0.02) | unstandardized methoda |
Coefficient of correlation (Corr. Coeff.), slope, intercept and 95% confidence interval (CI) for slope and intercept were calculated by Passing–Bablok regression analysis.
Unstandardized method, no limit in VALTEC. For cTnI and Nt‐proBNP, limits have not been published by Vassault et al. 4 or elsewhere and consequently are not configured in the Valtec software. We thus verified that the analytical performances of Vista® were at least those of Dimension RXL® method.
Interference
Hemolysis produced interference toward albumin, bilirubin, cholesterol, CO2 (Fig. 2; Hb >621 μmol/l), alkaline phosphatase (ALP), and cTnI (Hb >310 μmol/l). The expected linear interference toward phosphorus, CK, K, AST, and LDH was observed. For ALT, calcium, chloride, creatinine, hsCRP, glucose, Na, Nt‐proBNP, proteins, and urea, no interference was found up to 621‐μmol/l Hb.
Figure 2.
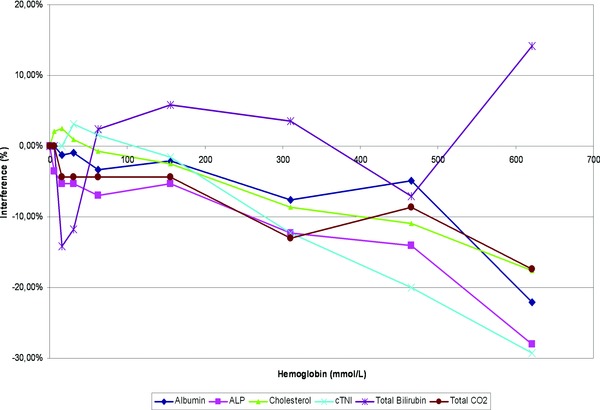
Influence of interfering substances: The effects of haemolysis were evaluated according to VALTEC protocol by overloading a plasma pool with increasing concentrations of red blood cell lysate‐haemoglobin. For each test, measured values were expressed as a percentage of the baseline concentration (before overloading).
Bilirubin (tBil) produced a negative interference toward albumin (up to –90% at 1,710 μmol/l), ALT, AST, phosphorus (Fig. 3A; tBil > 427 μmol/l), calcium, LDH, proteins (tBil > 213 μmol/l), cholesterol, and creatinine (tBil > 106 μmol/l) and a positive interference toward ALP, chloride, glucose, Na (Fig. 3B; tBil > 855 μmol/l) and urea (tBil > 427 μmol/l). For CO2, hsCRP, K, Nt‐proBNP, and cTnI, no interference was found up to 1,710‐μmol/l bilirubin.
Figure 3.
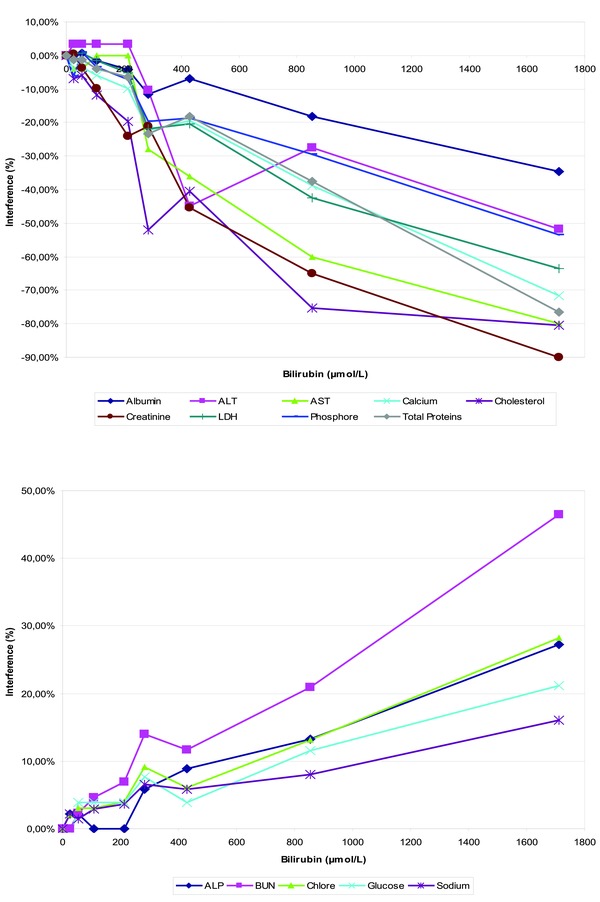
Influence of interfering substances: The effects of bilirubin‐icterus (A and B) were evaluated according to VALTEC protocol by overloading a plasma pool with increasing concentrations of total bilirubin. For each test, measured values were expressed as a percentage of the baseline concentration (before overloading).
Turbidity‐latescence related to TG produced interference with creatinine, glucose, urea (Fig. 4; TG > 10.2 mmol/l), calcium, ALT, AST, bilirubin, and hsCRP (TG > 5.7 mmol/l). No interference was found at up to 12.54‐mmol/l TG for ALP, albumin, chloride, cholesterol, CO2, CK, K, LDH, Na, Nt‐proBNP, cTnI, phosphorus, and proteins.
Figure 4.
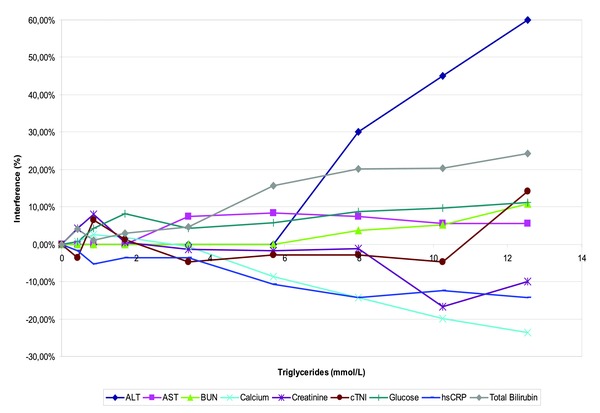
Influence of interfering substances: The effects of turbidity‐latescence, were evaluated according to VALTEC protocol by overloading a plasma pool with increasing concentrations of IntralipidTM TG. For each test, measured values were expressed as a percentage of the baseline concentration (before overloading).
We confirmed the ability of Vista® to flag or suppress results of interference‐affected analytes (i.e., interference exceeding 10%) according to HIL indices configured by the manufacturer. Although Hb did not alter bilirubin‐icterus (I) and turbidity‐latescence (L) index measurements, bilirubin with I index ≥3 altered H measurement, and false‐positive hemolysis was reported. Similarly, turbidity with L index ≥5 altered both H and I index measurements, and false‐positive hemolysis and icterus were reported.
Reagent‐Related Carryover
No reagent‐related carryover was evidenced for either TG toward lipase (C2: 142 ± 3.46 vs. C1: 145 ± 3.87 U/l, nonsignificant) or for AST toward LDH (C2: 166 ± 2.7 vs. C1: 164 ± 2.85 U/l, nonsignificant).
Sample‐Related Carryover
No sample carryover could be found, either between urine and plasma (Table 5) or between plasma samples with CK for photometry (CK: 2,270 and 25.6 U/l for high and low concentration), hsCRP for nephelometry (230 and 1.37 mg/l), or βHCG for the LOCI module (207,000 U/l and <1 U/l). CVs for low‐concentration plasma samples were between 1.4% and 4.5%, with no significant difference between concentrations of samples susceptible to carryover (L1) and nonsusceptible to carryover (L2, L3).
Table 5.
Sample‐related Carryover between Urine and Plasma
| Analyte | Units | Um | U1 | U2 | U3 | U4 | U5 | Pm | P1 | P2 | P3 | P4 | P5 | P |
|---|---|---|---|---|---|---|---|---|---|---|---|---|---|---|
| Urea | mmol/l | 551 ± 12 | 570 | 580 | 576 | 583 | 594 | 4.2 ± 0.1 | 4.2 | 4.2 | 4.3 | 4.3 | 4.2 | ns |
| Creatinine | U: mmol/l P: μmol/l | 30.3 ± 0.9 | 30.5 | 29.2 | 30.3 | 30.9 | 31.3 | 87.2 ± 5.5 | 84.6 | 87.5 | 83.1 | 89.2 | 84.9 | ns |
ns, nonsignificant (Mann–Whitney).
Urea and creatinine were measured five‐fold for urine and plasma samples. Mean concentrations Pm and Um were calculated. Then, the following urine plasma sequence was processed: U1–P1, U2–P2, … U5–P5.
Sample‐Volume Detection
We found that in primary sample tubes (5 or 7 ml), the minimum volume required was 1,400 μl. Using cups, a complete BMP analysis was obtained with a minimum volume of 150 μl using standard racks and 80 μl using limited sample racks specified for optimal sampling.
Fibrin Clot Detection
We found that for a ratio exceeding 1.4 units NIH thrombin to 0.7 ml plasma, samples were systematically flagged "clot detection" and no result was reported. Below this ratio, samples were analyzed and results were comparable to the control nonclotted sample.
Practicability and Daily Typical Workload
A typical, 1‐day laboratory workload run on Vista® allowed us to confirm the time required per test specified by the manufacturer (Table 6). Moreover, mean TAT for all samples (including some or all of the parameters depicted in Table 6 was 12 min (range [3–20]). We also confirmed in routine use, the efficiency of automatic dilution of out‐of‐range assay results, auto‐verification of results according to user‐configured rules, and clot and sample‐volume detection. Thanks to onboard sample aliquoting, sample loading and discharge were fast and add‐on/rerun tests were performed efficiently in less than 2 hr.
Table 6.
Mean Analytical Time of Dimension Vista® Tests Calculated During a Typical 1‐day Workload at the Bichat Hospital Laboratory
| Method | Number of tests performed | Time (min) |
|---|---|---|
| Sodium | 358 | 0.35 |
| Potassium | 360 | 0.35 |
| Chloride | 356 | 0.35 |
| Calcium | 104 | 1.68 |
| Creatinine | 365 | 1.68 |
| Magnesium | 16 | 2.16 |
| GGT | 133 | 2.4 |
| Urinary proteins | 28 | 2.46 |
| Glucose | 153 | 2.82 |
| LDH | 54 | 2.88 |
| Albumin | 146 | 3.06 |
| Urea | 305 | 3.06 |
| Lipase | 26 | 3.78 |
| Amylase | 16 | 3.84 |
| Uric acid | 31 | 5.34 |
| CK | 63 | 5.4 |
| CRP | 75 | 5.4 |
| ALT | 185 | 5.82 |
| ALP | 130 | 6.06 |
| AST | 186 | 6.06 |
| Phosphorus | 96 | 6.36 |
| Total protein | 323 | 7.92 |
| Total bilirubin | 133 | 7.98 |
| Lactic acid | 7 | 9.42 |
| βHCG | 2 | 10.8 |
| cTnI | 24 | 10.8 |
| Nt‐proBNP | 4 | 10.8 |
| Total | 3,679 |
We verified that a variety of samples (urine, CSF, blood), tubes (5 or 7 ml), and cups could be mixed on sample racks and that, through camera detection, a red sticky alerted the user in case of capped tubes, preventing sample probe crash, and allowing the system to continue sampling of unaffected tubes. We also confirmed the ability of Vista® to efficiently manage STAT assay requests using the STAT input lane during routine workload. Further, we appreciated the easy access to sample status and real‐time results via the touch‐screen user interface.
The installation of Vista® in our laboratory required no special conditions except air conditioning. Water and waste treatment were integrated and managed by Vista®. During this evaluation, we appreciated the practicability and ergonomics of Vista® software and the ease of training and use for technicians.
We confirmed that all buffers and reagents, either ready to use or hydrated automatically, could be loaded on four modules without pausing operation. However, in our experience, flex hydration is time consuming and could influence TAT. Therefore, flex hydration had to be incorporated in the nightly activities and not during daytime. Prepackaged, single Flex® cartridges (20 to 1,200 tests) with long stability fit well with our workflow. QC, reagent, and calibrator loading were easy to perform thanks to a continual monitoring of the onboard inventory by the system. We confirmed that onboard storage of ready‐to‐use, bar‐coded QC and calibrators allowed automatic calibration and QC analysis at scheduled times, greatly simplifying our laboratory tasks. Calibrations were automatically validated according to laboratory‐defined criteria.
The touch‐screen user interface and operating software included with the Vista® provide easy access to the four modules’ requirements, troubleshooting, and diagnostic. Thanks to user‐designed panels and easy patient identification, we were able to order tests efficiently without being connected to the laboratory informatics system.
Throughout this evaluation, we appreciated the complete traceability of system and patient data (including HIL interference and nonreported out‐of‐range results) through the Vista® and Easylink® software.
Except the daily electronic probe test and flex hydratation, Vista® was always ready, with no start‐up delay. The printed operator's guide and electronic multimedia instructions provided on EasyLink™ and the Siemens Healthcare Diagnostics website proved to be helpful, clear, and relatively easy to use. After authorization by the operator, Siemens Healthcare Diagnostics technicians used the remote‐access capability of the EasyLink™ Data Management System to perform assay troubleshooting (including mechanical actions, diagnostic tests, and file loading), monitor system performance, and proactively detect needs.
DISCUSSION
In routine conditions, Vista® within‐run and between‐run imprecisions were good for most parameters. CVs were higher but near the acceptable limit within‐run for urea and between‐run for chloride, total CO2, direct bilirubin, low creatinine, and AST levels. Imprecision observed at low creatinine and AST levels indicated insufficient homogenization of these tests at high sample volumes (13.33 μl for AST), an issue that has since been corrected by the manufacturer.
We confirmed the upper limit of the linearity range specified by the manufacturer for all parameters evaluated. The large analytical ranges verified for AST, ALT, total protein, creatinine, glucose, bilirubin, CRP, βHCG, NT‐proBNP, and ferritin allowed analysis without manual dilution in most pathological situations, thus increasing laboratory safety and efficiency. By contrast, for cTnI, manual dilution was frequent in agreement with our hospital population. Vista® does not allow low urine Ca concentrations to be reported. This should be improved since this does not meet our local clinical requirements.
The large linearity of total protein assay (3.9 to 107 g/l) allowed protein analysis in most body fluids. No hook effect was evidenced during this evaluation with βHCG, cTnI, Nt‐proBNP, and ferritin. However, no sample reached the concentrations claimed by the manufacturer for βHCG (>1,000,000 IU/l), cTnI (> 1,000 ng/ml), and ferritin (> 250,000ng/ml). For Nt‐proBNP, we could verify that concentrations far higher than the 400,000 pg/ml claimed by the manufacturer produced no hook effect.
Analytic performance of the LOCI and nephelometric systems (hsCRP and cTnI) was exceptionally good. We found a functional sensitivity for cTnI and a LOD for hsCRP better than those provided by the manufacturer (0.040 ng/ml and 0.16 mg/l for cTnI and hsCRP, respectively). Furthermore, we found a mean CV of 4.97% ± 4.43% for duplicate analysis of patient samples with cTnI concentrations below 0.150 ng/ml (0.078 ± 0.030 ng/ml, range [0.045–0.148], n = 33 patients), confirming thus the performance of LOCI for the determination of low values in routine practice (data not shown). Between‐run cTnI functional sensitivity determined according to Panteghini recommendations 5 was 0.03 ng/ml, in agreement with that of 0.036 ng/ml found by Arrebola et al. 11. Thus, LOCI technology enables an imprecision level (CV) for cTnI below 10% at the 99th percentile of the reference population (0.045 ng/ml as determined by the manufacturer) corresponding to the clinical decision threshold of myocardial injury, according to the recommendations of the Joint European Society of Cardiology/American College of Cardiology Committee for the redefinition of myocardial infarction 12. Therefore, this new generation of Siemens cTnI assay must be considered as a sensitive assay. However, this assay does not allow to measure cTnI in most of plasma from a reference population and does not meet the definition of a highly sensitive assay as proposed recently by Apple and Collinson 13. Although it has been recently investigated in hospitalized patients by Kelley et al. 14, the clinical performance and benefits of this “sensitive cTnI” assay need to be further investigated.
Vista® results correlated well with those of the comparison instruments. Good comparability was observed for most chemistry methods, nephelometry, and LOCI immunoanalysis methods. Imprecision was observed at low ALT values. The proportional difference detected for amylase, GGT, LDH, lipase, and ALP was probably related to the absence of standardization of these methods to IFCC reference method. The difference observed between MODULAR® and Vista® in plasma bilirubin and albumin can be related to the absence of calibrator values standardization. For cTnI and NT‐proBNP, no standardization is currently available. Thus the comparison was only possible with a method that uses the same couple of capture and detection antibodies, i.e., the Dimension RXL® method.
We confirmed the interferences and the level of interfering substances described by the manufacturer. The influence of interfering substances was moderate for chemistry methods. For nephelometry and LOCI methods, TG over 5.7 mmol/l was the only interference with hsCRP; no interference was found with Nt‐proBNP. In agreement with other studies 15, 16, we found a negative interference of Hb > 310 μmol/l toward cTnI. This interference is especially important to notice, since it has not been identified by the manufacturer and in the study of Arrebola et al. 11 and can lead to erroneous results. The interference of haemolysis is complex since it can sum up both a negative and a positive interference, the latter being related to cytolysis membrane fragments 17. We also confirmed the ability of Vista® to flag or suppress results of interference‐affected analytes (i.e., interference exceeding 10%) according to HIL indices configured by the manufacturer. However, HIL evaluation deserves further improvement since icteric samples with I index ≥3 altered H measurement, and false‐positive hemolysis was reported. Similarly, turbidity with L index ≥5 altered both H and I index measurements, and false‐positive hemolysis and icterus were reported. Consequently, any plasma with I ≥ 3 or L ≥ 5 associated with hemolysis should be visually checked that can have a dramatic influence on TAT and laboratory organization.
The absence of sample‐related carryover confirmed the efficiency of probe cleaning (aliquotter probe and sample probes for all modules), allowing the mix of urine and plasma analysis in routine operation.
We confirmed the efficiency of insufficient sample‐volume detection and of clot detection, both for primary sample and onboard aliquots, which makes Vista® suitable for pediatric purposes in secure conditions. A complete BMP analysis was obtained without any warning message and erroneous result with 150 μl using cups on standard racks and 80 μl using cups on limited sample racks specified for optimal sampling. However, caution must be taken since sample detection is not available on these racks and if less than the required volume is provided, erroneous results were reported without any warning. The Siemens protocol for working with these racks requires a check of the total sample volume by the operator before putting the sample on the instrument and a minimal 200 μl is recommended in the “Surplus sample” configuration. However, in our routine, we analyzed too few pediatric samples to evaluate the impact of this additional and "manual" step on sample throughput and TAT.
For a typical, 1‐day laboratory workload, we could not achieve the throughput of 1,500 tests/hr claimed by the manufacturer because the analyzer was not maximally loaded with tests for all four modules. However, Vista® proved able to efficiently handle the entire workload of a typical day in our hospital laboratory, combining both emergency and specialized analysis. The automatic dilutions were very convenient, time saving, and well adapted in routine practice for most parameters, especially for enzymes. We confirmed the turnaround times specified by the manufacturer. The 10.8 min to obtain a cTnI is especially important to provide rapid patient triage in an emergency hospital. One consequence of the high throughput and integration of four technologies is the analyzer's relatively high output of noise and heat. However, the instrument's performance was studied in the best conditions. The impact of the daily workload, limited sample racks (pediatric samples), maintenances, flex hydration on the instrument's performance was not studied. Flex hydration is time consuming and electronic probe check that now requires around 45 min should be programmed during reduced activities.
Vista® was easy to install and use in routine, emergency, and degenerated conditions when Laboratory Information System is down, operating 24 hr a day with no delay at start‐up. During this evaluation, we confirmed the analyzer's excellent practicability, functionality, ease to use of software, and security when used in both a routine and emergency laboratory. Onboard calibrators and QC and the short maintenance reduced daily manipulation and fit especially well into the 24‐hr‐a‐day operation of our emergency biochemistry laboratory. In our experience, Vista® is prone to relatively frequent cuvette and rack blockage, easily solvable by technicians and with low impact on laboratory performance. However, Vista® needs regular maintenance by Siemens in order to prevent serious defects such as in our experience belt rupture, pump leakage, probe plugging. Except the probe test, daily maintenance of the system does not interfere the TAT because it does not require to stop the system (empty waste, load required reagents and supplies, cleaning surface). Manufacturer's maintenance is longer (2–4 hr) and can significantly alter TAT, needing to be agreed with the company in order to minimally interfere with the daily workload.
Vista® and Easylink® software fully complies with data traceability requirements, especially important for accreditation of laboratories in France. Biologists may regret that reaction curves are not easily accessible; further, Easylink® QC configuration and daily management needs to be improved.
The flexibility of Vista® could not be evaluated because chemistry and nephelometry open channels were not yet available. Later, we adapted an enzymatic creatinine reagent and verified that methodology adaptation was easily accessible.
In conclusion, we confirmed the analytical performance and practicability of Dimension Vista® are highly suitable for routine use as well as emergency and pediatric samples in secure conditions if special caution is taken for working with limited sample racks. Moreover, Vista® allows laboratories to consolidate workstations and eliminate sample splitting, while being available at any time for emergencies.
ACKNOWLEDGMENTS
The authors especially want to thank Christian Audy and Claire Bouvet from Siemens for their excellent support. This study was supported by Siemens Healthcare Diagnostics. To ensure against a potential conflict of interest, the company was in no way involved in the analysis and interpretation of data.
The authors have no conflict of interest to declare.
Grant sponsor: Siemens Healthcare Diagnostics.
REFERENCES
- 1. Ullman EF, Kirakossian H, Switchenko AC, et al. Luminescent oxygen channeling assay (LOCI): Sensitive, broadly applicable homogeneous immunoassay method. Clin Chem 1996;42:1518–1526. [PubMed] [Google Scholar]
- 2. Vassault A, Azzedine M, Bailly M, et al. Commission for validation of methods. French society of clinical biology. Protocole de validation de techniques (Documents A‐B‐C, stade 3). Ann Biol Clin (Paris) 1986;44:679–755. [PubMed] [Google Scholar]
- 3. Capolaghi B, Vassault A, Grafmeyer D, Yvert J. Le protocole Valtec: Évolution du concept et du contenu. Ann Biol Clin (Paris) 1997;55:167–173. [Google Scholar]
- 4. Vassault A, Grafmeyer D, de Graeve J, Cohen R, Beaudonnet A, Bienvenu J. Quality specifications and allowable standards for validation of methods used in clinical biochemistry. Ann Biol Clin (Paris) 1999;57:685–695. [PubMed] [Google Scholar]
- 5. Panteghini M, Pagani F, Yeo KT, et al. Evaluation of imprecision for cardiac troponin assays at low‐range concentrations. Clin Chem 2004;50:327–332. [DOI] [PubMed] [Google Scholar]
- 6. Horowitz GL, Zaman Z, Blanckaert NJ, et al. Modular analytics: A new approach to automation in the clinical laboratory. J Autom Methods Manag Chem 2005;2005:8–25. [DOI] [PMC free article] [PubMed] [Google Scholar]
- 7. Glick MR, Ryder KW, Jackson SA. Graphical comparisons of interferences in clinical chemistry instrumentation. Clin Chem 1986;32:470–475. [PubMed] [Google Scholar]
- 8. Ben Naoui N, Periou C, Harault C, Le Moel G. Evaluation of the Technicon Dax 48: A multiparametric biochemical analyzer. Ann Biol Clin (Paris) 1993;51:713–720. [PubMed] [Google Scholar]
- 9. Beneteau‐Burnat B, Pernet P, Pilon A, et al. Evaluation of the GEM Premier 4000: A compact blood gas CO‐Oximeter and electrolyte analyzer for point‐of‐care and laboratory testing. Clin Chem Lab Med 2008;46:271–279. [DOI] [PubMed] [Google Scholar]
- 10. Benoit MO, Dautezac F, Taccoen M, Paul JL. Evaluation of the analytical performance characteristics of NT‐proBNP immunoassay on dimension RxL‐HM (Dade Behring). Ann Biol Clin (Paris) 2005;63:411–416. [PubMed] [Google Scholar]
- 11. Arrebola MM, Lillo JA, Diez De Los Rios MJ, et al. Analytical performance of a sensitive assay for cardiac troponin I with loci technology. Clin Biochem 2010;43:998–1002. [DOI] [PubMed] [Google Scholar]
- 12. Alpert JS, Thygesen K, Antman E, Bassand JP. Myocardial infarction redefined—a consensus document of The Joint European Society of Cardiology/American College of Cardiology Committee for the redefinition of myocardial infarction. J Am Coll Cardiol 2000;36:959–969. [DOI] [PubMed] [Google Scholar]
- 13. Apple FS, Collinson PO. Analytical characteristics of high‐sensitivity cardiac troponin assays. Clin Chem 2012;58(1):54–61. [DOI] [PubMed] [Google Scholar]
- 14. Kelley WE, Lockwood CM, Cervelli DR, et al. Cardiovascular disease testing on the Dimension Vista system: Biomarkers of acute coronary syndromes. Clin Biochem 2009;42:1444–1451. [DOI] [PubMed] [Google Scholar]
- 15. Bais R. The effect of sample hemolysis on cardiac troponin I and T assays. Clin Chem 2010;56:1357–1359. [DOI] [PubMed] [Google Scholar]
- 16. Florkowski C, Wallace J, Walmsley T, George P. The effect of hemolysis on current troponin assays–a confounding preanalytical variable? Clin Chem 2010;56:1195–1197. [DOI] [PubMed] [Google Scholar]
- 17. Sodi R, Darn SM, Davison AS, Stott A, Shenkin A. Mechanism of interference by haemolysis in the cardiac troponin T immunoassay. Ann Clin Biochem 2006;43:49–56. [DOI] [PubMed] [Google Scholar]