Abstract
Purpose
To create hybrid three-dimensional (3D) models of the choroidal vasculature from swept-source optical coherence tomography (SS-OCT) angiography images and to evaluate the model's characteristics.
Methods
This study used prospective, noncomparative case series, including 21 eyes of 21 healthy individuals. The 6 × 6-mm macular area was imaged repeatedly to obtain two cube image sets. Images from structural OCT (OCT-S) and OCT angiography (OCT-A) were exported. After vessel-like structures segmentation from the inverted black and white OCT-S images and the OCT-A images, both types of images were reconstructed in a 3D model. The volumes of the outer choroid and the choroidal vessels were measured after thresholding. The similarities of the segmented choroidal vessels (between OCT-S and OCT-A) and between repeatedly acquired images were measured.
Results
Mean vessel volume was 2.227 mm3 (29% of the outer choroidal volume) in OCT-S and 0.848 (11%) in OCT-A when measured after removal of the choriocapillaris equivalent volume. Three percent of the vessel volume in OCT-S and 8.4% of that in OCT-A overlapped. The Dice similarity coefficient of vessel volumes in repeated images from the same individual was 0.863 in OCT-S and 0.485 in OCT-A. The ratio of vessel volume to the outer choroidal volume was invariant in OCT-S but increased in OCT-A in the eyes with long axial length.
Conclusions
Hybrid 3D vascular models of the choroidal vasculature were reconstructed from OCT-S and OCT-A. The new models should prove useful for volumetric analysis of the choroid.
Translational Relevance
Hybrid 3D models of the choroidal vasculature enable volumetric analysis and facilitate morphologic evaluation.
Keywords: OCT angiography, choroid, three-dimensional, computational modeling, volumetrics
Introduction
The choroid is a membranous vascular tissue between the retina and sclera, the main function of which is to supply oxygen and nutrients to the photoreceptor cells.1,2 For this purpose, the choroid has a unique structure, with the choriocapillaris and an underlying thick blood vessel layer, that is, Sattler's layer and Haller's layer.3 Previous reports have suggested that disorders of the choroidal vasculature may be associated with macular diseases, such as age-related macular degeneration (AMD),4,5 central serous chorioretinopathy,6,7 and acute multifocal placoid pigment epitheliopathy.8 Morphologic evaluation of the choroid may help to elucidate the pathology of these diseases.
In a clinical setting, choroidal vasculature is evaluated by indocyanine green angiography (ICGA) or optical coherence tomography (OCT), especially by using enhanced-depth technology9 or swept-source (SS) OCT.10 Choroidal thickness measurements,11,12 thresholding,13,14 and morphologic segmentation15 of sectional images or en face images have been proposed to evaluate the choroidal vasculature. These studies have helped to reveal the pathogenesis of choroidal diseases. However, it may be difficult to analyze the course of a vessel or the attenuation of a vessel lumen in the choroid in two-dimensional (2D) images. To resolve these issues, we attempted to make a three-dimensional (3D) model of the choroidal vasculature. Previous reports visualized vessel-like structures with low signal intensity as blood vessels in structural OCT (OCT-S) scans using spectral domain (SD) OCT15,16 or SS-OCT.17,18 While moderate- to large-size vessels can be visualized in that way, the corresponding visualization of small vessels is not sufficient.15,19–21 OCT angiography (OCT-A) can delineate with high signal intensity the choriocapillaris and the part of the vessels with moderate diameter, but OCT-A cannot depict large vessels deep in the choroidal tissue.22,23 Hybrid views of the choroidal vessels, consisting of the vessels in OCT-A and the vessels in OCT-S, would delineate choroidal vessels with a wide range of diameters. To the best of our knowledge, a hybrid 3D model of the choroidal vasculature has not been reported. We created a hybrid 3D model of the choroidal vasculature from OCT-A and OCT-S images and evaluated the volumetric characteristics of the model.
The aim of this study was to visualize a 3D choroidal vasculature image by combining images from OCT-S and OCT-A (a hybrid 3D model) and to evaluate the characteristics of the model.
Methods
This prospective, noncomparative case series was approved by the Institutional Ethics Committee of the Fukushima Medical University and conducted in accordance with the tenets of the Declaration of Helsinki.
Overview
Figure 1 shows the workflow for vessel segmentation. The images were acquired using an SS-OCT (PLEX Elite 9000; Carl Zeiss Meditec, Dublin, CA). The 6 × 6-mm2 images of OCT-S and OCT-A were exported separately as stack images. The OCT-S images were inverted between black and white. After the vessel images in the OCT-A images and the inverted OCT-S images were enhanced and segmented, each image stack was visualized in 3D using “3D slicer” software, which is an open-source software platform for biomedical research (ver. 4.10; https://www.slicer.org/).18 The volumes of the outer choroid and the choroidal vessels were measured in this 3D model. The similarities between the segmented choroidal vessels in OCT-S and OCT-A and between repeated images were measured. The clinical applicability was evaluated in a case of neovascular AMD (nAMD).
Figure 1.
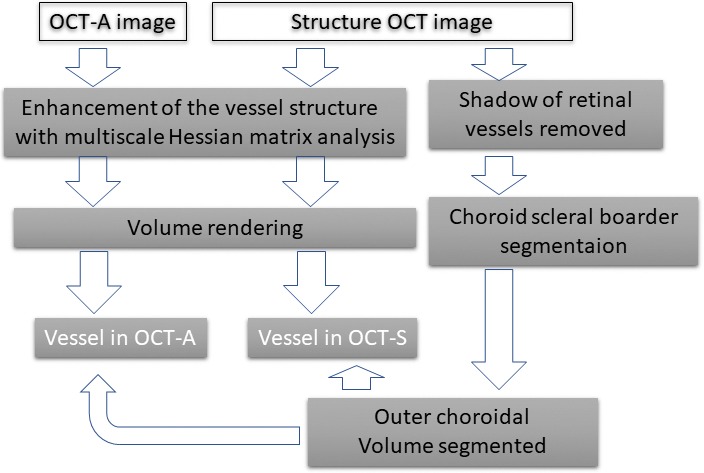
Scheme of the image processing.
Control Subjects and a Patient with nAMD
Twenty-one healthy individuals, older than 18 years and with no history of ophthalmologic or systemic diseases, were recruited by advertising and were included in this prospective study after providing written informed consent. We examined one eye of each of these control individuals, based on their individual preference. Participants were required to have a normal ocular examination and a normal OCT-S of the macula. A history of any ocular surgery was an exclusion criterion.
We selected one nAMD patient who underwent ICGA, OCT-A, and OCT-S on the same day at the out-patient department of our hospital (Fukushima Medical University Hospital) to compare the choroidal vasculature between the angiographic images and hybrid 3D models. Comprehensive ophthalmologic examinations with mydriatics established his diagnosis of nAMD. The patient also gave informed consent for the retrospective analysis of his OCT-A data.
Image Acquisition
Using SS-OCT, 6 × 6-mm OCT-S and OCT-A images of the healthy eyes were acquired repeatedly in one session between November 1 and December 24, 2018, after application of mydriatics (5 mg/mL tropicamide and 5 mg/mL phenylephrine sodium chloride; Santen Pharmaceutical Co. Ltd., Osaka, Japan). The SS-OCT instrument has a central wavelength of 1060 nm, a bandwidth of 100 nm, A-scan depth of 3.0 mm in tissue, full-width (at half-maximal axial resolution) of about 5 μm in tissue, and lateral resolution at the retinal surface of about 20 μm. The FastTrac motion-correction software that is built into the SS-OCT-A was used during image acquisition. The OCT-A images were taken within 15 seconds. ICGA was performed with a retina angiograph (Heidelberg Retina Angiograph 2 [HRA2]; Heidelberg Engineering, Heidelberg, Germany) after application of mydriatics (as described above).
Image Processing
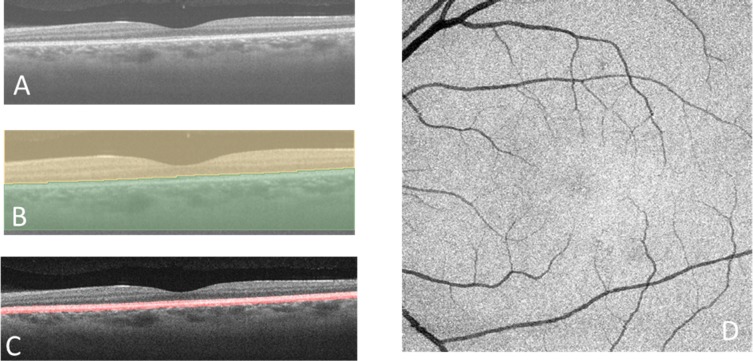
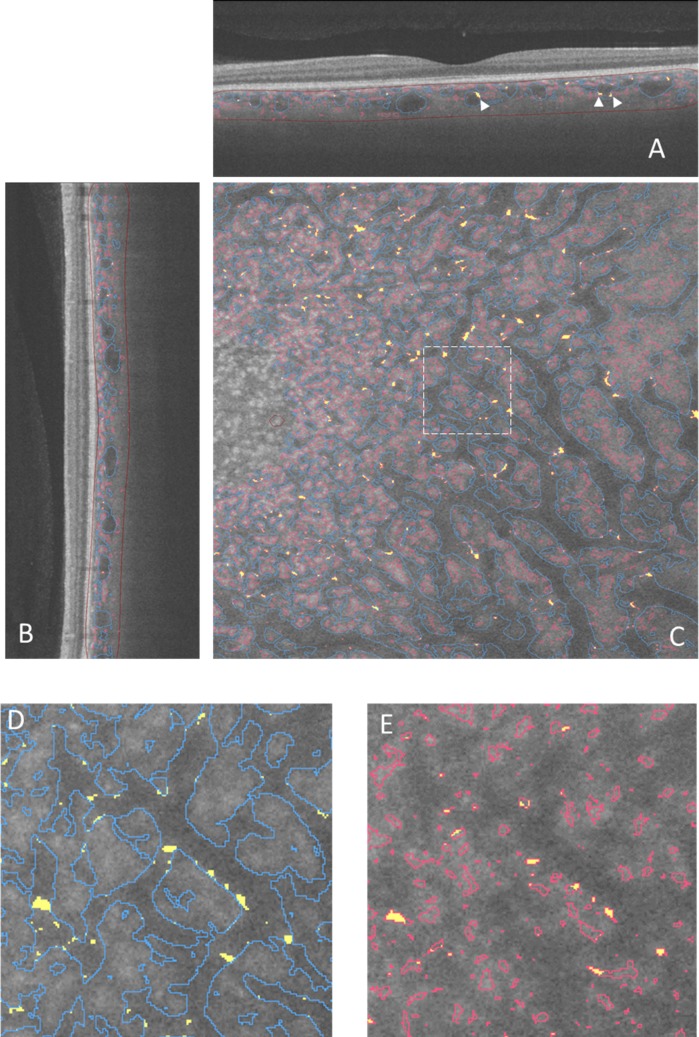
The OCT-S and OCT-A images (500 × 1536 × 500 pixels, width × depth × height), corresponding to 6 × 3 × 6 mm in physical volume, were exported from the OCT machine and rescaled to isometric voxel images. After normalization of the image, the choroidal vessels in the inverted OCT-S image were segmented following the method previously reported for 3D choroidal vessel segmentation in SD-OCT.15 Retinal vessel silhouette in the choroid was removed before segmentation. At first, the line representing the retinal pigment epithelium (RPE) surface was detected using the grow-cut module of 3D slicer (Fig. 2B).19 The RPE complex (from the surface of the RPE to 5 pixels [60 μm] beneath the RPE) was segmented by translation of the RPE surface line (Fig. 2C). In practice, we first detected the line corresponding to the RPE surface. We made a copy of the RPE surface line and placed that at 5 pixels under the Bruch's membrane and then removed the area between the two lines as the RPE complex. A maximum intensity projection image of the RPE complex along the z-axis, which contained the silhouette image of the retinal vessels, was made (Fig. 2D). The retinal vessel shadows in OCT-S volume images were adjusted after masking outside the silhouette image. The remaining volume of the choroidal tissue, after removal of the RPE complex, was defined as the outer choroidal volume. The preprocessed OCT-S and OCT-A images were enhanced by a multiscale Hessian matrix analysis.15,20–22 The OCT-A images were not preprocessed to remove the retinal vessel images because retinal vessel shadows appeared as negative images in the choroid in OCT-A. The images were rendered in 3D using 3D slicer. The choroid-scleral border was delineated manually: briefly, about 100 markup points were placed at the choroid-scleral junction on the image of the outer choroidal volume, and a spline surface model was made. The outer choroidal volume was segmented with the volume-clipping module in 3D slicer. The overlay of the segmented vessels in OCT-A (red lines) and OCT-S (blue lines) was placed on the structure image from OCT-S. Yellow segments indicate the intersection of the vessels in OCT-A and OCT-S (Fig. 3).
Figure 2.
Segmentation of the RPE complex and removal of the retinal vessel shadow. (A) Horizontal scan from the SS-OCT. (B) Segmentation using the grow-cut module in the 3D slicer software. The brown area indicates the side containing the sensory retina, and the green area indicates the side containing the RPE and choroid. There is a segmented line along the surface of the RPE. (C) The RPE complex (red outline) extends between the line on the surface of the RPE and the line 5 pixels (about 60 μm) beneath the RPE. (D) A maximum intensity Z-projection image of the RPE complex.
Figure 3.
Vessel segmentation in an image slice. The vessel images are overlaid on a slice from OCT-S. The red line in each panel shows the vessels detected on OCT-A, and the blue lines show the vessels detected on OCT-S. Yellow areas show overlap of the vessel made by OCT-A and OCT-S. (A) Horizontal slice. Arrowheads indicate the intersection between the vessels in OCT-A and OCT-S. (B) Vertical slice. (C) En face slice. A dashed line rectangle showed the area magnified in (D) and (E). The partial overlap between the small vessels and the large vessel appeared at the border of the large vessels. The brown lines in (A) and (B) outline the outer choroidal volume.
The shape and volume of the blood vessel after segmentation depend on the threshold in 8-bit grayscale value when thresholding. In the current study, we applied the fixed 35 for thresholding after normalization of the images for convenience for segmentation of the scalar volume of the vessel image. The outer choroidal volume, the vessel volume in OCT-S, the vessel volume in OCT-A, and the volume of intersection between the two types of vessel images were calculated with the segment statistics module in 3D slicer. The two images taken repeatedly were registered at the center of the macula by inspection using the whole volume of the OCT-S. We made the registration model using translation and B-spline methods in the transform menu of 3D slicer. A Dice similarity coefficient (DSC) was measured with the segment comparison tool in 3D slicer. Similarity, the 3D models were evaluated with a DSC between the repeated images per subject. DSC of two volumes, A and B, was calculated as
 |
To compare the two images in each subject, the images were registered by linear translation and B-spline translation. Finally, a 450 × 450-pixel image, centered at the fovea in an en face image, was cropped for the measurement.
The 3D image reconstructed from OCT-S and OCT-A was compared to fluorescein angiography (FA) and ICGA in the patient with nAMD. Dye angiography was performed using the HRA2.
Statistical Analysis
The correlations between the axial length and the volume of the choroid or the choroidal vessel were analyzed using the Pearson correlation coefficient. P values of 5% or lower were considered to be statistically significant.
Results
The mean age of the healthy individuals was 28 ± 4.3 years (mean ± standard deviation). The mean refractive spherical equivalent was −1.23 ± 1.17 diopters (range, −7.6 to 0.6). The mean axial length was 24.6 ± 1.02 mm (range, 22.79–26.47).
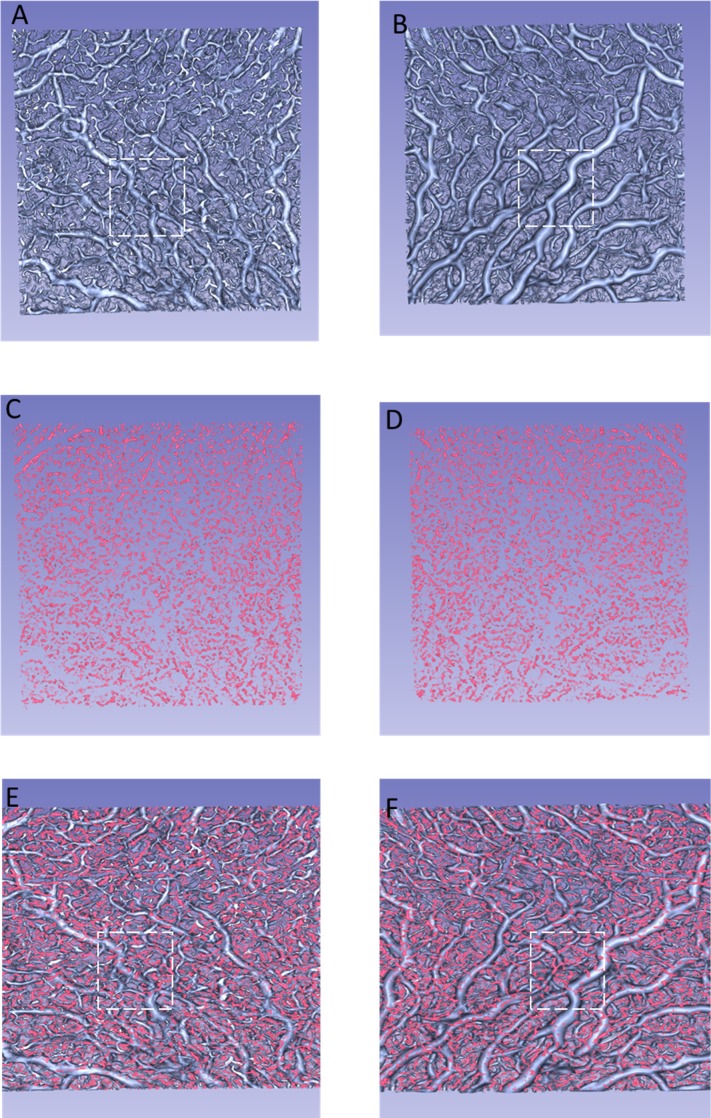
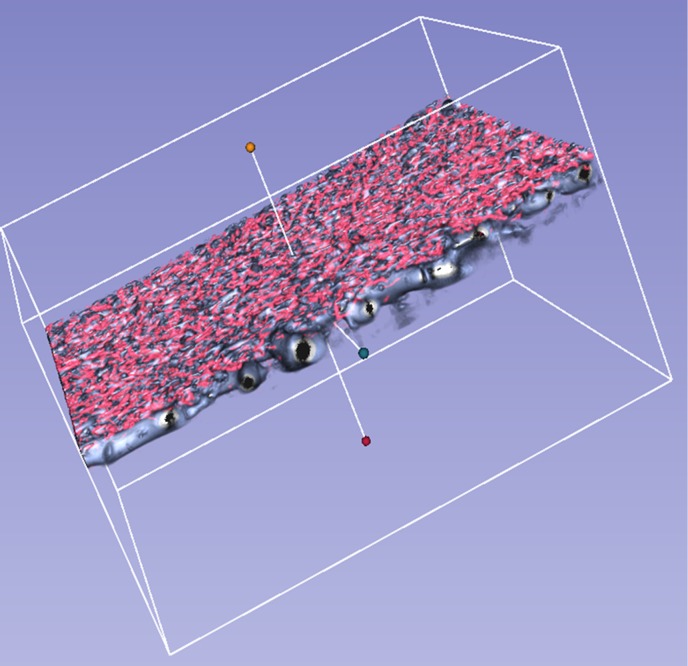
The choroidal vessels were successfully segmented and visualized in 3D in all 21 eyes. We could observe the choroidal vasculature from the inside (vitreous view, Figs. 4A, C, E) or the outside (scleral view, Figs. 4B, D, F) of the eye. Figures 4A and B show the choroidal vessels in OCT-S. Figures 4C and D show the choroidal vessels in OCT-A. Figures 4E and F are the combined images from panels A and C, B and D, respectively. Branching vessels from the large vessels appeared more frequently in the vitreous view than in the scleral view in OCT-S (Figs. 4A and D). The small vessels in OCT-A images were also distributed near the Bruch's membrane (dashed-line square in Figs. 4A and E). Some of the small vessels in OCT-A seemed to sprout from the large vessels in OCT-S or to be part of small vessels that were delineated in OCT-S (Figs. 4C and F). Figure 5 is a reconstructed 3D image based on the images in Figure 4. Some of the structures visualized in OCT-A seemed to be fragments that did not connect to the vessel structure (Fig. 5).
Figure 4.
Reconstructed 3D images of the choroidal vasculature of the left eye of a 25-year-old woman. (A) Vessels in OCT-S, viewed from the vitreous side. (B) Vessels in OCT-S, viewed from the scleral side. (C) Vessels in OCT-A, viewed from the vitreous side. (D) Vessels in OCT-A, viewed from the scleral side. (E) An image combining (A) and (C). (F) An image combining (B) and (D). The dashed lines in (A, B, E, F) mark the same region of the choroid. Branching vessels appear more frequently in (A) than in (B). More vessels delineated by OCT-A can be seen in (E) than in (F).
Figure 5.
Three-dimensional view of the choroidal vasculature illustrated in Figure 4, as viewed diagonally from above.
The mean outer choroidal volume in the 5.4 × 5.4-mm2 square at the fovea was 7.502 ± 0.973 mm3 (range, 5.536–9.250). The mean vessel volume was 2.227 mm3 (29% of the outer choroidal volume) in OCT-S and 0.848 (11%) in OCT-A (Table 1). These results were calculated after subtracting the RPE complex. The total volume of vascular structure in the choroid was 3.005 mm3, which corresponded to 40% of the outer choroidal volume. Most of the overlapping segments of the vessels in OCT-S and OCT-A appeared as small segments on the walls of the large vessels (Fig. 3). Some of the overlapping segments seemed to connect the vessels in OCT-A. The mean volume of the overlapping vascular structures in OCT-S and OCT-A was 0.065 mm3 (2.2% of the total vascular volume), which was 3.0% of the vessel volume in OCT-S and 8.4% of the vessel volume in OCT-A. The calculated DSC of the vessels between OCT-S and OCT-A images was 0.045 ± 0.015 in a total of 42 images (Table 2).
Table 1.
Volume of Each Segment
| Volume |
Mean, mm3 |
% |
SD |
Range |
| Vessel volume in OCT-S | 2.227 | 29 | 0.392 | 1.545–3.058 |
| Vessel volume in OCT-A | 0.848 | 11 | 0.159 | 0.513–1.266 |
| Vessel volume in OCT-S and OCT-A | 3.005 | 40 | 0.403 | 2.133–3.857 |
| Outer choroidal volume | 7.502 | 100 | 0.973 | 5.536–9.52 |
%, percentage to the outer choroidal volume. The data are the averages across the 21 control subjects. SD, standard deviation.
Table 2.
DSC Between the Repeated Images per Subject and Between the Vessel Volumes in OCT-S and OCT-A
| Volume |
N |
DSC |
||
| Mean |
SD |
Range |
||
| Outer choroidal volume | 21 | 0.994 | 0.009 | 0.967–1.000 |
| Vessel volume in OCT-S | 21 | 0.863 | 0.032 | 0.775–0.894 |
| Vessel volume in OCT-A | 21 | 0.485 | 0.073 | 0.283–0.565 |
| Total vessel volume | 21 | 0.781 | 0.036 | 0.679–0.832 |
| OCT-A vs. OCT-S | 42 | 0.045 | 0.015 | 0.023–0.095 |
N, number of images analyzed; SD, standard deviation.
The mean DSC between repeat images was 0.994 in the outer choroidal volume, 0.863 in the OCT-S vessel volume, 0.485 in the OCT-A vessel volume and 0.781 in the combination of these two types of volumes.
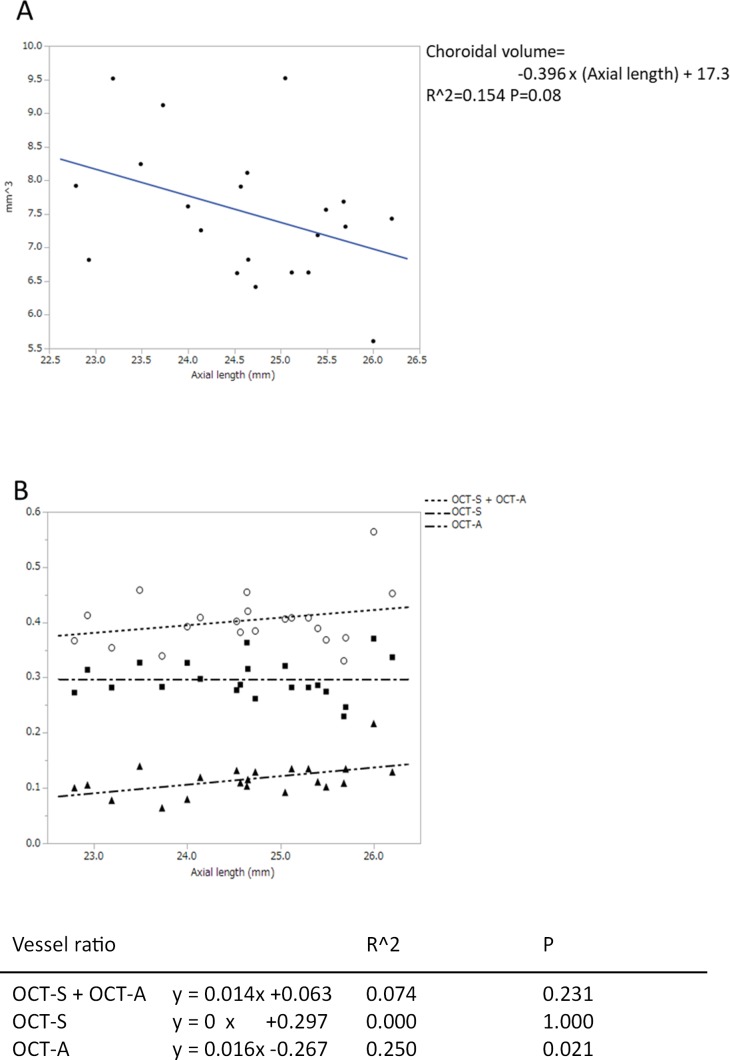
The outer choroidal volume tended to decrease in those eyes that had a long axial length, although the tendency did not reach statistical significance (P = 0.08; Fig. 6A). The ratio of the choroidal vessel volume in OCT-A to the outer choroidal volume significantly increased in eyes with a long axial length (P = 0.02). Conversely, the ratio of choroidal vessel volume in OCT-S (P = 1.000) and the ratio of the total choroidal vessel (P = 0.231) did not change (Fig. 6B).
Figure 6.
(A) The relationship between axial length and blood vessel volume in the outer choroidal volume. The outer choroid was defined as the choroidal tissue after the RPE complex was removed (see Fig. 2). Table shows the coefficients of the regressions. (B) The relationship between axial length (x-axis) and the ratio of the vessel volume to the outer choroidal volume (y-axis). Table shows the coefficients of the regressions.
Patient
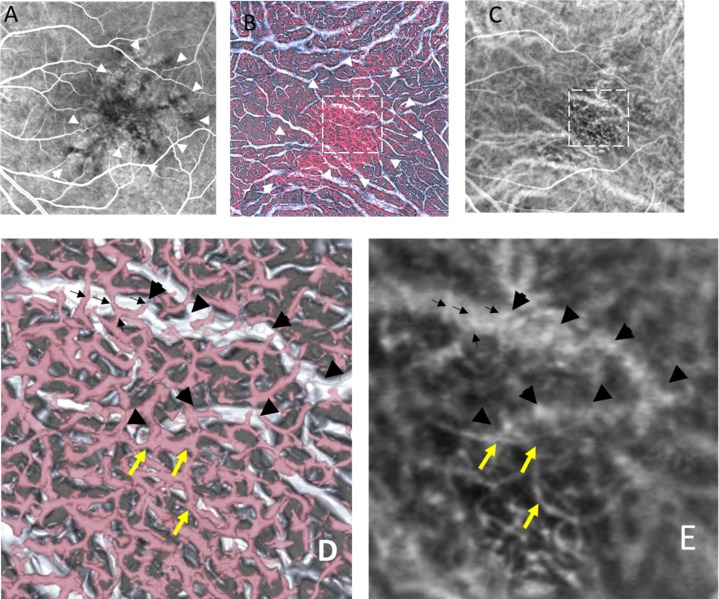
The patient was a 69-year-old man with nAMD in his left eye. He had received photodynamic therapy 3 years ago. He visited our clinic complaining of metamorphopsia. The best-corrected visual acuity in his left eye was 0.3 on the Japanese decimal visual acuity chart. His left eye showed a serous retinal detachment on OCT and an occult choroidal neovascular membrane on FA. Figure 7 shows FA, ICGA, and the hybrid 3D model. The RPE at the center of the fovea had become atrophic (Fig. 7A). The small vessels in OCT-A appeared with the well-identified network structure and were larger in diameter in the atrophic area of the RPE compared to that in the nonatrophic area. The small vessels in OCT-A seemed to be smaller in both diameter and number behind the healthy RPE compared to the area of atrophic RPE (Fig. 7B). A large vessel in the 3D model (Fig. 7D) with bifurcation running transversely can be identified in ICGA (Fig. 7E). The small vessels that run across the large vessel in the 3D model (Fig. 7D) correspond to the small vessels in ICGA (Fig. 7E). The abnormal vessels that appeared under the large vessel in ICGA (Fig. 7E) can be identified as the vessels running a similar course in OCT-A (Fig. 7D).
Figure 7.
Images from a 69-year-old man with neovascular age-related macular degeneration in his left eye. (A) FA. The center of the fovea showed dark granular hypofluorescence representing atrophy of the RPE (white arrowheads). (B) A vitreous view of the 3D model corresponding to (A) and (C). (C) ICGA: the frame at 17.14 seconds after dye injection. The white arrowheads in (B) correspond to those in (A). The area within the dashed square in (B) and (C) is magnified in panels (D) and (E). (D) Magnified view of (B). A large vessel with bifurcation runs transversely in OCT-S (black arrowheads). Small vessels in OCT-A run across the large vessel (black arrows). Choroidal neovascularization (yellow arrows). The small vessels in OCT-A and the large vessels in OCT-S correspond to the vessel on the magnified ICGA image (E).
Discussion
Hybrid 3D images of the choroidal vessels were reconstructed using SS-OCT images and then used to analyze the characteristics of the vascular structure. The ratio of the total vessel volume to the outer choroidal volume was 40%. The overlap in volumes between the vessels in OCT-S and in OCT-A was 3.0% in OCT-S and 8.4% in OCT-A. In the eyes with long axial length, the ratio of the vessel volume in OCT-S did not vary, whereas that in the OCT-A vessel volume increased. The similarity of vessel volumes in repeated images was high (0.863) in OCT-S and moderate (0.485) in OCT-A. The findings of the small and large vessels in ICGA seemed to correspond to hybrid 3D model of the patient with nAMD.
Circulatory changes in the choroid are associated with the normal and pathological functioning of the fovea. OCT has played a major role in elucidating the choroidal vasculature. Most of the analyses using OCT have been performed with cross-sectional images or en face 2D images. Analysis of the complicated choroidal vasculature on 2D images has been limited to discussing the course of the vessels and changes in vessel diameter. With 3D models of the choroidal vessels, it seemed to be feasible to analyze morphology of the choroidal vasculature and enable volumetric analysis. The entire vascular structure of the choroid should be identified for this purpose. Although several experimental approaches have been tried,23,24 successful use of OCT-A to visualize the whole vessel structure of the choroid has not been achieved. One of the reasons is the wide variation in blood flow in the choroidal vasculature. In a commercially available OCT-A machine, a choroidal blood vessel is presented as two types of images: a vessel with high intensity in OCT-A, which represents the actual blood flow in the vessel. However, the large vessels in the choroid could not be detected in OCT-A because OCT signals from deep choroidal vessels can have a low signal secondary to attenuation from optical scattering by overlying tissue. In addition, a valid OCT-A image cannot be obtained, and the image appears dark even if there is flow in the large vessels because there is little or no reflectivity or backscattering at the inner portion of large vessels in OCT images. Conversely, smaller choroidal vessels have greater OCT reflectivity or backscattering from within vessels, and the corresponding OCT-A signal is evident.23 The choroidal large vessels can be detected as a silhouette image of the vessel in OCT-S,15,19–21 which represents the morphologic structure of the blood vessel. We thought that a hybrid 3D model allowed morphologic analysis and volumetry in the choroidal vasculature. We attempted to make a hybrid model of choroidal vessels to visualize as much of the choroidal vasculature as possible.
The possibility of 3D analysis of the choroidal vasculature was previously proposed to be performed using SD-OCT.15,25 The reported vessel volume calculated using SD-OCT images was low (1.12 mm3/6 × 6 mm2 at the fovea)15 compared with the volume using SS-OCT images in the current study (2.227 mm3/5.4 × 5.4 mm2) using only OCT-S images. Improved image quality, due to high penetration and a high scanning rate in SS-OCT, might increase the vessel ratio in the current study. Moreover, the choroidal vessel volume increased by about 30% when the vessel volume information from OCT-A was added. The actual blood vessel volume may be larger than that measured in the current study because the vessel signals of the small vessels in OCT-A could be attenuated behind the RPE. The small vessels in OCT-A seemed to decrease in diameter and number behind the healthy RPE compared with the area of atrophic RPE in the nAMD case presented here (Fig. 7).
The small vessels in OCT-A surrounded the large choroidal vessels. Since the layer of vessels facing Bruch's membrane, across a width of 60 μm, was removed in this current 3D vascular model, most of the small vessels may have been precapillary arterioles, postcapillary venules, or shunt vessels in Sattler's layer. Branching vessels seemed to appear on the RPE side. To our knowledge, there have been no reports of studies using 2D OCT images that have suggested that vessels branching off of the choroidal vessels are more common on the RPE side. A 3D model may have an advantage in such a structural analysis. As attenuation of the scanning light may account for this observation, histologic information regarding this point is needed.
The thickness and volume of the choroid reportedly decrease with increasing axial length in normal individuals,26,27 but the structural changes of the choroidal vasculature in eyes with long axial length have not, to our knowledge, been discussed previously. In the present study, the ratio of the vessel volume to the outer choroidal volume in OCT-A images increased. The increasing vessel volume in OCT-A with ocular length may be attributed to an increasing proportion of the OCT signal penetration in the choroid in eyes with long axial length.25 In contrast to OCT-A, the ratio of the vessel volume in OCT-S and the total OCT-A and OCT-S vessel volume did not change significantly. We speculate that the narrow ranges in axial length and the small number of cases may have affected the results. Alternatively, there may be a mechanism keeping the ratio of blood vessels constantly in accordance with the choroidal thickness.
The similarity of the vessel volumes in OCT-A image pairs was not as high as that for the outer choroidal volume and the vessel volumes in OCT-S. The reduced resolution of OCT-A compared to OCT-S, due to the design principles of OCT-A and the scattering of scanning light under the RPE, can explain this result. The DSC is thought to decrease when comparing fine structures if blurring or distortion of objects occurs during image acquisition. Therefore, the small structure of the vessels in OCT-A may be attributed to the reduction of the DSC. Improvements in scanning speed and light strength could reduce blurring and distortion and potentially resolve this issue.
This study has several limitations. The first is that the volume of the choriocapillaris was removed. The vessel ratio to the total choroidal volume could not be measured, as the resolution of the OCT-A in 6 × 6 mm is insufficient to delineate the choriocapillaris. Another reason for the removal of the choriocapillaris from the model was that part of the projection artifact on the RPE affected the image of the choriocapillaris in the 3D images. However, visualization of the vessels under the choriocapillaris, which cannot be clearly visualized in 2D choroid slabs, still has advantages when investigating the choroidal vasculature. The second limitation is caused by the difference between the imaging sources. As the vessel in OCT-A shows the blood flow in the vessel, the ghost vessel may disappear in OCT-A. However, the vessel in OCT-S indicates the vessel structure itself, and thus the ghost vessel, can be seen. When we use hybrid models to evaluate a lesion containing vessels with slow blood flow, we should interpret the image carefully. Third, the vessels in OCT-A can contain the projection to the choroidal stroma. We cannot remove this artifact at this time. However, we can see that some of the small vessels connect to the choriocapillaris in the OCT-A sectional slice. The small vessels seemed to continue to the wall of the large vessel depicted in OCT-S in this study. These findings suggested that a portion of the apparent vessels in OCT-A are real vessels, not the projection on the stroma. Therefore, the vessel volumes from hybrid 3D models may overestimate the actual volume. Conversely, the previously reported 3D models of the choroidal vasculature may underestimate the volume. Fourth, the manual segmentation of the choroid-scleral border can affect the variance of the ratio of vessel volumes. Automated segmentation might improve the accuracy.19,28 Fifth, the number of healthy subjects tested to validate this exploratory research may not have been enough to estimate the normal control volume. In the future, we should measure choroidal vessel volume in a large number of subjects to derive the standard value. Finally, we did not compare the volume measured in this study to histologic samples. Histologic validation of this method is needed.
In conclusion, hybrid 3D models of the choroidal vasculature were reconstructed from the OCT-S and OCT-A images acquired with SS-OCT. Such 3D models could be beneficial for investigating the choroidal vessel structure and be aids to volumetric analysis. Hybrid 3D models could potentially contribute to the elucidation of choroidal pathology and the management of patients with choroidal diseases.
Acknowledgments
Disclosure: T. Sekiryu, Santen, Novartis, Byer (F); Y. Sugano, None; A. Ojima, None; T. Mori, None; M. Furuta, None; M. Okamoto, None; S. Eifuku, None
References
- 1.Flower RW. Physiology of the developing ocular vasculature. Birth defects. Orig Artic Ser. 1988;24:129–146. [PubMed] [Google Scholar]
- 2.Stefansson E. Oxygen and diabetic eye disease. Graefes Arch Clin Exp Ophthalmol. 1990;228:120–123. doi: 10.1007/BF00935719. [DOI] [PubMed] [Google Scholar]
- 3.Hogan MJ. Ultrastructure of the choroid. Its role in the pathogenesis of chorioretinal disease. Trans Pac Coast Otoophthalmol Soc Ann Meet. 1961;42:61–87. [PubMed] [Google Scholar]
- 4.Borrelli E, Uji A, Sarraf D, Sadda SR. Alterations in the choriocapillaris in intermediate age-related macular degeneration. Invest Ophthalmol Vis Sci. 2017;58:4792–4798. doi: 10.1167/iovs.17-22360. [DOI] [PubMed] [Google Scholar]
- 5.Pauleikhoff D, Spital G, Radermacher M, Brumm GA, Lommatzsch A, Bird AC. A fluorescein and indocyanine green angiographic study of choriocapillaris in age-related macular disease. Arch Ophthalmol. 1999;117:1353–1358. doi: 10.1001/archopht.117.10.1353. [DOI] [PubMed] [Google Scholar]
- 6.Piccolino FC, Borgia L. Central serous chorioretinopathy and indocyanine green angiography. Retina. 1994;14:231–242. doi: 10.1097/00006982-199414030-00008. [DOI] [PubMed] [Google Scholar]
- 7.Kitaya N, Nagaoka T, Hikichi T, et al. Features of abnormal choroidal circulation in central serous chorioretinopathy. Br J Ophthalmol. 2003;87:709–712. doi: 10.1136/bjo.87.6.709. [DOI] [PMC free article] [PubMed] [Google Scholar]
- 8.Deutman AF, Lion F. Choriocapillaris nonperfusion in acute multifocal placoid pigment epitheliopathy. Am J Ophthalmol. 1977;84:652–657. doi: 10.1016/0002-9394(77)90380-4. [DOI] [PubMed] [Google Scholar]
- 9.Spaide RF, Koizumi H, Pozzoni MC. Enhanced depth imaging spectral-domain optical coherence tomography. Am J Ophthalmol. 2008;146:496–500. doi: 10.1016/j.ajo.2008.05.032. [DOI] [PubMed] [Google Scholar]
- 10.Maruko I, Arakawa H, Koizumi H, Izumi R, Sunagawa H, Iida T. Age-dependent morphologic alterations in the outer retinal and choroidal thicknesses using swept source optical coherence tomography. PLoS One. 2016;11:e0159439. doi: 10.1371/journal.pone.0159439. [DOI] [PMC free article] [PubMed] [Google Scholar]
- 11.Maruko I, Iida T, Sugano Y, et al. Subfoveal choroidal thickness after treatment of Vogt-Koyanagi-Harada disease. Retina. 2011;31:510–517. doi: 10.1097/IAE.0b013e3181eef053. [DOI] [PubMed] [Google Scholar]
- 12.Sugano Y, Iida T, Maruko I, Ojima A, Sekiryu T. Choroidal thickness outside the laser irradiation area after photodynamic therapy in polypoidal choroidal vasculopathy. Jpn J Ophthalmol. 2013;57:294–300. doi: 10.1007/s10384-013-0230-3. [DOI] [PubMed] [Google Scholar]
- 13.Sonoda S, Sakamoto T, Yamashita T, et al. Choroidal structure in normal eyes and after photodynamic therapy determined by binarization of optical coherence tomographic images. Invest Ophthalmol Vis Sci. 2014;55:3893–3899. doi: 10.1167/iovs.14-14447. [DOI] [PubMed] [Google Scholar]
- 14.Agrawal R, Gupta P, Tan KA, Cheung CM, Wong TY, Cheng CY. Choroidal vascularity index as a measure of vascular status of the choroid: measurements in healthy eyes from a population-based study. Sci Rep. 2016;6:21090. doi: 10.1038/srep21090. [DOI] [PMC free article] [PubMed] [Google Scholar]
- 15.Zhang L, Lee K, Niemeijer M, Mullins RF, Sonka M, Abramoff MD. Automated segmentation of the choroid from clinical SD-OCT. Invest Ophthalmol Vis Sci. 2012;53:7510–7519. doi: 10.1167/iovs.12-10311. [DOI] [PMC free article] [PubMed] [Google Scholar]
- 16.Watanabe Y, Takahashi Y, Numazawa H. Graphics processing unit accelerated intensity-based optical coherence tomography angiography using differential frames with real-time motion correction. J Biomed Opt. 2014;19:021105. doi: 10.1117/1.JBO.19.2.021105. [DOI] [PubMed] [Google Scholar]
- 17.Jia Y, Wei E, Wang X, et al. Optical coherence tomography angiography of optic disc perfusion in glaucoma. Ophthalmology. 2014;121:1322–1332. doi: 10.1016/j.ophtha.2014.01.021. [DOI] [PMC free article] [PubMed] [Google Scholar]
- 18.Fedorov A, Beichel R, Kalpathy-Cramer J, et al. 3D Slicer as an image computing platform for the Quantitative Imaging Network. Magn Reson Imaging. 2012;30:1323–1341. doi: 10.1016/j.mri.2012.05.001. [DOI] [PMC free article] [PubMed] [Google Scholar]
- 19.Mazzaferri J, Beaton L, Hounye G, Sayah DN, Costantino S. Open-source algorithm for automatic choroid segmentation of OCT volume reconstructions. Sci Rep. 2017;7:42112. doi: 10.1038/srep42112. [DOI] [PMC free article] [PubMed] [Google Scholar]
- 20.Duan L, Hong YJ, Yasuno Y. Automated segmentation and characterization of choroidal vessels in high-penetration optical coherence tomography. Opt Express. 2013;21:15787–15808. doi: 10.1364/OE.21.015787. [DOI] [PubMed] [Google Scholar]
- 21.Kajic V, Esmaeelpour M, Glittenberg C, et al. Automated three-dimensional choroidal vessel segmentation of 3D 1060 nm OCT retinal data. Biomed Opt Express. 2013;4:134–150. doi: 10.1364/BOE.4.000134. [DOI] [PMC free article] [PubMed] [Google Scholar]
- 22.Borrelli E, Sarraf D, Freund KB, Sadda SR. OCT angiography and evaluation of the choroid and choroidal vascular disorders. Prog Retin Eye Res. 2019;67:30–55. doi: 10.1016/j.preteyeres.2018.07.002. [DOI] [PubMed] [Google Scholar]
- 23.Spaide RF, Fujimoto JG, Waheed NK, Sadda SR, Staurenghi G. Optical coherence tomography angiography. Prog Retin Eye Res. 2017;2018;64:1–55. doi: 10.1016/j.preteyeres.2017.11.003. published online ahead of print December 8. [DOI] [PMC free article] [PubMed] [Google Scholar]
- 24.Hong Y-J, Miura M, Makita S, et al. Noninvasive investigation of deep vascular pathologies of exudative macular diseases by high-penetration optical coherence angiography. Invest Opthalmol Vis Sci. 2013;54:3621. doi: 10.1167/iovs.12-11184. [DOI] [PubMed] [Google Scholar]
- 25.Maloca P, Gyger C, Schoetzau A, Hasler PW. Ultra-short-term reproducibility of speckle-noise freed fluid and tissue compartmentalization of the choroid analyzed by standard OCT. Trans Vis Sci Tech. 2015;4:3. doi: 10.1167/tvst.4.6.3. [DOI] [PMC free article] [PubMed] [Google Scholar]
- 26.Hirata M, Tsujikawa A, Matsumoto A, et al. Macular choroidal thickness and volume in normal subjects measured by swept-source optical coherence tomography. Invest Ophthalmol Vis Sci. 2011;52:4971–4978. doi: 10.1167/iovs.11-7729. [DOI] [PubMed] [Google Scholar]
- 27.Ikuno Y, Kawaguchi K, Nouchi T, Yasuno Y. Choroidal thickness in healthy Japanese subjects. Invest Ophthalmol Vis Sci. 2010;51:2173–2176. doi: 10.1167/iovs.09-4383. [DOI] [PubMed] [Google Scholar]
- 28.Chen Q, Niu S, Fang W, et al. Automated choroid segmentation of three-dimensional SD-OCT images by incorporating EDI-OCT images. Comput Methods Programs Biomed. 2018;158:161–171. doi: 10.1016/j.cmpb.2017.11.002. [DOI] [PubMed] [Google Scholar]


