Abstract
Pulmonary arterial hypertension (PAH) exerts substantial pressure overload on the right ventricle (RV), inducing RV remodeling and myocardial tissue adaptation often leading to right heart failure. The associated RV free wall (RVFW) adaptation involves myocardial hypertrophy, augmented intrinsic contractility, collagen fibrosis, and structural remodeling in an attempt to cope with pressure overload. If RVFW adaptation cannot maintain the RV stroke volume (SV), RV dilation will prevail as an exit mechanism, which usually decompensates RV function, leading to RV failure. Our knowledge of the factors determining the transition from the upper limit of RVFW adaptation to RV decompensation and the role of fiber remodeling events such as extracellular fibrosis and fiber reorientation in this transition remains very limited. Computational heart models that connect the growth and remodeling (G&R) events at the fiber and tissue levels with alterations in the organ-level function are essential to predict the temporal order and the compensatory level of the underlying mechanisms. In this work, building upon our recently developed rodent heart models (RHM) of PAH, we integrated mathematical models that describe volumetric growth of the RV and structural remodeling of the RVFW. The time-evolution of RV remodeling from control and post-PAH time points was simulated. The results suggest that the augmentation of the intrinsic contractility of myofibers, accompanied by an increase in passive stiffness of RVFW, is among the first remodeling events through which the RV strives to maintain the cardiac output. Interestingly, we found that the observed reorientation of the myofibers toward the longitudinal (apex-to-base) direction was a maladaptive mechanism that impaired the RVFW contractile pattern and advanced along with RV dilation at later stages of PAH. In fact, although individual fibers were more contractile post-PAH, the disruption in the optimal transmural fiber architecture compromised the effective contractile function of the RVFW, contributing to the depressed ejection fraction (EF) of the RV. Our findings clearly demonstrate the critical need for developing multiscale approaches that can model and delineate relationships between pathological alterations in cardiac function and underlying remodeling events across fiber, cellular, and molecular levels.
Keywords: cardiac remodeling, hypertrophy, adaptive and maladaptive mechanisms, pulmonary arterial hypertension
1. Introduction
Pulmonary arterial hypertension (PAH) remains a fatal disease, despite significant progress in its treatment [1]. PAH is caused by progressive pulmonary vasoconstriction leading to increased pulmonary vascular resistance and pulmonary artery pressure [2]. To cope with the increased arterial pressure and preserve stroke volume (SV), the right ventricle (RV) of the heart undergoes several remodeling steps at the fiber, tissue, and organ levels that may eventually lead to RV failure [3]. Although the nature of the pressure overload is a factor in the progression toward RV failure, studies suggest that the major predictive determinant of the prognosis of PAH is how the RV adapts [4]. Increase in regional RV free wall (RVFW) contractility, which consists of a hypertrophic response through sarcomerogenesis, as well as intrinsic changes in myocyte force generation, is considered to be an important adaptive remodeling to maintain stroke volume [2,5,6]. These changes are primarily caused by mechanical stimuli through a direct pressure overload and by activation of the neurohormonal system [7–9]. Parallel to these changes, structural remodeling in terms of fiber-level stiffening, as well as fiber reorientation and alignment, takes place [5,10–12] that significantly contributes to the changes in both RV diastolic and contractile functions. At the organ level, a progressive RV dilation, considered to be a maladaptive (or decompensatory) response, is activated at later stages of PAH development to maintain the RV stroke volume once the increase in RVFW contractility is at its limit [5,9]. However, the exact determinants to identify the transition from adaptive to decompensated states remain elusive. Although the increase in regional RVFW contractility is considered to be a compensatory mechanism (at least in the early phase of PAH development), our knowledge of the compensatory level of fiber remodeling, including fiber reorientation and alignment and its temporal order relative to other remodeling events, remains very limited.
Image-based computational models of PAH, including both biventricular cardiac models as well as hemodynamic models of the pulmonary vasculature, hold promise to advance our understanding of cardiac and vascular remodeling under PAH, and there has been growing interest in developing such models [13–16]. As computational cardiac models have elucidated the marked effect of myofiber orientation in the load distribution in the myocardial wall [17–20], remodeling in fiber structure alone is expected to influence the overall contractile function of the ventricle. Indeed, different transmural distributions of myofibers with the same contractile force could lead to distinct contractile patterns, and in turn different pumping efficiencies, at the organ level. In addition, there are not sufficient studies addressing the relationships between remodeling events associated with growth and mass accretion and those associated with alterations in mechanical and structural properties of fiber ensembles. For instance, the questions of how much the ventricular hypertrophy directly contributes to fiber reorientation, and how much of the reorientation is driven by degradation/deposition of fibers, remain to be explored.
At the fiber level, the growth of muscle cells is classically attributed to parallel or serial additions of sarcomeres [21–23], commonly referred to as concentric and eccentric hypertrophy [24,25], respectively. Concentric hypertrophy leads to wall thickening with small changes in the ventricle volume, whereas the eccentric hypertrophy induces volume dilation together with potential wall thinning through elongation of the free wall. Accordingly, the growth stimuli have been taken to be a deviation from homeostatic stress and stretch along the myofiber direction for the case of concentric and eccentric hypertrophy, respectively [26,27], based on the understanding that the growth mechanism attempts to restore the respective growth stimulus. However, pathophysiology of PAH (and perhaps other structural heart diseases) is not limited to only one phenotype of hypertrophy, and although concentric hypertrophy could be initially prevalent, it may quickly transition to an eccentric phenotype depending on organ-level cardiac demands [9,28–30]. As such, studies that could shed light into the time-evolution of hypertrophy phenotype along PAH progression are essential in developing G&R frameworks with versatile growth stimuli accounting for different phases (e.g., asymptomatic, compensatory, and decompensatory) of heart remodeling. Moreover, the majority of studies on modeling ventricular hypertrophy assume that active and passive properties of myocardium remain the same during the growth [26,31]. However, the volumetric growth of the heart at the tissue and organ levels is always paralleled with remodeling events at the fiber level that involve changes in the intrinsic compositional and material properties of tissue constituents [32]. Therefore, there is a pressing need for the development of volumetric growth formulations that account for changes in the tissue mechanical properties during the growth.
Recently, we developed high-fidelity biventricular finite element (FE) rodent heart models (RHMs), based on extensive data collected from rat hearts at control and post-PAH time points [5,10,33]. In this study, we extended our model to predict the time course of fiber-, tissue-, and organ-level adaptations of the RV under PAH from the control to post-PAH states. We used a conventional continuum growth model to describe the RV hypertrophy driven by sarcomerogenesis and changes in collagen network, coupled with a fiber-level remodeling model accounting for deformation-induced fiber reorientation events. Our formulation also accounted for the changes in the passive and active properties of the RVFW during the volumetric growth and fiber remodeling. Starting from the control heart, we performed multiple inverse problems (IPs), with the post-PAH heart characteristics as the targets, to estimate the evolution of remodeling events. We used our model to investigate the correlations between the alterations in RVFW stiffness and contractility, the remodeling of the RVFW fiber structure, and the shape changes in the RV during the development of PAH. To the best of our knowledge, this is the first work to investigate the interaction between fiber remodeling and hypertrophy in the heart. Ultimately, the detailed description of organ-level remodeling patterns predicted by in silico models such as ours could replace the traditional measures of RV dimensions and volume that often lead to gross and limited information on cardiac performance.
2. Methods
Pulmonary arterial hypertension in humans is clinically characterized by a mean pulmonary artery pressure greater than 25 mmHg and a pulmonary capillary wedge pressure less than 15 mmHg. However, there is not a clear definition of PAH in small animals. Rodent models of PAH attempt to mimic the disease by increasing (usually doubling) the RV pressure while keeping the left ventricular (LV) pressure in the normal range. Recently, we developed two implementations of the FE biventricular RHMs from control (normal) and post-PAH (4 weeks) rat hearts (Fig. 1). Briefly, the PAH was induced in rats by subcutaneous injection of a moderate dose of monocrotaline (MCT) [34]; the control group received a similar injection of phosphate-buffered saline [5]. Terminal hemodynamic measurements were collected at 4 weeks postinjection. High-resolution magnetic resonance imaging (MRI) and diffusion tensor-magnetic resonance imaging scans were then performed on the prepared hearts. More detail on the animal model and hemodynamic measurements can be found in the Supplementary Materials on the ASME Digital Collection.
Fig. 1.
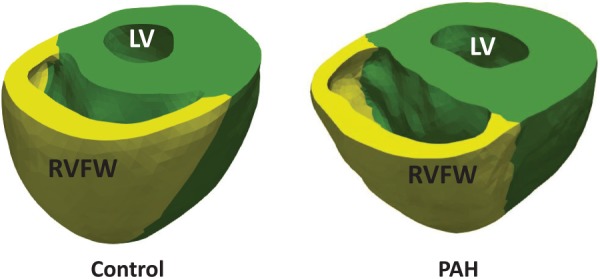
Reconstructed biventricular geometries of the control (normal) and post-PAH (post-PAH, Day 28) hearts, which exhibits a dilated RV with slightly thinned RV free wall (RVFW)
The remainder of this section is organized as follows. In Sec. 2.1, we briefly review the development of control and post-PAH RHMs. Section 2.2 lays out the main considerations for incorporating the volumetric growth and remodeling (G&R) into the control RHM. In Secs. 2.3 and 2.4, we cover the kinematics of volumetric growth and fiber remodeling, respectively. Finally, Secs. 2.5 and 2.6 address the time integration of kinetic laws and the design of inverse problems to produce targeted G&R events observed at the post-PAH state.
2.1. Rodent Heart Model of Control and Post-Pulmonary Arterial Hypertension Time Points.
The development of the rat-specific biventricular RHM for the control and post-PAH (also referred to as PAH in this paper) hearts was described in detail previously [5]. Briefly, the development consisted of four main steps (Fig. 2): (i) reconstruction and meshing of the biventricular geometry, (ii) registering the myofiber orientation to the meshed geometry, (iii) incorporating the passive and active constitutive laws into the model, and (iv) conducting an inverse model to match the organ-level hemodynamic measurements. Below, we briefly review the material model used for the myocardium.
Fig. 2.
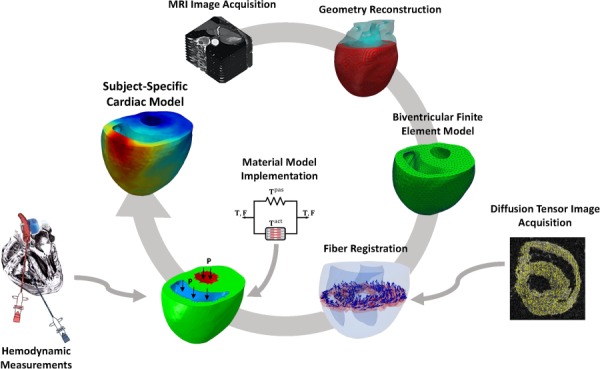
Scheme of the major steps in the development of finite-element rat heart models. Sub-image on the left titled “Hemodynamic measurements” is from https://dvj.eng.ucsd.edu/research, provided courtesy of D. Valdez-Jasso.
2.1.1. Myocardium Material Model.
A transversely isotropic hyperelastic constitutive model, based on additive stress decomposition, was used to describe the passive and active behavior of myocardium in the form
| (1) |
where T is the total Cauchy stress, is the isochoric part of the deformation gradient F and J = det(F) denotes the volumetric change. The passive behavior is governed by a transversely isotropic energy function W where the decomposition into deviatoric (dev) and volumetric (vol) parts is to enforce the incompressibility constraint in the FE formulation.
The passive stress Tpas was described using a Fung-type strain energy function [35] with the deviatoric and volumetric parts given by
| (2) |
and
| (3) |
respectively. Using a Cartesian coordinate system X1, X2, and X3 to denote the local preferred material directions, the quadratic form Q is expressed as
| (4) |
with the fiber direction f0 being taken to be along X1. In these equations, is the isochoric Green–Lagrange strain tensor, c is a positive stress-like constant, B1, B2, and B3 are dimensionless constants characterizing the local anisotropy in the myocardium, the positive constant b is a nondimensional factor, and κ is the bulk modulus.
A constitutive equation for the active stress generated along the fiber direction can be written as
| (5) |
where f = Ff0 denotes the fiber direction in the deformed configuration, and Ta is a stress-like positive function of the strain in the fiber direction f0 given by Ef = f0 · Ef0. Following the Hunter–McCulloch–Ter Keurs model for mechanical behavior of contractile myocytes [36], we chose the following form for Ta(Ef):
| (6) |
The above model obeys the Frank–Starling relationship, where the active force generated by the myofibers increases, modulated by a factor β (> 0), when myofibers are extended to the preload strain Ef. We made the further simplifying assumption that the activation spatial pattern is homogeneous throughout each region of the biventricular model.
An inverse problem approach was used to estimate the passive and active material properties of the LV and RVFW at control and post-PAH time points (see Table 1 for passive properties.) A detailed description of the approach and values of other material parameters, described in this section, can be found in the Supplementary Materials on the ASME Digital Collection of the previous study [5].
Table 1.
Values of passive properties of the RV and LV regions for the control and post-PAH RHMs used in this work
| RVFW | LV | |||
|---|---|---|---|---|
| b | c (kPa) | b | c (kPa) | |
| Control | 2.07 | 0.43 | 2.07 | 0.52 |
| PAH | 2.26 | 1.35 | 2.26 | 0.61 |
2.2. Incorporation of Growth and Remodeling—Key Assumptions and Approach.
The time-course variation of RV peak pressure was measured in PAH animal models during 28 days following MCT injection ([37], see Fig. 3(top)). These measurements suggested all the G&R events in the MCT model of PAH (4 weeks period) take place in three phases (differentiated in terms of the RV pressure)
-
(1)
Quiescent phase: About 5 days, during which the RV pressure remained about the same as in the control heart.
-
(2)
Developing phase: About 3 and 4 days, during which the RV pressure rapidly ramped up from the normal range to the full hypertensive range.
-
(3)
Plateaued phase: About 20 days, during which the RV pressure remained in the full hypertensive range.
Fig. 3.
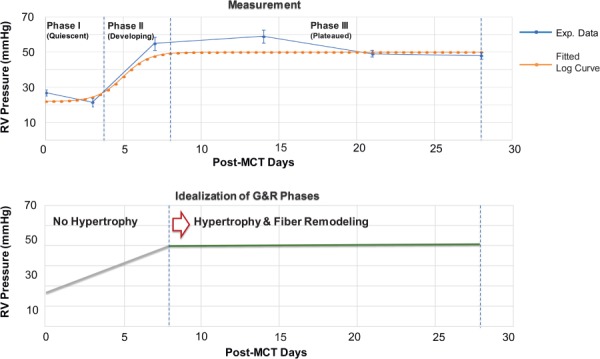
The evolution of the peak systolic pressure in the RV post MCT injection. (top) The RV pressure measured in MCT rats (with the dose of 60 mg/kg body wt) [37]: control (n = 12), day 3 (n = 12), day 7 (n = 5), day 14 (n = 6), day 21 (n = 5), and day 28 (n = 5). (bottom) Idealized evolution of the RV pressure with volumetric growth and fiber remodeling events.
Following these observations, below, we summarize the key considerations and assumptions underlying our G&R model for the RV
As the RV pressure remained approximately constant for a large part of the postinjection period (Fig. 3(top)), a key assumption in our model was that the volumetric growth and fiber remodeling were limited to this phase, i.e., the heart anatomy and fiber structure remained unchanged during the quiescent and developing phases (Fig. 3(bottom)).
We induced and calibrated volumetric growth and fiber remodeling in the control geometry with the target of matching the following quantities in the post-PAH heart: (i) the amount of RV dilation, (ii) the amount of average fiber reorientation in the RVFW, and (iii) the altered active contraction characteristic () of the RVFW.
Given that the post-PAH anatomy exhibited mainly chamber dilation with minimal RVFW wall thickening, we adopted an (anisotropic) eccentric hypertrophy formulation assuming that the fibers grow only along the fiber direction.
2.3. Volumetric Growth.
Our volumetric growth model to induce RV dilation was based on multiplicative decomposition of the deformation gradient [13,26], expressed as
| (7) |
where the superscript e and g denote the elastic and growth parts of the respective variable. Similarly, the stretch along the fiber direction f0 is decomposed to growth and elastic parts as
| (8) |
where C = FTF, Ce = FeTFe, and fg = Fgf0 denotes the orientation of the fibers in the intermediate configuration (following the application of Fg) with the length such that .
As discussed in Sec. 1, for an eccentric hypertrophy, the growth tensor reflects the serial deposition of sarcomeres that leads to lengthening along the fiber direction. This tensor can be expressed by
| (9) |
where ϑg is the growth multiplier. For the above growth form of Eq. (9), it is easy to show that the growth multiplier is indeed the growth part of the fiber stretch, i.e., ϑg = λg. A specific strain-driven evolution law for ϑg is given by [26]
| (10) |
with ϕg = λe − λh where the superscript h denotes the homeostatic value of the respective variable preceding the onset of growth and remodeling. k(ϑ) is a modulator function that bounds the growth between the minimum value ϑg = 1, i.e., no growth, and the upper bound . Here, we used the following function associated with the generalized logistic growth:
| (11) |
where ng > 0 determines the degree of nonlinearity as the growth approaches the upper bound, is the upper bound of the growth, and αg is a constant modulating the speed of the growth. We chose the above function over the limiting function , often used in the literature [26,38]. Reasons for this choice and comparisons between these two growth functions are discussed in the Appendix.
2.4. Fiber Remodeling.
Here, we assumed that fiber remodeling could be driven by two mechanisms: (i) anisotropic volumetric growth that can reorient fibers to ensure the kinematic compatibility following the application of F = FeFg, and (ii) the gradual adaptation of fiber orientation toward the axis with the largest stretch. In the latter mechanism, the fibers adapt their orientation following a change in the direction of the largest stretch and/or in the value of the largest stretch [39]. This change could take place due to the elevation of the RV pressure and the subsequent dilation of the chamber. The largest stretch and its associated direction can be obtained by eigenvalue decomposition of the deformation tensor Ce in the RVFW as follows:
| (12) |
where λi and ei are the principal stretches and directions of the stretch tensor , respectively. The largest stretch and the associated direction are denoted by λmax and emax, respectively.
The reorientation stimulus is an angular velocity vector (also referred to as the rotation vector) that drives the reorientation of the fiber direction f0 toward an adapted direction emax given by
| (13) |
where ϑr ≥ 0 is the remodeling multiplier characterizing the speed at which the fiber direction reorientation takes place. The velocity vector can be represented by the axis of rotation and the scalar velocity α as
| (14) |
where ϕ is the angle between f0 and emax. The evolution of the fiber direction f0 toward the principal direction emax can be then given by
| (15) |
Similar to the growth kinetic law for ϑg, we chose the following strain-driven evolution law for ϑr:
| (16) |
where . Similarly, the limiting function kr(ϑr) follows a generalized logistic growth and is given by:
| (17) |
where nr > 0 is the degree of nonlinearity as the remodeling approaches the upper bound, is the upper bound of the remodeling, and αr is a constant affecting the acceleration of remodeling.
2.5. Explicit Time Integration.
We used explicit time integration to discretize and solve the kinetic equations following the separation of time scales between G&R events and cardiac heartbeats. This separation is based on the understanding that the fiber- and organ-level G&R events become evident only after a large number of heartbeats [31]. Following the time integration approach suggested in Ref. [31], we treated Fg and as constants in each G&R cycle, where each cycle represents a sufficient number of heartbeats that could induce measurable G&R alterations. Accordingly, the G&R multipliers ϑg and ϑr remained constant within each cycle and were updated only at the end of each cycle. In order to estimate the updated values of ϑg and ϑr (at the end of G&R cycle N), we defined local versions of these multipliers, denoted by and , and continually updated them within cycle N (Fig. 4) based on the strain-based stimuli described in Secs. 2.3 and 2.4. Accordingly, using an explicit time integration, the evolution of local multipliers within cycle N was determined by
| (18) |
with and at the beginning of each cycle, where t is the normalized time ranging from 0 to 1 within each cycle. The final values of and at the end of each cycle (i.e., at t = 1) were used to reconstruct the grown geometry and reoriented fibers at the end of cycle N (Fig. 4). The updated values of ϑg and ϑr, to be used in cycle N + 1, were estimated as
| (19) |
Fig. 4.
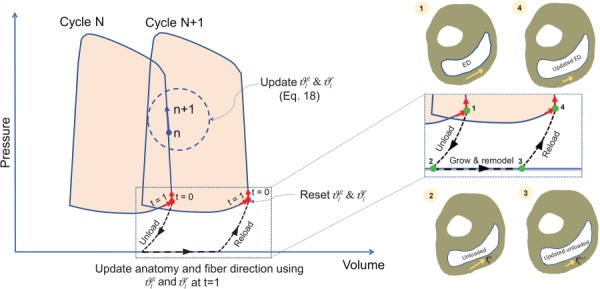
Update of heart anatomy and fiber structure at the end of each G&R cycle. The local G&R multipliers were updated within each cycle. Their values at the end of each cycle were used to update the geometry and the fiber orientation.
The update of the fiber orientation (in the unloaded reference configuration) was twofold. The first part of the update was merely due to the change of the update of the RV anatomy at the reference configuration. We refer to this part as “kinematic” reorientation of fibers. The second part that involved a more intrinsic reorientation of fibers stemming from the change in the principal directions of deformation as discussed in Sec. 2.4. We refer to this part as “intrinsic” reorientation of fibers. For this part, the updated angular velocity at the end of each cycle was used to update the fiber orientation. The evolution of the fiber direction f0 toward the principal direction emax can be written in terms of the rotation matrix that satisfies , where R ≠ I and is a third-order permutation tensor. The explicit update for f0 at the end of cycle N can then be written in terms of R as
| (20) |
which, through using Rodrigues' formula, takes the form [39]
| (21) |
2.5.1. Calculation of Stress and Modulus Tensors.
To implement the volumetric growth and remodeling in the FE formulation, the stress tensor described in Eq. (1) and the Lagrangian tangent modulus tensor were modified to account for growth and remodeling of the RVFW. The derivation of these tensors is significantly simplified noting that G&R multipliers ϑg and ϑr remain constant within each cycle which results in the partial derivatives ∂ϑg/∂ C and ∂ϑr/∂ C being zero. The final form of the stress tensor at constant ϑg and ϑr can be written as
| (22) |
where , and , noting that the application of Fg in Eq. (9) does not alter the orientation of f0. Similarly, the modulus tensor takes the form
| (23) |
again, at constant values for ϑg and ϑr, where is the second Piola–Kirchhoff stress tensor.
In final simulations, we used the values αr = αg = 1, Kg = 4, Kr = 2.5, and nr = ng = 2. These values were chosen following our extensive pilot explorations of the inverse modeling to match the measurements for the PAH heart. In particular, our pilot studies suggested that the fiber reorientation and RV dilation should take place toward the end of 28-day period in order to be able to match the measured contractility at day 28 time point. The above values were chosen to produce this trend in the G&R events.
2.6. Inverse Problem Approach.
Our approach consisted of starting from the control heart and constructing and solving inverse problems (IPs) at multiple time points between the control and post-PAH states (Fig. 5) with the goal of matching main features measured in the post-PAH heart. Since the control and post-PAH hearts belonged to different rats, we attempted to match main remodeling events at the post-PAH state (day 28) that included: (i) RV dilation, (ii) average fiber reorientation in the RVFW, and (iii) the changes in in the RVFW.
Fig. 5.
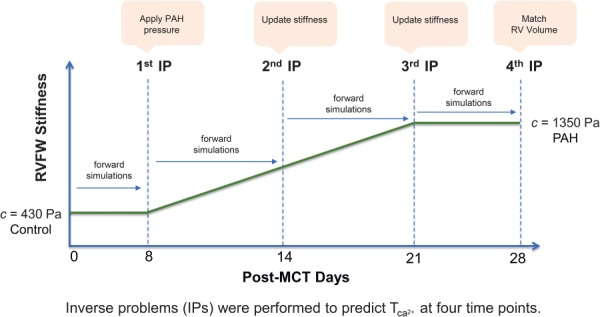
Our IP approach to predict the heart G&R. Four IPs were performed. The RVFW stiffness (c) was used as input and the RVFW contractility () was estimated in each IP. The stiffness was updated in the second and thirdIP.
Following the separation of time scales between cardiac heartbeats and the occurrence of remodeling (discussed above), we performed 28 cycles of growth and remodeling, where each cycle represented one day in the development of PAH following the MCT injection. We prescribed and updated the RVFW stiffness c as the input of the IP and estimated the value of at four time points (Fig. 5). We kept the active properties of the RVFW constant up to the next time point while allowing the heart to grow and remodel. Longitudinal studies of the RVFW stiffening in MCT models of PAH are scant. However, a three-time-point study (control, 14 days, 25 days) on RVFW hypertrophy [40] suggests that the thickening of myocytes, which is a factor and an indicator in RVFW stiffening, is not significant at the early stage of PAH and becomes prominent in the fourth week. Similarly, a five-time-point study (control, 7 days, 14 days, 21 days, 28 days) measuring end-diastolic (ED) elastance from the pressure–volume (P-V) loops [6] suggests that the majority of (passive) RVFW stiffening takes place in the second and third weeks following MCT injection (see Table 1 in Ref. [6]). Inspired by these observations and given our extensive pilot exploration of different variations of RVFW stiffening, we prescribed a linear variation of c from days 8 to 21 (Fig. 5). In summary, our inverse problem approach consisted of the following steps:
The first IP was performed at day 8 time point. We prescribed the same RVFW stiffness (c) as in the control heart. We applied the PAH pressure to the ventricles at this point and estimated .
The next time point was day 14. We performed six G&R cycles as forward simulations with the same stiffness and contractility as in day 8. The heart at day 14 exhibited volumetric growth and fiber remodeling. We updated c at this time point and estimated the new .
The next time point was day 21. Similar to the above step, we first performed seven G&R cycles as forward simulations to reach day 21. We then updated c and estimated the new .
The RVFW stiffness remained constant for the fourth week, and the last IP was performed at day 28.
The homeostatic values of elastic stretch and principal direction of deformation (λh and ) were updated at the end of each G&R cycle. Also, the ventricular pressures remained the same from days 8 to 28, as depicted in the idealized pressure evolution in Fig. 3(bottom). In total, four IPs were performed. We used a Levenberg–Marquardt algorithm in Python version 2.7 for solving the inverse problems and used abaqus/standard [41] to conduct the FE simulations.
3. Results
3.1. Ventricular Dilation.
Considerable dilation of the RV was observed, whereas the LV underwent little notable change (Fig. 6). The RV ED volume increased by approximately 93%, from 40.7 to 78.3 μL, with a large part of the dilation occurring in the last week of the PAH development. The SV of the RV was nearly preserved; however, a ∼41% decrease in the RV ejection fraction (EF) was noted. The control heart showed a prominent circumferential contraction (and change of curvature) in the RVFW at end systole that significantly declined at later stages of the RV growth (Fig. 6). A small amount of RVFW thickening (concentric hypertrophy) occurred, whereas the RVFW underwent significant circumferential stretching resulting in RV dilation (Fig. 6). Our G&R model produced a slight septal bowing toward the LV (Fig. 6); however, the amount of bowing was significantly lower than that in the post-PAH heart (Fig. 1). On the other hand, the RV dilation and RVFW stretching, predicted by the model, agreed well with those changes seen in our representative post-PAH cardiac anatomy. Evolution of the growth multiplier throughout the cycles predicted fairly uniform growth within the RVFW (Fig. 7).
Fig. 6.
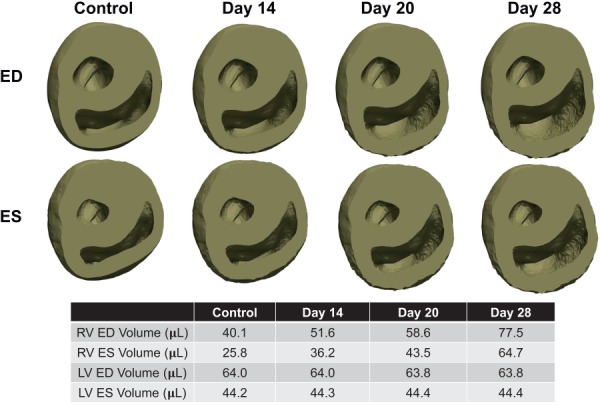
Progression of anatomical growth at ED and end-systole (ES) states throughout the development of PAH. The RV was severely dilated at later stages of PAH and slight thickening of the RVFW was visible.
Fig. 7.
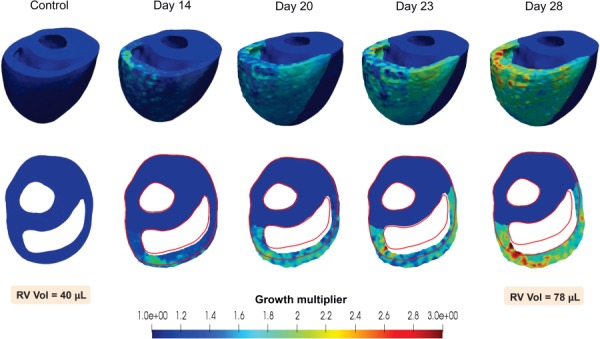
Evolution of the growth multiplier throughout the development of PAH. Hypertrophy and dilation of the RV can be seen in representative cycles, with the control geometry shown by the red outline.
3.2. Structural Remodeling.
The G&R model was able to generate the fiber reorientation across the RVFW thickness as seen in the PAH heart (Fig. 8), and also consistent with previous histological studies [10,12]. The fibers exhibited an average reorientation of ∼16 deg from horizontal (Fig. 8) such that the post-PAH heart at day 28 showed an average fiber orientation of ∼39 deg from horizontal. Reorientation toward the longitudinal direction took place rapidly (mostly within seven G&R cycles) in the later stages of PAH development. This was similar to the development of the ventricular dilation, indicating interdependence of dilation and fiber reorientation as late-stage attempts of the heart to maintain the SV.
Fig. 8.
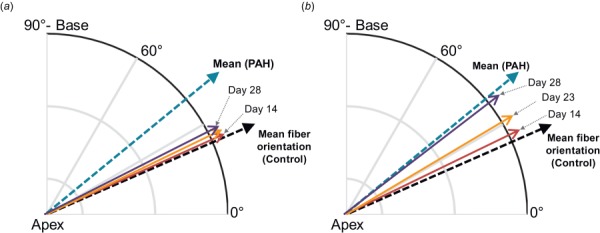
Progression of mean fiber orientation in the RVFW: (a) kinematic portion of reorientation due to RV dilation and (b) total reorientation including kinemtatic and “intrinsic” portions. The latter is driven by changes in principal deformation axes.
Kinematic changes in the mean fiber direction due to RV dilation (Fig. 8(a)) were not sufficient to capture the amount of reorientation seen in the PAH heart. This portion of the reorientation maintained the same rate as that of the volumetric growth, starting slowly from day 8 and accelerating with RV dilation toward the end of the growth. Addition of an “intrinsic” deformation-induced fiber reorientation was necessary to capture the total amount of reorientation (Fig. 8(b)). Similarly, this portion of the reorientation made its contribution to fiber remodeling in the later stages of PAH development.
3.3. Adaptation of Active Contraction.
The peak value of in the RVFW increased by approximately 450% from control to post-PAH, from 47 kPa to 261 kPa (Fig. 9(a)). The G&R model was able to capture the full cardiac cycle at post-PAH time point and estimated the plausible evolution of along the PAH development (Fig. 9(a)). The early increase in (up to day 8) was not accompanied by any significant anatomical or structural remodeling (Fig. 9(b)). nearly approached the post-PAH value on day 21 and continued to increase at a slower rate during the last week such that it slightly exceeded the post-PAH value at day 28 time point (Fig. 9(a)). On the other hand, the RV dilation accelerated and showed a pronounced increase during the last week of growth and remodeling (Fig. 9(b)).
Fig. 9.
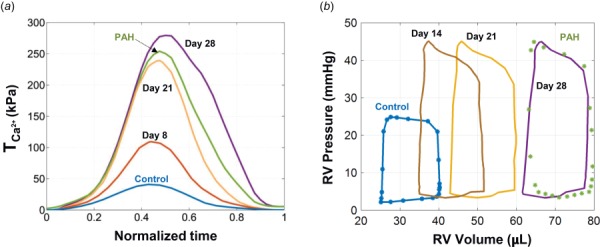
Time-evolution of (a) RVFW contractility (characterized by ) and (b) the RV P–V loops, throughout the development of PAH. Results for days 8, 14, 21, and 28 time points were estimated by the present G&R model. results for control and (post-)PAH time points, previously estimated [5] via matching to the P–V measurements, are shown by markers in part (b).
3.4. Effect of Fiber Remodeling on Right Ventricle Free Wall Contraction.
We used the post-PAH RHM to examine the exclusive effect of the fiber reorientation on the RV function in silico. We developed a duplicate PAH RHM with an RVFW fiber distribution similar to that in the control heart (labeled as PAH with “no fiber remodeling”) and compared the results with those of the PAH RHM (labeled as PAH “with fiber remodeling”). The PAH RHM with no fiber remodeling had a larger RV ejection fraction (Fig. 10(a)) due to a larger SV (Fig. 10(b)). Consistently, a smaller contractility (a lower ) was required to maintain the same ejection fraction as in the PAH heart (Fig. 10(c)).
Fig. 10.
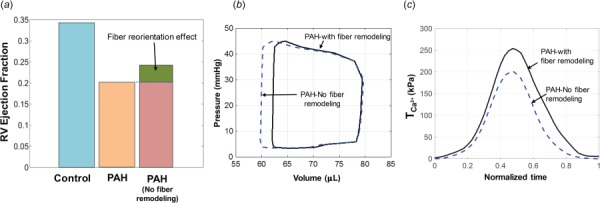
Effects of fiber reorientation on cardiac function of the post-PAH heart. The effect on (a) RV EF, (b) RV P–V loop, and (c) RVFW contractility.
3.5. Compensatory–Decompensatory Transition.
Overall, significant anatomical, structural, and functional adaptations were observed in the RV from control to post-PAH. The estimation of how these adaptations evolve throughout PAH development identified the temporal order of remodeling events and the transition from an asymptomatic, to a compensatory, to a decompensatory state (Fig. 11). The changes in the RVFW contractility and stiffening progressed differently from RV eccentric hypertrophy and fiber remodeling. While dilation and fiber reorientation occurred mainly in the decompensatory phase, the marked increase in the RVFW contractility and stiffness occurred largely in the compensatory phase (Fig. 11).
Fig. 11.
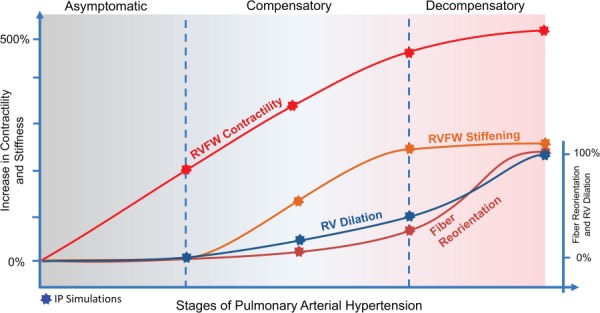
Time-course interpolation of the adaptive and maladaptive mechanisms studied in this work
4. Discussion
We have presented a rodent computational model of growth and structural remodeling in response to PAH. To our knowledge, the model is the first to integrate structural remodeling with myocardial hypertrophy while incorporating changes in passive and active material properties of the RVFW. Integration of the remodeling mechanisms occurring at different scales allowed us to systematically examine the temporal evolution of individual mechanisms throughout the development of PAH. The G&R framework developed in this paper is an example of how an in silico platform can uniquely complement in vivo studies to provide important insights into the interaction between different remodeling mechanisms to restore cardiac function. In effect, these models hold promise to predict the outcome of such a complex interplay of RV G&R events in response to PAH. Using our image-based biventricular RHMs, we sought to test our hypothesis that the longitudinal shift and alignment of fibers impairs the RVFW contractile pattern and reduces RV ejection fraction although it assists with the restoration of in vivo wall stress in the circumferential direction.
4.1. Time-Course Behavior of Adaptations.
An important temporal differentiation in G&R events, inferred from our results, was that the structural and mechanical remodeling of the RVFW, as well as RV dilation, transitioned from a primarily adaptive state to a decompensated state. In particular, our modeling results suggested that the progression of PAH can be categorized into asymptomatic, compensatory, and decompensatory phases. Here, the asymptomatic phase refers to the early phase of the progress when the RV pressure is still in a normal range. We define the compensatory phase as the remodeling period during which the RV remains coupled to pulmonary circulation and it can still maintain its stroke volume without significant changes in the ED volume, mainly through intrinsic and hypertrophic increases in the RVFW contractility. Finally, the decompensatory phase refers to a later stage of PAH development when the RV dilation becomes the primary mechanism to maintain the stroke volume once the RV contractility reaches its capacity. Nevertheless, it should be emphasized that these phases are not well-separated, and adaptive and decompensatory mechanisms may coexist during the PAH progress.
Our results suggested that the asymptomatic phase included a notable increase in myofiber contractility while there were minimal changes in RV anatomy and RVFW passive stiffness. This implies that an increase in RVFW contractility may serve as an initial means by which the RV attempts to sustain a rising arterial pressure and maintain normal cardiac output.
Although compensatory mechanisms may initiate during the asymptomatic phase, they become more evident once the pressure overload is fully developed (referred to as the compensatory phase.) The compensatory phase was marked by a continued increase in contractility accompanied by an increase in the passive stiffness of the RVFW. A gradual increase in RV volume with a modest rate as well as slight changes in the fiber structure were also observed. Stiffening has been attributed to multiple mechanisms, including changes in myocyte biophysical properties, such as titin upregulation, changes in the collagen recruitment rate [12], and collagen fibrosis. Similarly, the changes in the RVFW contractility may stem from intrinsic changes in myocyte properties such as alterations in actin/myosin protein isoforms [2] as well as myofiber hypertrophy through sarcomerogenesis. Our results suggested that the increases in RVFW contractility and stiffness in the compensatory phase take place at similar rates, contrary to the asymptomatic phase, which involved more significant changes in the contractility than the stiffness. This may indicate that the intrinsic augmentation of the RVFW contractility may be activated first as a primary compensatory mechanism followed by myofiber hypertrophy as a secondary adaptive mechanism to improve the RVFW contractility, which is paralleled with a more significant collagen deposition and hence changes in the RVFW stiffness.
Also, although an increase in the intrinsic contractility of the RVFW can be seen as a compensatory mechanism, it is arguable that only moderate changes in the RVFW stiffness (whether through titin upregulation or changes in the collagen network) could serve as an adaptive response while more severe changes could accelerate the transition to the decompensatory state. Further investigations are required to identify a suitable range of RVFW stiffening to stabilize the remodeling and prevent progressive RV dilation. Moreover, our results further suggested that the RV volumetric increase and fiber remodeling occur at lower rates compared to changes in RVFW hypertrophy and contractility in this phase, indicating a weak coupling between RV dilation and RVFW stiffening and hypertrophy.
Finally, our model predicted that the increase in the RVFW contractility and stiffness tend to saturate at the end of the third week, although slight increases in the contractility may still be seen in the fourth week. (About 15% of the total change was predicted to take place in the fourth week.) In contrast, a significant increase in the rate of RV dilation and fiber reorientation in this phase was inferred from the results, indicating the transition of the RV to a decompensatory phase. The results for RV dilation were consistent with the well-recognized response to pressure overload: the rapid RV dilation is rather the last leeway that the RV takes to maintain cardiac stroke volume that significantly compromises RV ejection fraction accelerating RV failure [9].
4.2. Changes in the Contractile Pattern of Right Ventricle Free Wall.
The myofiber spatial distribution and the transmural variation in its orientation across the myocardial wall are well-organized and finely tuned in the normal heart to produce an efficient organ-level contraction and meet blood supply demand. As such, the pathological remodeling of the fiber organization in the RVFW, even if the individual fibers preserve contractility, may change the contractile pattern of the entire free wall and has a fundamental impact on cardiac output. Our model results predicted a longitudinal shift of the average fiber direction in the RVFW from 24 deg to 40 deg as well as a loss of transmural variation in fiber distribution, consistent with previous histological studies [10,12]. In particular, the histological data, collected in Ref. [10], showed a shift of about 15–20 deg in the fiber orientation toward the longitudinal direction with an enhanced alignment (see Figs. 4 and 5 in Ref. [10]). These data were analyzed further through reconstructed 3D surfaces in Ref. [12] and led to very similar values for the fiber reorientation and alignment (see Fig. 4 in Ref. [12]).
Our in silico studies on the effect of these structural changes on the RV contractility suggested that longitudinal reorientation and alignment disturb the fibers from their optimal distribution resulting in an impaired contractile pattern in the RVFW and, therefore, the further reduction of the RV ejection fraction. More specifically, our simulation results indicated that the alteration in fiber distribution and transmurality shifts the RVFW contractile pattern from a torsional mode that is dominated in the circumferential direction to a more isotropic mode. It is simple to show that, in contrast to circumferential contraction with apical torsion, the isotropic contraction of the RVFW produces ventricular flow in all directions rather than a prominent flow direction toward the outflow tract. Interestingly, we inferred from the results that although the individual myofibers were more contractile toward the end of the compensatory phase, the changes in the fiber distribution and the following contractile pattern alterations still noticeably undermined the RV function.
4.3. Mechanisms of Fiber Reorientation.
Using the continuum-level model of fiber remodeling in the RHM, we were able to predict a time-evolving behavior of the deformation-induced fiber reorientation; however, our model was not meant to identify the specific mechanisms underlying the fiber reorganization. Although our diffusion tensor-magnetic resonance imaging scans strongly suggest that there is a stronger fiber concentration toward the longitudinal direction in the post-PAH heart compared to the control heart, little is known in regards to the mechanisms by which this occurs. Our model results suggest that the RV dilation induces a small reorientation (a few degrees) of the fibers (referred to as kinematic reorientation), and the majority of fiber remodeling stems from the “intrinsic” reorientation of the fibers. Candidate mechanisms for the latter include: (i) degradation of fibers in the circumferential direction together with the pronounced sarcomerogenesis in the longitudinal direction (referred to as “preferential” hypertrophy), following changes in the principal deformation axis, and (ii) a gradual reorientation of the existing fibers toward the longitudinal direction. It is plausible that the final reorganization of the fibers is a result of both mechanisms, although it is unlikely that the reorientation of the existing fibers is a primary mechanism due to the tight spiral architecture of myofibers in the RVFW. This matter certainly demands further studies to identify fiber-level mechanisms and their contribution to alterations of the fiber spatial distribution in the RVFW.
4.4. Clinical and Therapeutic Implications.
Subject-specific G&R cardiac models (such the one presented in this work) hold promise to predict the progression of adaptive mechanisms and their possible transition into decompensatory events. These models are also capable of separating the relative effects of remodeling mechanisms (occurring at different scales) on cardiac function and providing insights into the interaction and competition between them. Given these capabilities, these models offer a valuable and efficient approach to identify RV-based mechanical biomarkers that can predict the prognosis of PAH in an individual given available anatomical, structural, and hemodynamic measurements. In particular, these biomarkers can predict whether the RV remodeling will stabilize or progress to right heart failure, thus informing the decision making for clinical management of the PAH patients. Moreover, the capability of the G&R model to isolate and evaluate the compensatory level of each remodeling mechanism highlights its potential to identify and effectively assess novel therapeutic biomarkers that work through reinforcing and suppressing adaptive and maladaptive mechanisms, respectively.
5. Limitations
Limitations to the methodology and approach that may have affected the quantitative aspect of our results in this work are noted herein. In our opinion, the primary limitation of our G&R model was that the prediction capability of the model was calibrated using only one time-evolving parameter available, i.e., the right ventricular pressure. Information regarding the evolution of RVFW hypertrophy, stiffening, and contractility throughout the development of PAH was not used/incorporated into the model as these data are currently lacking. However, several scenarios for the variation of the RVFW properties were explored to capture the post-PAH heart characteristics at day 28 time point. The final results presented in this paper were the only means (among all the scenarios explored) by which the model could capture the post-PAH state; therefore, we are confident that these limitations did not notably affect the quality of our results. Nonetheless, we are seeking the further validations of our results by obtaining longitudinal data on regional in vivo kinematics of rodent specimens pre- and post-MCT using cardiac magnetic resonance tagging techniques. These data will provide insights into the changes in RV dimensions and principal deformation directions that can be used to validate the predictions of both volumetric growth and fiber remodeling.
Another limitation with our modeling pipeline was that we used a phenomenological approach to describe the volumetric growth of the myocardium. Although this approach is capable of producing the ventricular dilation apparent in post-PAH hearts, it is not driven by the cellular and fiber-level mechanisms by which the growth occurs. In addition, this approach cannot separate the remodeling patterns of collagen and myofibers which could act as independent mechanisms affecting the overall amount and rate of organ-level remodeling. In future work, structural models that can separate the effect of collagen from myofibers (as in Ref. [11]) together with longitudinal experimental measurements will be employed to not only predict the G&R responses but also provide a novel understanding of underlying mechanisms.
6. Conclusions
The goal of this study was to investigate the time-course evolution of RVFW mechanical and structural properties using a continuum-level G&R model that can account for both organ-level hypertrophy and alterations in the tissue fibrous structure. Our results suggested that hypertrophic and intrinsic increase in myofibers contractility in conjunction with RVFW stiffening precedes other remodeling mechanisms including fiber realignment and RV dilation, that tend to decompensate the heart contractile function at later stages of PAH. In particular, we were able to demonstrate the important effects of the RVFW fiber structure on the overall contractile function of the RV. We observed using our model that the deviation of fibers from their transmural and circumferentially dominated arrangement could impair RV contractility even when the fibers are individually more contractile, due to the change in the contractile pattern from a circumferential-torsional mode toward an isotropic contraction.
Finally, while important progress has been made in continuum-level modeling of growth and remodeling of the myocardium under hypertension, there remains a critical need for multiscale approaches that connect organ-level function to tissue-, cellular-, and molecular-level events. This study was an important step toward this goal, as it addresses the myofiber-to-tissue-to-organ scale integration. Our future works will focus on extending the connection to smaller scale events with the goal of differentiating and quantifying the G&R mechanisms underlying tissue- and organ-level adaptations. For instance, these approaches hold promise to identify the relative contributions of cellular-scale events to RVFW stiffening that could involve collagen fibrosis, changes in collagen undulation, myofiber hypertrophic response, and titin modifications (where the latter may consist of changes in titin isoform compositions and phosphorylation.) In addition, multiscale approaches will be valuable in illustrating cellular-level mechanisms underlying the intrinsic change in the RVFW contractility that could range from increase in the intracellular calcium concentration to changes in cooperativity binding to changes in titin properties. Overall, such insights will enhance our understanding of processes controlling the transition of RV adaptation toward right heart failure and will identify new therapeutic targets in the RV for future pharmaceutical and clinical research.
Supplementary Material
Supplemental PDF
Acknowledgment
This work was supported by the U.S. National Institutes of Health awards (Nos. K99 HL138288-01A1 and 5F32 HL132543-03) and an American Heart Association award (18CDA34110383) to RA and the W.A. Moncrief, Jr. SBES endowment to MSS. The authors were honored to contribute to the special issue for the 100th birthday of Dr. Y.C. Fung. In particular, MSS would like to acknowledge Dr. Fung for having a major influence in his career, both directly and indirectly. The following passage is written by MSS to recognize this influence.
I first encountered Dr. Fung at a talk he gave in the late 1970s, where he presented a fantastic vision of the application of “hard” engineering to “soft” biological systems. This was quite new at the time. I immediately went to get his books and publications. At that time, I was also working as a humble undergraduate assistant to Dr. Lanir, who was at Michigan State University on sabbatical. Dr. Lanir was a postdoctoral fellow with Dr. Fung, where he performed the first biaxial tests on soft tissues and further developed his structural theories. Later on, I worked under Dr. Cheng-Jen Chuong for my doctorate, who was one of Dr. Fung's many Ph.D. students. As a young assistant professor at the University of Miami, Dr. Fung visited us and I had a chance to discuss my work and plans with him. In the following years, I used books and the remarkable impression he made on me (combining humor and profound insight) both in the lab and in the classroom to guide various students. The work presented herein is a direct reflection of that influence.
Appendix
In this Appendix, we provide comparisons between the limiting function , often used in the literature [26,38], and the logistic growth (Eq. (11)) used in our study. The former function generates a bounded growth; however, the maximum rate of growth occurs at t = 0 and decays to zero over time (Figs. 12(a) and 12(c)). In contrast, and as was discussed in the context of our results, adaptive biophysical alterations may precede pathological volumetric growth in PAH (and perhaps in other structural heart diseases.) For this reason, a typical logistic growth with smaller rates at the beginning (Figs. 12(b) and 12(d)) was a more appropriate choice for us to capture and predict the pathophysiology of PAH progression.
Fig. 12.
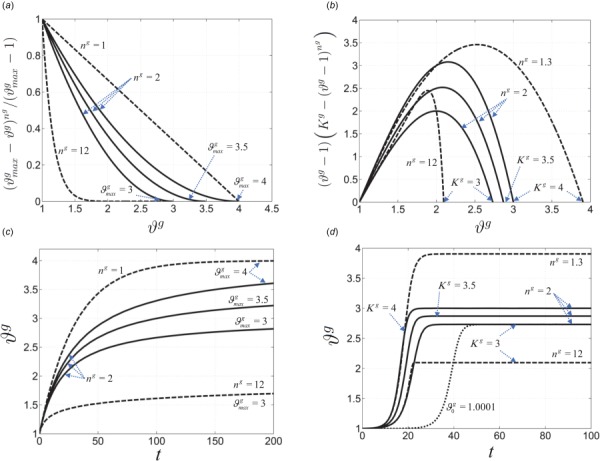
Comparisons between two bounded growth functions: ((a) and (b)) examples of two different forms of the limiting function kg(ϑg). ((c) and (d)) Examples of the resulting growth multipliers for the fixed value of ϕg = 0.1 Pa and αg = 1 1/(Pa · s) in Eq. (10). The logistic growth (d) allows for an early slow growth followed by a more aggressive growth as a progressive maladaptive mechanism. The initial value of ϑg (denoted by ) was set 0.001 for all the curves in (d) except the dotted line.
Contributor Information
Reza Avazmohammadi, Department of Biomedical Engineering, , James T. Willerson Center for , Cardiovascular Modeling and Simulation, , Oden Institute for Computational , Engineering and Sciences, , Austin, TX 78712.
Emilio A. Mendiola, Computational Engineering Program, , James T. Willerson Center for , Cardiovascular Modeling and Simulation, , Oden Institute for Computational , Engineering and Sciences, , Austin, TX 78712
David S. Li, Department of Biomedical Engineering, , James T. Willerson Center for , Cardiovascular Modeling and Simulation, , Oden Institute for Computational , Engineering and Sciences, , Austin, TX 78712
Peter Vanderslice, Department of Molecular Cardiology, , Texas Heart Institute, , Houston, TX 77030.
Richard A. F. Dixon, Department of Molecular Cardiology, , Texas Heart Institute, , Houston, TX 77030
Michael S. Sacks, Department of Biomedical Engineering, , James T. Willerson Center for , Cardiovascular Modeling and Simulation, , Oden Institute for Computational , Engineering and Sciences, , Austin, TX 78712, e-mail: msacks@oden.utexas.edu.
Funding Data
U.S. National Institutes of Health awards (Nos. K99 HL138288-01A1 and 5F32 HL132543-03; Funder ID: 10.13039/100000002).
American Heart Association award (18CDA34110383; Funder ID: 10.13039/100000968).
References
- [1]. McLaughlin, V. V. , Hoeper, M. M. , Channick, R. N. , Chin, K. M. , Delcroix, M. , Gaine, S. , Ghofrani, H.-A. , Jansa, P. , Lang, I. M. , Mehta, S. , Pulido, T. , Sastry, B. K. S. , Simonneau, G. , Sitbon, O. , Souza, R. , Torbicki, A. , Tapson, V. F. , Perchenet, L. , Preiss, R. , Verweij, P. , Rubin, L. J. , and Galiè, N. , 2018, “ Pulmonary Arterial Hypertension-Related Morbidity Is Prognostic for Mortality,” J. Am. Coll. Cardiol., 71(7), pp. 752–763. 10.1016/j.jacc.2017.12.010 [DOI] [PubMed] [Google Scholar]
- [2]. Bogaard, H. J. , Abe, K. , Noordegraaf, A. V. , and Voelkel, N. F. , 2009, “ The Right Ventricle Under Pressure: Cellular and Molecular Mechanisms of Right-Heart Failure in Pulmonary Hypertension,” Chest, 135(3), pp. 794–804. 10.1378/chest.08-0492 [DOI] [PubMed] [Google Scholar]
- [3]. Voelkel, N. F. , Gomez-Arroyo, J. , Abbate, A. , and Bogaard, H. J. , 2013, “ Mechanisms of Right Heart Failure-a Work in Progress and a Plea for Failure Prevention,” Pulm. Circ., 3(1), pp. 137–143. 10.4103/2045-8932.109957 [DOI] [PMC free article] [PubMed] [Google Scholar]
- [4]. McLaughlin, V. V. , Shah, S. J. , Souza, R. , and Humbert, M. , 2015, “ Management of Pulmonary Arterial Hypertension,” J. Am. Coll. Cardiol., 65(18), pp. 1976–1997. 10.1016/j.jacc.2015.03.540 [DOI] [PubMed] [Google Scholar]
- [5]. Avazmohammadi, R. , Mendiola, E. A. , Soares, J. S. , Li, D. S. , Chen, Z. , Merchant, S. , Hsu, E. W. , Vanderslice, P. , Dixon, R. A. , and Sacks, M. S. , 2019, “ A Computational Cardiac Model for the Adaptation to Pulmonary Arterial Hypertension in the Rat,” Ann. Biomed. Eng., 47(1), pp. 138–153. 10.1007/s10439-018-02130-y [DOI] [PMC free article] [PubMed] [Google Scholar]
- [6]. Vélez-Rendón, D. , Zhang, X. , Gerringer, J. , and Valdez-Jasso, D. , 2018, “ Compensated Right Ventricular Function of the Onset of Pulmonary Hypertension in a Rat Model Depends on Chamber Remodeling and Contractile Augmentation,” Pulm. Circ., 8(4), p. 2045894018800439. [DOI] [PMC free article] [PubMed] [Google Scholar]
- [7]. de Man, F. S. , Handoko, M. L. , Guignabert, C. , Bogaard, H. J. , and Vonk-Noordegraaf, A. , 2013, “ Neurohormonal Axis in Patients With Pulmonary Arterial Hypertension: Friend or Foe?,” Am. J. Respir. Crit. Care Med., 187(1), pp. 14–19. 10.1164/rccm.201209-1663PP [DOI] [PubMed] [Google Scholar]
- [8]. Spruijt, O. , de Man, F. , Groepenhoff, H. , Oosterveer, F. , Westerhof, N. , Vonk-Noordegraaf, A. , and Bogaard, H. , 2015, “ The Effects of Exercise on Right Ventricular Contractility and Right Ventricular–Arterial Coupling in Pulmonary Hypertension,” Am. J. Respir. Crit. Care Med., 191(9), pp. 1050–1057. 10.1164/rccm.201412-2271OC [DOI] [PubMed] [Google Scholar]
- [9]. Noordegraaf, A. , Westerhof, B. , and Westerhof, N. , 2017, “ The Relationship Between the Right Ventricle and Its Load in Pulmonary Hypertension,” J. Am. Coll. Cardiol., 69(2), pp. 236–243. 10.1016/j.jacc.2016.10.047 [DOI] [PubMed] [Google Scholar]
- [10]. Hill, M. , Simon, M. , Valdez-Jasso, D. , Zhang, W. , Champion, H. , and Sacks, M. , 2014, “ Structural and Mechanical Adaptations of Right Ventricle Free Wall Myocardium to Pressure Overload,” Ann. Biomed. Eng., 42(12), pp. 2451–2465. 10.1007/s10439-014-1096-3 [DOI] [PMC free article] [PubMed] [Google Scholar]
- [11]. Avazmohammadi, R. , Hill, M. , Simon, M. , Zhang, W. , and Sacks, M. , 2017, “ A Novel Constitutive Model for Passive Right Ventricular Myocardium: Evidence for Myofiber–Collagen Fiber Mechanical Coupling,” Biomech. Model. Mechanobiol., 16(2), pp. 561–581. 10.1007/s10237-016-0837-7 [DOI] [PMC free article] [PubMed] [Google Scholar]
- [12]. Avazmohammadi, R. , Hill, M. , Simon, M. , and Sacks, M. , 2017, “ Transmural Remodeling of Right Ventricular Myocardium in Response to Pulmonary Arterial Hypertension,” APL Bioeng., 1(1), p. 016105. 10.1063/1.5011639 [DOI] [PMC free article] [PubMed] [Google Scholar]
- [13]. Rausch, M. , Dam, A. , Göktepe, S. , Abilez, O. , and Kuhl, E. , 2011, “ Computational Modeling of Growth: Systemic and Pulmonary Hypertension in the Heart,” Biomech. Model. Mechanobiol., 10(6), pp. 799–811. 10.1007/s10237-010-0275-x [DOI] [PMC free article] [PubMed] [Google Scholar]
- [14]. Xi, C. , Latnie, C. , Zhao, X. , Le Tan, J. , Wall, S. , Genet, M. , Zhong, L. , and Lee, L. , 2016, “ Patient-Specific Computational Analysis of Ventricular Mechanics in Pulmonary Arterial Hypertension,” ASME J. Biomech. Eng., 138(11), p. 111001. 10.1115/1.4034559 [DOI] [PubMed] [Google Scholar]
- [15]. Gomez, A. , Zou, H. , Bowen, M. , Liu, X. , Hsu, E. , and McKellar, S. , 2017, “ Right Ventricular Fiber Structure as a Compensatory Mechanism in Pressure Overload: A Computational Study,” ASME J. Biomech. Eng., 139(8), p. 081004. 10.1115/1.4036485 [DOI] [PMC free article] [PubMed] [Google Scholar]
- [16]. Zambrano, B. A. , McLean, N. A. , Zhao, X. , Tan, J.-L. , Zhong, L. , Figueroa, C. A. , Lee, L. C. , and Baek, S. , 2018, “ Image-Based Computational Assessment of Vascular Wall Mechanics and Hemodynamics in Pulmonary Arterial Hypertension Patients,” J. Biomech., 68, pp. 84–92. 10.1016/j.jbiomech.2017.12.022 [DOI] [PMC free article] [PubMed] [Google Scholar]
- [17]. Kroon, W. , Delhaas, T. , Bovendeerd, P. , and Arts, T. , 2009, “ Computational Analysis of the Myocardial Structure: Adaptation of Cardiac Myofiber Orientations Through Deformation,” Med. Image Anal., 13(2), pp. 346–353. 10.1016/j.media.2008.06.015 [DOI] [PubMed] [Google Scholar]
- [18]. Bovendeerd, P. H. , 2012, “ Modeling of Cardiac Growth and Remodeling of Myofiber Orientation,” J. Biomech., 45(5), pp. 872–881. 10.1016/j.jbiomech.2011.11.029 [DOI] [PubMed] [Google Scholar]
- [19]. Zhang, X. , Haynes, P. , Campbell, K. S. , and Wenk, J. F. , 2015, “ Numerical Evaluation of Myofiber Orientation and Transmural Contractile Strength on Left Ventricular Function,” ASME J. Biomech. Eng., 137(4), p. 044502. 10.1115/1.4028990 [DOI] [PMC free article] [PubMed] [Google Scholar]
- [20]. Nikou, A. , Gorman, R. C. , and Wenk, J. F. , 2016, “ Sensitivity of Left Ventricular Mechanics to Myofiber Architecture: A Finite Element Study,” Proc. Inst. Mech. Eng., Part H, 230(6), pp. 594–598. 10.1177/0954411916638685 [DOI] [PMC free article] [PubMed] [Google Scholar]
- [21]. Catalucci, D. , Latronico, M. , Ellingsen, O. , and Condorelli, G. , 2008, “ Physiological Myocardial Hypertrophy: How and Why,” Front Biosci., 13(13), pp. 312–324. 10.2741/2681 [DOI] [PubMed] [Google Scholar]
- [22]. Kumar, V. , Abbas, A. , and Fausto, N. , 2005, Robbins and Cotran Pathologic Basis of Disease, Elsevier Saunders, Philadelphia, PA, pp. 10–11. [Google Scholar]
- [23]. Hatt, P. , 1977, “ Cellular Changes in Mechanically Overloaded Heart,” Basic Res. Cardiol., 72(2–3), pp. 198–202. 10.1007/BF01906361 [DOI] [PubMed] [Google Scholar]
- [24]. Zipes, D. P. , Libby, P. , Bonow, R. O. , Mann, D. L. , and Tomaselli, G. F. , 2018, Braunwald's Heart Disease E-Book: A Textbook of Cardiovascular Medicine, Elsevier Health Sciences, Philadelphia, PA. [Google Scholar]
- [25]. Carabello, B. A. , 2002, “ Concentric Versus Eccentric Remodeling,” J. Card. Failure, 8(6), pp. S258–S263. 10.1054/jcaf.2002.129250 [DOI] [PubMed] [Google Scholar]
- [26]. Göktepe, S. , Abilez, O. J. , Parker, K. K. , and Kuhl, E. , 2010, “ A Multiscale Model for Eccentric and Concentric Cardiac Growth Through Sarcomerogenesis,” J. Theor. Biol., 265(3), pp. 433–442. 10.1016/j.jtbi.2010.04.023 [DOI] [PubMed] [Google Scholar]
- [27]. Göktepe, S. , Abilez, O. J. , and Kuhl, E. , 2010, “ A Generic Approach Towards Finite Growth With Examples of Athlete's Heart, Cardiac Dilation, and Cardiac Wall Thickening,” J. Mech. Phys. Solids, 58(10), pp. 1661–1680. 10.1016/j.jmps.2010.07.003 [DOI] [Google Scholar]
- [28]. Badagliacca, R. , Poscia, R. , Pezzuto, B. , Nocioni, M. , Mezzapesa, M. , Francone, M. , Giannetta, E. , Papa, S. , Gambardella, C. , Sciomer, S. , Volterrani, M. , Fedele, F. , and Dario Vizza, C. , 2015, “ Right Ventricular Remodeling in Idiopathic Pulmonary Arterial Hypertension: Adaptive Versus Maladaptive Morphology,” J. Heart Lung Transplant., 34(3), pp. 395–403. 10.1016/j.healun.2014.11.002 [DOI] [PubMed] [Google Scholar]
- [29]. Vonk-Noordegraaf, A. , Haddad, F. , Chin, K. M. , Forfia, P. R. , Kawut, S. M. , Lumens, J. , Naeije, R. , Newman, J. , Oudiz, R. J. , Provencher, S. , Torbicki, A. , Voelkel, N. F. , and Hassoun, P. M. , 2013, “ Right Heart Adaptation to Pulmonary Arterial Hypertension: Physiology and Pathobiology,” J. Am. Coll. Cardiol., 62(25), pp. D22–D33. 10.1016/j.jacc.2013.10.027 [DOI] [PubMed] [Google Scholar]
- [30]. Drazner, M. H. , 2005, “The Transition From Hypertrophy to Failure: How Certain Are We?,” Circulation, 112(7), pp. 936–938. [DOI] [PubMed]
- [31]. Lee, L. C. , Sundnes, J. , Genet, M. , Wenk, J. F. , and Wall, S. T. , 2016, “ An Integrated Electromechanical-Growth Heart Model for Simulating Cardiac Therapies,” Biomech. Model. Mechanobiol., 15(4), pp. 791–803. 10.1007/s10237-015-0723-8 [DOI] [PubMed] [Google Scholar]
- [32]. Lee, L. , Kassab, G. , and Guccione, J. , 2016, “ Mathematical Modeling of Cardiac Growth and Remodeling,” Wiley Interdiscip. Rev.: Syst. Biol. Med., 8(3), pp. 211–226. 10.1002/wsbm.1330 [DOI] [PMC free article] [PubMed] [Google Scholar]
- [33]. Valdez-Jasso, D. , Simon, M. , Champion, H. , and Sacks, M. , 2012, “ A Murine Experimental Model for the Mechanical Behaviour of Viable Right-Ventricular Myocardium,” J. Physiol., 590(18), pp. 4571–4584. 10.1113/jphysiol.2012.233015 [DOI] [PMC free article] [PubMed] [Google Scholar]
- [34]. Hessel, M. , Steendijk, P. , den Adel, B. , Schutte, C. , and van der Laarse, A. , 2006, “ Characterization of Right Ventricular Function After Monocrotaline-Induced Pulmonary Hypertension in the Intact Rat,” Am. J. Physiol. Heart Circ. Physiol., 291(5), pp. H2424–H2430. 10.1152/ajpheart.00369.2006 [DOI] [PubMed] [Google Scholar]
- [35]. Guccione, J. , McCulloch, A. , and Waldman, L. , 1991, “ Passive Material Properties of Intact Ventricular Myocardium Determined From a Cylindrical Model,” ASME J. Biomech. Eng., 113(1), pp. 42–55. 10.1115/1.2894084 [DOI] [PubMed] [Google Scholar]
- [36]. Hunter, P. , McCulloch, A. , and Ter Keurs, H. , 1998, “ Modelling the Mechanical Properties of Cardiac Muscle,” Prog. Biophys. Mol. Biol., 69(2–3), pp. 289–331. 10.1016/S0079-6107(98)00013-3 [DOI] [PubMed] [Google Scholar]
- [37]. Zhou, L. , Chen, Z. , Vanderslice, P. , So, S.-P. , Ruan, K.-H. , Willerson, J. T. , and Dixon, R. A. , 2013, “ Endothelial-Like Progenitor Cells Engineered to Produce Prostacyclin Rescue Monocrotaline-Induced Pulmonary Arterial Hypertension and Provide Right Ventricle Benefits,” Circulation, 128(9), pp. 982–994. 10.1161/CIRCULATIONAHA.113.003139 [DOI] [PubMed] [Google Scholar]
- [38]. Lubarda, V. A. , and Hoger, A. , 2002, “ On the Mechanics of Solids With a Growing Mass,” Int. J. Solids Struct., 39(18), pp. 4627–4664. 10.1016/S0020-7683(02)00352-9 [DOI] [Google Scholar]
- [39]. Kuhl, E. , Garikipati, K. , Arruda, E. M. , and Grosh, K. , 2005, “ Remodeling of Biological Tissue: Mechanically Induced Reorientation of a Transversely Isotropic Chain Network,” J. Mech. Phys. Solids, 53(7), pp. 1552–1573. 10.1016/j.jmps.2005.03.002 [DOI] [Google Scholar]
- [40]. Henkens, I. R. , Mouchaers, K. T. , Vliegen, H. W. , van der Laarse, W. J. , Swenne, C. A. , Maan, A. C. , Draisma, H. H. , Schalij, I. , van der Wall, E. E. , Schalij, M. J. , and Vonk-Noordegraaf,, A. , 2006, “ Early Changes in Rat Hearts With Developing Pulmonary Arterial Hypertension Can Be Detected With 3-Dimensional Electrocardiography,” Am. J. Physiol.-Heart Circ. Physiol., 293(2), pp. H1300–H1307. 10.1152/ajpheart.01359.2006 [DOI] [PubMed] [Google Scholar]
- [41].ABAQUS, Inc., 2014, “Abaqus Analysis User's Guide A. 6.14,” Dassault Systemes Simulia Corporation, Providence, RI. [Google Scholar]
Associated Data
This section collects any data citations, data availability statements, or supplementary materials included in this article.
Supplementary Materials
Supplemental PDF


