

Abstract
Homozygous deletion of methylthioadenosine phosphorylase (MTAP) is one of the most frequent genetic alterations in glioblastoma (GBM), but its pathologic consequences remain unclear. In this study, we report that loss of MTAP results in profound epigenetic reprogramming characterized by hypomethylation of PROM1/CD133-associated stem cell regulatory pathways. MTAP deficiency promotes glioma stem-like cell (GSC) formation with increased expression of PROM1/CD133 and enhanced tumorigenicity of glioblastoma cells and is associated with poor prognosis in GBM patients. As a combined consequence of purine production deficiency in MTAP-null GBM and the critical dependence of GSC on purines, the enriched subset of CD133-positive cells in MTAP-null GBM can be effectively depleted by inhibition of de novo purine synthesis. These findings suggest that MTAP loss promotes the pathogenesis of glioblastoma by shaping the epigenetic landscape and stemness of GBM cells while simultaneously providing a unique opportunity for GBM therapeutics.
Keywords: MTAP deletion, glioblastoma, cancer stem cells, epigenetics, methylation
INTRODUCTION
GBM is the most common and lethal primary malignant brain tumor. Homozygous deletion of the MTAP gene occurs in 50% of all GBM cases, rendering it one of the most frequent genetic alterations in GBM (1,2). MTAP is often co-deleted with the neighboring tumor suppressor gene, cyclin-dependent kinase inhibitor 2A (CDKN2A), lending to the perception of MTAP deletion as a passenger event. However, studies have shown that germline mutations in MTAP result in an autosomal-dominant bone cancer syndrome, and that MTAP knockout, independent of CDKN2A deletion, promotes lymphoma in mice (3–5). MTAP-deficiency has also been independently associated with poor clinical outcomes in patients of several cancer types (6–9).
MTAP is a metabolic enzyme functioning in the purine/methionine salvage pathway. It metabolizes methylthioadenosine (MTA), generated during polyamine biosynthesis, to eventually produce adenine and methionine, salvaging these metabolites for further use. Based on this function, therapeutic strategies have been developed to take advantage of MTAP loss for cancer treatment. One idea is that in MTAP-deficient tumor cells, the absence of the MTAP-dependent salvage pathway imparts susceptibility to inhibitors of purine synthesis and to methionine deprivation (10,11), or to toxic nucleotides (12). More recent studies revealed that MTA, which accumulates within and around cells in the context of MTAP loss, can inhibit the activity of several enzymes, including protein arginine methyltransferase 5 (PRMT5) (13–18). It has been proposed that MTAP deletion sensitizes tumor cells to PRMT5 inhibition, providing a potential avenue for targeted therapy against MTAP-deleted tumors (17–19). Despite these seemingly straight forward principles, the role of the loss of this metabolic enzyme in gliomagenesis remains unclear, and no derived therapeutic benefits have yet been realized.
Here, we utilize in vitro and in vivo GBM models to show that loss of MTAP results in dysregulation of the glioma cell epigenome and the promotion of glioma cell stemness. We demonstrate that targeting a metabolic liability of MTAP-null cells through inhibition of de novo purine synthesis specifically depletes the therapy-resistant, GBM stem-like cell (GSC) population. These results place MTAP loss at a nexus of aberrant DNA methylation and GBM cell stemness, two critical and consistently interconnected components of GBM pathogenesis (20), and provide a basis for exploiting purine starvation as a therapeutic strategy against MTAP-deficient GBM.
MATERIALS AND METHODS
Details and references for materials and methods can be found in the online Supplementary Information (SI).
Cell culture.
Primary tissue cultures were derived with consent from patient tumor samples obtained by the Duke Brain Tumor Center. These patient-derived cultures were maintained in human neural stem cell (NSC) media (STEMCELL, cat# 05751), supplemented with EGF, FGF, and Heparin and plated onto laminin coated plates. All experiments were performed within the first 20 passages. The human U251MG cell line (Sigma, cat #09063001) and the transformed astrocyte model (see below; Lonza, cat #CC-2565) were cultured using the same medium conditions. The U-138 MG (ATCC HTB-16) cell line was maintained in Minimum Essential Medium Eagle (Sigma cat #M4655), supplemented with 10% fetal bovine serum (FBS; Corning cat #35-010-CV), Sodium Pyruvate (Thermo cat #11360), and non-essential amino acids (Thermo cat #11140). All cell lines were maintained in a humidified atmosphere at 37°C and with 5% CO2. Cells were intermittently tested for Micoplasma at the Duke Cell Culture Facility and retested prior to in vivo experiments. Cell line authentication was performed on each cell line using short tandem repeat (STR) profiling to match derivative cell lines to parental primary tissue culture and to confirm the identity of MTAP knockout clones (U251MG). Cell lines and culture methods, plasmid construction, and generation of derivative cell populations are further described in the Supplementary Methods. Reprogramming and transformation of normal human astrocytes were performed as previously described (21). Briefly, cells were transformed with four previously defined core factors and cultured in NSC media with 3% FBS. Seven to ten days after initial transduction, cells were again transduced with CRISPR lentivirus for MTAP knockout or treated with DMSO (vehicle control) or the MTAP inhibitor, MTDIA. Cells were subsequently switched to FBS-free NSC media. Transformed astrocyte lines were transformed/derived independently from three different batches of primary human astrocytes (ordered within a span of three years). For cell differentiation analysis, tumor cells were plated in differentiation media and incubated for 7 to 10 days. Patient-derived GBM cells were cultured in human neural stem cell media (STEMCELL, cat# 05751) supplemented with EGF, FGF, and Heparin. Cells were treated with L-Alanosine at varying concentrations with or without added purines (adenine, adenosine, ATP) and dipyridamole. CCK8 (Dojindo) was used to quantify cell viability following in vitro drug treatment.
In vivo tumorigenesis and drug response.
Animal use and care protocol was approved by the Institutional Animal Care and Use Committee (IACUC). Orthotopic intracranial tumors were generated by directly injecting tumor cells into the right caudate nucleus. Mice were monitored for neurological symptoms and were sacrificed after either losing 20% body weight or becoming moribund. For tumors monitored by bioluminescent imaging, cells were transduced with retroviral luciferase prior to implantation and at the time of imaging mice were injected with 15mg/kg D-Luciferin and imaged on an IVIS Lumina XR imager. To measure in vivo drug response, treatment was initiated 4 weeks after tumor implantation. Mice received daily I.P. injections of L-Alanosine 225 mg/kg for the specified duration. Tumor response to treatment was monitored by bioluminescence on an IVIS Lumina XR imager and analyzed using Living Image software.
Methylation assays.
Genomic DNA was extracted using QIAamp DNA Mini Kit (QIAGEN, cat #51306) or Allprep DNA/RNA/Protein mini kit (Qiagen, cat #8004) following the manufacturer’s protocols. Concentration and purity of DNA was assessed by Nanodrop Lite and Qubit 2.0 Fluorometer (Life Technologies, CA).Bisulfite conversion of DNA and methylation array procedure were performed following protocols provided by the DNA Methylation kit and Illumina’s Methylation EPIC protocol. The Illumina MethylationEPIC array was processed following the manufacturer’s Infinium HD Methylation protocol. Methylation array data is uploaded to the GEO Repository. Accession number GSE130093, Title: MTAP loss promotes stemness and epigenetic reprogramming in glioblastoma. Methylation-specific PCR was done using methylation-sensitive restriction enzymes followed by real-time PCR for a quantitative DNA methylation assay.
Immunohistochemistry.
Brain tumor sections were stained using antibodies against CD133 or IgG isotype control on the Leica Bond RXM automated system. Stained slides were scanned using the Vectra automated pathology imaging system (PerkinElmer) and positive cells were quantified using inForm software (PerkinElmer).
Flow Cytometry.
Cells were stained for surface CD133 with an anti-CD133 antibody (AC133, Miltenyi), or with the isotype control, conjugated to either the PE or APC fluorophore. Flow cytometry was performed on a BD FACSCalibur cell analyzer. For treatment response, cells were treated with varying concentrations of L-Alanosine for 72 hours after which cells were stained using isotype control, anti-CD133, or Annexin V and analyzed with the BD FACSCalibur flow cytometer.
Preparation of RNA, RT- qPCR, and gene expression microarray.
RNA extraction and RT-PCR assays were performed following standard molecular biology protocol. Gene expression microarray analysis was performed using the Affymetrix Human Genome U133 Plus 2.0 array by the Duke Sequencing and Genomic Technologies Shared Resource. Data was analyzed using the Affymetrix Expression Console and Affymetrix Transcriptome Analysis Console v3.0 software. Samples were analyzed using the Affymetrix Human Genome U133 Plus 2.0 array. Data is uploaded to the GEO Repository. Accession number GSE114867, Title: Expression data from patient-derived primary glioblastoma cell lines.
Clonality Assays via Southern Blots
Genomic DNA prepared from normal human blood, and from control and MTDIA-treated (3 µM, 10 weeks) transformed astrocytes (OMRP) were used for southern blot analysis. 30 µg of genomic DNA were digested overnight at 65 degrees Celsius by BstEII (NEB). Electrophoresis of the digested DNA was performed on a 0.7% TBE gel. Southern blot was performed using DIG high Prime DNA Labeling and Detection Starter Kit II (Roche, Cat# 11585614910), following the manufacturer’s instruction.
Data analysis and statistical analysis.
All TCGA data was downloaded from the online portal https://tcga-data.nci.nih.gov/docs/publications/tcga/ and through cbioportal.org. The most recently published 2013 GBM data set was used for all analyses. We included all GBM cases that lack secondary GBM-associated IDH1/2 mutations, which are independent determinants of epigenetic and gene expression profiles in GBM (22,23). Pathway analysis was done using the Database for Advanced Visual and Integrated Discovery (DAVID) 6.8 platform at david.ncifcrf.gov. P-values were corrected for multiple comparisons using the Benjamini-Hochberg method for lowering the false discovery rate. The Benjamini-Hochberg calculation was performed in DAVID using the default EASE score (modified Fisher’s exact P-value) ≤ 0.1. The Benjamini Hochberg FDR adjusts for multiple comparisons using the rank of the p value, the total number of comparisons, and (in the DAVID platform) the EASE score (0.1) and a minimum requirement of 2 genes per term. Additional statistical tests were performed using Graphpad Prism (t tests, log rank test for Kaplan-Meier curves, ANOVAs) and Statgraphics Centurion (ANOVA, Kruskal Wallis, Mann Whitney U).
RESULTS
MTAP loss promotes the genesis of glioma stem-like cells in an astrocyte model of transformation
To explore the effect of MTAP loss on gliomagenesis we utilized a recently developed model of astrocyte transformation (21). We transduced primary human astrocytes with four previously defined reprogramming/ transforming factors: Oct4, Myc(T58A), H-ras(G12V), and p53DD (21). Cells in the process of transformation were transduced with lentiviral CRISPR/CAS9 targeting MTAP, or were exposed to methylthio-DADMe-Imunicillin A (MTDIA), a specific small molecule inhibitor of MTAP enzymatic activity (24) (Supplementary Figs. S1A–F). The initial in vitro reprogramming/transformation led to the rapid expansion of tumor cells with morphological and growth characteristics described previously (21) (Supplementary Fig. S1A). We found, however, that MTAP deficient cells had more potent sphere-forming capabilities compared to the control cells (25) (Fig. 1A; Supplementary Fig. S1G), and displayed heightened resistance to temozolomide (Fig. 1B). Furthermore, intracranial implantation of the transformed astrocytes into immune compromised mice confirmed that MTAP deficient cells had increased tumorigenic potential in vivo (Fig. 1C; Supplementary Figs. S1H and I). The enhanced sphere forming capability, chemoresistance, and tumorigenesis of MTAP deficient transformed astrocytes are all characteristic features of glioma stem-like cells (GSCs) (21,26–29). GSCs are a subset of tumor cells believed to contribute to therapeutic resistance and tumor recurrence (28), and are associated with poor clinical outcomes in GBM patients (30). To test whether the stem-like cell population of transformed astrocytes was promoted by MTAP deficiency, we stained for cell surface marker CD133, which is considered one of the principle markers of GBM stem-like cells (28,29,31,32), and is required for GSC maintenance (33). Flow cytometry revealed that MTAP knockout and MTDIA treatment both resulted in higher CD133 expression on the cell surface compared to control (Fig. 1D; Supplementary Figs. S2A–E).
Figure 1. MTAP loss in transformed astrocytes promotes tumorigenic, CD133-positive cells.
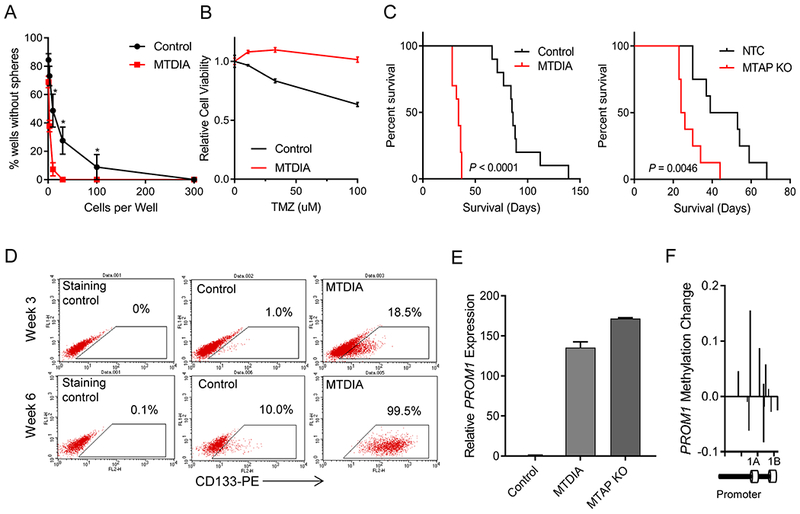
(A) Long-term MTAP inhibition with MTDIA results in cells with greater sphere-forming capacity. Average of 3 experiments is shown and error bars denote SEM. Stem cell frequency calculated by Extreme Limiting Dilution Analysis (ELDA) shows stem cell frequency in MTDIA treated cells of 1/3.82 cells (95% Confidence Interval 1/2.94-1/5.03) and in control cells is 1/21.95 (95% Confidence Interval 1/16.34-1/29.55), chisq = 78.3, P = 8.8×10⁻¹⁹ (B) Transformed astrocytes that had been transformed with or without MTDIA in the culture media were treated with varying doses of temozolomide for 3 days and cell viability was measured by CCK8 (n=6, ANOVA P value < 1×10⁻⁴). (C) Left: Kaplan-Meier survival curves show increased tumorigenicity of astrocytes treated with MTDIA during the process of transformation with OMRP (transformation #1) in nude mice (log-rank P value < 1×10⁻⁴). Right: CRISPR-mediated genetic knockout of MTAP in astrocytes during transformation (transformation #6), also results in increased tumorigenic potential (log-rank P value = 0.0046). (D) Flow cytometry measurement of CD133 expression shows progressive increase following astrocyte transformation that is enhanced by MTAP inhibition with MTDIA. (E) MTAP knockout or treatment with MTAP inhibitor MTDIA resulted in increased PROM1 transcription measured by RT-PCR at 6 weeks after transformation (F) Methylation of PROM1 promoter in parental transformed astrocytes relative to MTDIA treated astrocytes measured by the MethylationEPIC array. Control astrocytes maintain higher PROM1 methylation levels than MTDIA treated cells.
The increased fraction of CD133-positive cells in our MTAP-deficient transformed astrocytes was accompanied by elevated levels of PROM1 transcription, the gene encoding CD133 (Fig. 1E; Supplementary Fig. S2F). To better understand the mechanisms underlying these changes in gene expression, we used a DNA methylation array (Illumina MethylationEPIC) to measure 5-methyl-cytosine (5mC) at 850,000+ sites across the genome. We initially focused our attention on the PROM1 promoter region, which revealed MTAP-null astrocytes expressing higher levels of PROM1 also had reduced levels of DNA methylation in the PROM1 promoter (Fig. 1F, Supplementary Figs. S2G and H). This is consistent with previous studies demonstrating that PROM1 expression can be regulated by epigenetics (34,35). We also observed that the CD133-positive cell population gradually increased over a course of several weeks (Supplementary Figs. S2A–F), in accordance with time-dependent DNA methylation reprogramming of glioma cells (23). Furthermore, MTAP deletion and inhibition both resulted in homogenous populations of CD133-positive cells that express CD133 at a level far above what was observed in the starting populations, arguing against selective depletion of the initial CD133-low or CD133-negative cells (Supplementary Figs. S2B and D). Clonality assays demonstrated the presence of a heterogeneous population of cells, suggesting the high CD133-positive population was unlikely due to selection of single or oligo-clonal populations (Supplementary Fig. S2I).
We next compared broader methylation differences between cells with or without MTAP by analyzing differentially methylated genetic loci using the Database for Annotation, Visualization, and Integrated Discovery (DAVID) platform. Kyoto Encyclopedia of Genes and Genomes (KEGG) pathway enrichment analysis with Benjamini Hochberg FDR corrected p-values revealed significant enrichment of hypomethylated gene CpG islands in the KEGG pathways regulating pluripotency of stem cells, suggesting that the PROM1 promoter methylation change was part of a larger reprogramming process (Supplementary Figs. S3A–C), consistent with the known role of epigenetic dysregulation in determining brain tumor cell identity (20,36).
MTAP loss of function reshapes the identity of glioblastoma cells
To further assess the pathogenic impact of MTAP loss in GBM, we established genetic gain- or loss-of-MTAP-function models using GBM cell lines and patient-derived primary GBM cultures (Supplementary Figs. S4A–H). Consistent with what we found in the transformed astrocyte model, MTAP restoration resulted in decreased sphere-forming capacity (Fig. 2A) (25). Furthermore, orthotopic injection of patient-derived GBM cells into immune-compromised mice revealed more potent tumorigenicity in MTAP-deficient GBM cells compared to cells in which MTAP function had been restored (Wilcoxon P value < 1×10⁻⁴; Fig. 2B). We then analyzed gene expression in these cell models by microarray and observed that MTAP status consistently affects the expression of a large number of genes (Fig. 2C; Supplementary Table 1) involving pathways critical to cancer cells (37). In particular, we found significant overlap between pathways upregulated following MTAP loss and pathways known to be upregulated in GSCs (38), including focal adhesion, regulation of actin cytoskeleton, and gap junctions (Fig. 2C).
Figure 2. MTAP deletion promotes tumorigenesis and alters gene expression in GBM cells.
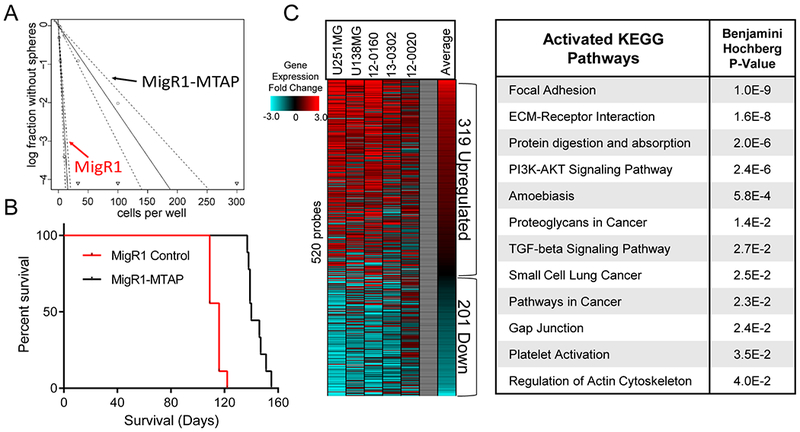
(A) Restoration of MTAP in patient derived GBM cells (13-0302) results in reduced sphere forming capacity, MigR1-Control stem cell frequency is 1/3.68 cells (95% Confidence Interval: 1/2.83 to 1/4.84), MigR1-MTAP stem cells frequency is 1/44.18 cells (95% Confidence Interval: 1/32.91 to 1/59.36), Chi square = 138, P value = 5.76×10⁻³², analyzed using Extreme Limiting Dilution Analysis (ELDA). (B) Restoration of MTAP expression in MTAP-null patient-derived GBM cells (13-0302) resulted in prolonged survival (140 vs 116 days median survival) after intracranial transplantation into immunocompromised (NSG) mice (n=9 animals per arm, Wilcoxon test P value < 1×10⁻⁴). (C) Heatmap showing relative gene expression fold change in MTAP-null cells compared with MTAP-expressing cells of each of the indicated isogenic cell pairs. Included are 520 genes with significantly different expression across all 5 isogenic cell pairs. Right: DAVID analysis of upregulated genes (319 probes) in MTAP-null cells shows significant enrichment of numerous activated KEGG pathways.
Analysis of PROM1 expression by microarray and real-time reverse transcription polymerase chain reaction (RT-PCR) demonstrated an inverse correlation between PROM1 and MTAP expression in patient-derived GBM models (Fig. 3A; Supplementary Fig. S5A), supporting the findings from transformed astrocytes. Flow cytometry analysis of these GBM cell lines confirmed correlation of PROM1 transcription and CD133 expression, with reduction of CD133 positive cells after MTAP restoration and upregulation of CD133 after MTAP knockout (Fig. 3B; Supplementary Figs. S5B and C). Finally, immunohistochemical staining of orthotopic xenograft tissue samples verified an inverse correlation between MTAP expression and CD133 levels in vivo (Fig. 3C).
Figure 3. MTAP deletion is associated with altered expression of CD133 and stemness markers in GBM cells.
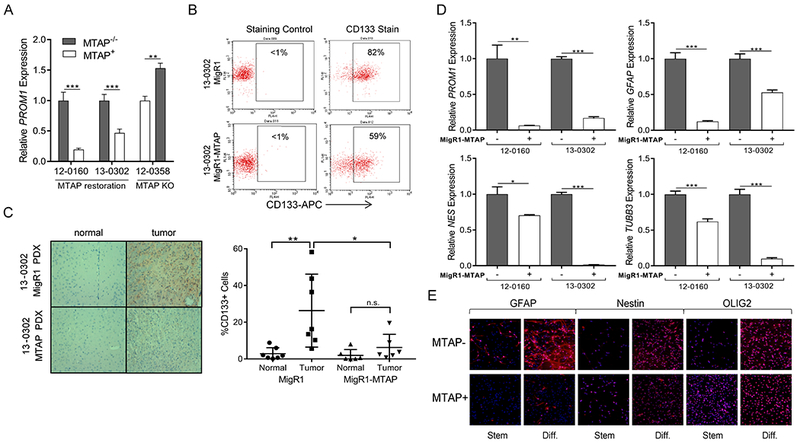
(A) Restoration of MTAP in MTAP null GBM cells resulted in significantly decreased PROM1 transcription and MTAP knockout in MTAP WT GBM cells resulted in PROM1 transcription upregulation (n≥6, t test P value **<.005, ***<5×10⁻⁴. (B) Flow cytometry confirmed decreased surface CD133 expression following MTAP restoration. (C) Immunohistochemistry of CD133 in GBM xenografts showed that differential CD133 expression based on MTAP status was maintained in vivo. Representative images (left) and quantification of individual slides (right) are shown (n=6 slides from 3 separate xenografts, t test P value **<.01, *<.05, error bars show standard deviation). (D) Patient-derived GBM cell lines were cultured in differentiation culture conditions and the indicated markers of cell stemness and lineage were measured. (data from two independent experiments, t test P value *<.05, **<.005, ***<5×10⁻⁴, n.s. = not significant, error bars = SEM). (E) Immunofluorescence of selected stemness markers in 12-0160 patient-derived isogenic GBM cell lines confirms RT-PCR result demonstrating the ability of MTAP null cells to differentiate into multiple lineages.
While sphere-forming capacity and tumorigenic potential are important features of glioma stem cells, another key characteristic of GSCs, like other stem cells, is the ability to differentiate into multiple lineages (28). To explore the differentiation capability of MTAP-null GBM cells, we measured brain cell stemness/lineage markers in differentiation culture media. Under differentiation conditions, MTAP-null GBM cells expressed elevated levels of lineage progenitor markers for astrocytic, neuronal, and oligodendroglial cells compared to their MTAP-expressing counterparts, while also maintaining higher PROM1 expression levels (Fig. 3D and E). Gene expression analysis of these same lineage markers in patient-derived GBM cells under stem cell culture conditions showed that in the absence of differentiation factors these lineage markers are suppressed in MTAP null cells, with the exception of PROM1 and GFAP (Supplementary Figs. S5D and E). While the ability to express markers of multiple lineages under differentiation conditions is consistent with characteristics of stem cells, it should be emphasized that GSCs are not normal stem cells. Studies comparing glioblastoma derived stem cells to genetically normal stem cells have shown considerable epigenetic and gene expression differences, with one such difference being upregulation of glial marker GFAP in GSCs, which we observed following MTAP loss in GBM cell lines (Fig. 3D and E) (38,39). Nevertheless, the impact of MTAP loss on GBM stem-like cells’ differentiation properties requires additional investigation to be fully understood.
TCGA microarray data support the findings from in vitro cell models with differential expression of several stemness and differentiation marker genes based on MTAP expression in tumor samples (Fig. 4A and B). MTAP expression was negatively correlated with expression of numerous brain lineage marker genes including SOX2, OLIG2, PROM1, NES, GFAP, and PAX6, and was positively correlated with BMP4, MCM2, and MYC. Interestingly, though MYC and PROM1 expression were not positively correlated in this data set (Supplementary Fig. S6A), MYC is known to bind to the PROM1 promoter region and positively regulate PROM1 transcription (34), representing a potential mechanism for increasing PROM1 expression in MTAP-intact tumor cells. Together, these results demonstrate that MTAP loss affects the expression of cell lineage marker genes and contributes to shaping GBM cell identity and differentiation capability. When we analyzed gene expression differences more broadly between samples categorized by MTAP expression, we found additional changes in gene expression across the genome (572 genes, Bonferroni-corrected t test P value < 4×10⁻⁶; Supplementary Table 2). Of the genes that were differentially expressed between the low vs high MTAP-expressing samples, the vast majority were upregulated in MTAP deficient samples and were enriched for the “glioma” KEGG pathway (P =.017) (Fig. 4C and D). Finally, in order to confirm relevance of MTAP loss to pathogenesis, we analyzed survival of GBM patients and found that GBM patients with MTAP deletion have significantly reduced disease-free survival compared to patients with intact MTAP (Fig. 4E) (log-rank P value = 0.012). This association with poor clinical outcome in GBM patients is independent of frequently co-altered genes, including CDKN2A and EGFR (Fig. 4E; Supplementary Figs. S6B–D).
Figure 4. MTAP expression is correlated with altered gene expression profiles and decreased survival in GBM patients.
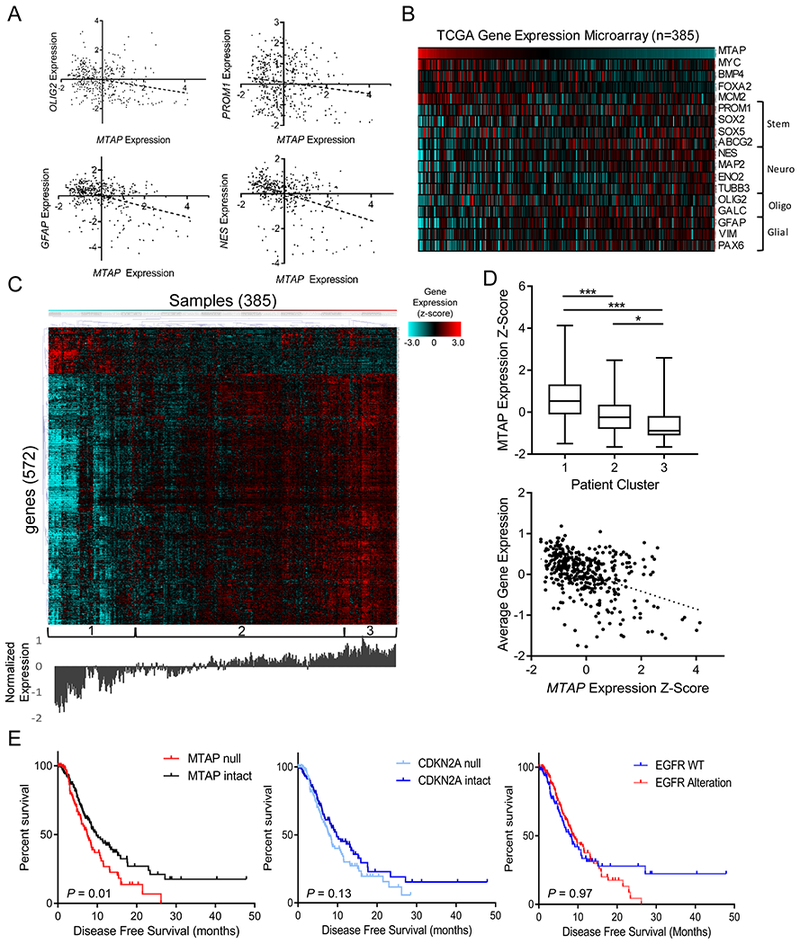
(A) Gene expression data from TCGA shows significant correlation between MTAP expression and various stemness/differentiation markers (n=385; OLIG2 R2 = 0.06, P value < 1×10⁻⁴; PROM1 R2 = 0.02, P value = 0.005; GFAP R2 = 0.16, P value < 1×10⁻⁴; Nestin R2 = 0.17, P value < 1×10⁻⁴). (B) Heatmap showing expression of MTAP and assorted stemness/differentiation genes from TCGA gene expression dataset, n=385 samples. (C) Heatmap showing gene expression (z-score) of the most differentially expressed genes between low– and high–MTAP-expressing cases in TCGA GBM dataset. Genes were selected using a t test comparing the expression of 12,400 genes available in the Affymetrix microarray platform between 33% of patients with lowest MTAP expression (128 patients) and 33% of patients with highest MTAP expression and selecting all genes with a P value <4×10⁻⁶. Unsupervised hierarchical clustering revealed clusters labeled at the bottom. Average expression level for the included genes is shown below the heatmap. (D) Average MTAP expression (top) was calculated for the 3 clusters labeled in (c) with a t test P value ***<.001, *<.05, whiskers show min to max. A simple regression analysis (bottom) shows a significant correlation between MTAP expression and overall gene expression levels in this gene set (R2 = 0.19, P value = 2.2×10⁻¹⁶). (E) Data from 281 TCGA GBM patients shows a significant decrease in progression-free survival among patients with MTAP deletion (left, log-rank P value = 0.01, median survival 7.4 vs 9.7 months) but not with CDKN2A deletion (middle, log-rank P value = 0.13) or EGFR amplification (right, log-rank P value = 0.97). See Supplementary Fig. S6 for mutation co-occurrence.
MTAP loss shapes the DNA methylation landscape in glioblastoma cells
The upregulated genes and pathways we identified in MTAP-null, patient-derived GBM cells (Fig. 2C) were previously reported to be methylation-sensitive (40), prompting additional analysis of DNA methylation as a potential mechanism. Specific examination of the PROM1-associated methylation loci in GBM cell models confirmed that MTAP restoration results in increased methylation in the PROM1 promoter region (Fig. 5A; Supplementary Fig. S7A), consistent with the finding from transformed astrocytes. Analysis of general methylation patterns in the matched GBM isogenic cell lines revealed overall hypomethylation in MTAP-null cells compared to MTAP-expressing controls (Fig. 5B and C; Supplementary Figs. S7B–D). These global changes in DNA methylation were correlated with altered gene expression as demonstrated by an integrative analysis of methylation and gene expression array data (Fig. 5D; Supplementary Figs. S7E and F). Furthermore, analysis of genes with differential methylation in CpG islands revealed enrichment of hypomethylated loci in the KEGG pathway regulating pluripotency of stem cells (Benjamini-Hochberg P value 0.049), the only significantly enriched pathway (Supplementary Fig. S8A).
Figure 5. MTAP deletion results in functional DNA methylation changes.
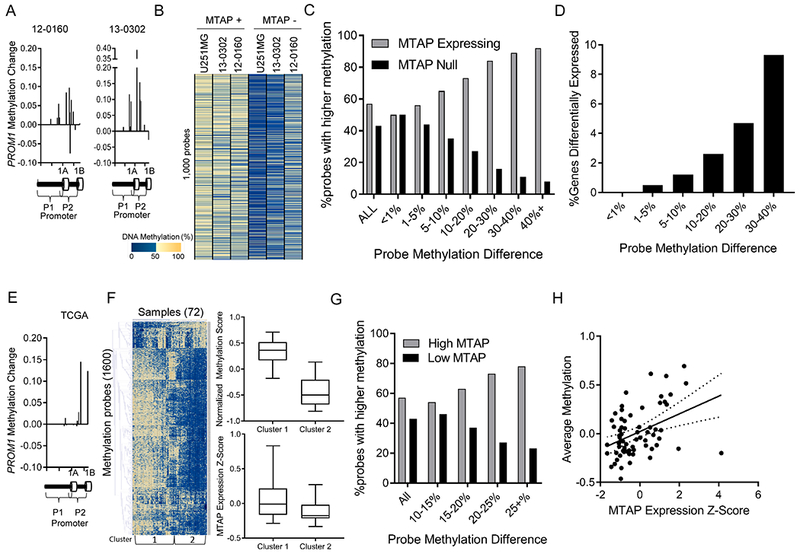
(A) Methylation probes in the PROM1 promoter have increased methylation beta value after MTAP restoration in GBM cell lines. (B) Analysis of the most differentially methylated loci between isogenic in vitro cultures measured by the MethylationEPIC 850k array shows a pattern of hypomethylation in MTAP-null cells. (C) Genes were sorted into bins based on the average methylation difference between MTAP-expressing and MTAP-null isogenic cell pairs (12-0160, 13-0302, U251MG). Bars represent the percent of probes in each bin represented by either the MTAP-expressing (grey) or MTAP-null (black) cell. Genomic loci with a high methylation difference between isogenic pairs are more likely to be hypomethylated in MTAP null cells. (D) Percentage of genes with greater than 2-fold expression change based on degree of methylation change (x-axis) following change of MTAP status in isogenic cell pairs. (E) Analysis of the PROM1 promoter in TCGA dataset using the illumina 450k methylation array shows higher methylation in samples with high MTAP expression compared to samples with low MTAP expression, n=72 samples. (F) Heatmap shows 1,600 methylation probes selected using a t test comparing the 24 patients with lowest MTAP expression to the 24 patients with highest MTAP expression (N=72 patients total). All probes with a Bonferroni-corrected P value < 4×10⁻⁶ were included, without direction bias. Unsupervised hierachical clusters were analyzed for average methylation across all genes (top right, t test P value < 1×10⁻⁶) and for average MTAP gene expression (bottom right, Kruskal-Wallis P value < 1×10⁻⁴). (G) Methylation 450k array data from 72 TCGA patients. For each CpG locus, average methylation between the 24 patients with lowest MTAP expression was compared with average methylation of 24 patients with highest MTAP expression. (H) Methylation values for all CpGs that have at least a 15% differential methylation identified in panel G were averaged together for each of the 72 samples and compared with MTAP expression, showing a significant positive correlation between MTAP expression and DNA methylation (correlation coeffecient = 0.44 , R2 = 0.19 , P value = 3×10⁻⁴).
Analysis of TCGA methylation data further corroborated the link between MTAP expression, DNA methylation, and pathways governing stem-like cancer cells. First, we again observed elevated methylation of loci clustered in the promoter region of PROM1 in GBM samples with high MTAP expression (Fig. 5E). Second, similar to our in vitro models, genome-wide analysis of differentially methylated loci between low– and high–MTAP-expressing samples revealed hypomethylation in low–MTAP-expressing cases (Fig. 5F and G; Supplementary Table 3). Regression analysis of the most differentially methylated loci between low–MTAP- and high–MTAP-expressing GBM cases revealed a positive correlation between DNA methylation and MTAP expression (correlation coefficient=0.44, R2 = 0.19, P value = 3×10⁻⁴) (Fig. 5H). Analysis of CpG-islands in low-MTAP samples again demonstrated hypomethylation of genes in KEGG pathways regulating pluripotency of stem cells (Supplementary Figs. S8B and C). Collectively, these findings from GBM patients support that loss of MTAP expression results in an altered DNA methylation landscape that specifically influences pathways regulating GBM cell stemness and differentiation.
Recent biochemical studies identified PRMT5 to be potently inhibited by MTA accumulation in tumor cells following MTAP loss (17,18). Notably, PRMT5 is an arginine methyltransferase responsible for the repressive histone methylation mark histone H4 arginine 3 dimethylation (H4R3me2s), which has been reported as necessary for the recruitment of DNMT3A to maintain DNA methylation in the β-globin locus (41). To test if PRMT5 is involved in the link between MTAP loss and altered DNA methylation and GBM cell identity, we utilized a small molecule specific inhibitor of PRMT5, EPZ015666. First, we confirmed that absence of MTAP or the presence of EPZ015666 both resulted in reduced H4R3me2s levels, illustrating functional inhibition of PRMT5 (Supplementary Figs. S9A–C). We found that sustained PRMT5 inhibition rescued PROM1 expression in a dose-dependent fashion following MTAP restoration in GBM cell lines and similarly caused dose-dependent upregulation of PROM1 transcription in transformed astrocytes (Supplementary Fig. S9D). This transcription upregulation was accompanied by a gradual increase of CD133 surface expression in transformed, MTAP-intact astrocytes (Supplementary Figs. S9E and F). Analysis of DNA methylation following EPZ015666 treatment in MTAP wildtype U251MG and transformed astrocyte tumor models showed hypomethylation globally (Supplementary Fig. S10A), in the PROM1 promoter region (Supplementary Fig. S10B) and in CpG islands of KEGG signaling pathways regulating pluripotency of stem cells (Benjamini-Hocberg P value 3.5×10⁻³) (Supplementary Figs. S10C and D). These results suggest the effect of MTAP status on DNA methylation and altered cellular identity likely involves chronic PRMT5 inhibition, a natural consequence of MTAP loss (17–19), though it is highly probable that other mechanisms also exist. Further work is required to fully illuminate the effect of PRMT5 inhibition on MTAP-intact and MTAP-null GBM cells, especially given the potential of PRMT5 as a therapeutic target (42).
CD133-positive cells are preferentially targeted by inhibition of de novo purine synthesis in MTAP-null GBM
The promotion of CD133-positive, stem-like GBM cells after loss of MTAP function prompted us to explore the feasibility of leveraging MTAP loss as a therapeutic vulnerability in these cells. MTAP-deficient tumor cells lack purine salvage capability, making them more vulnerable to inhibition of de novo purine synthesis, a principle that has been validated in several non-GBM cell line models (12). We first tested this principle in GBM cultures and found that, indeed, compared to MTAP-expressing cells, MTAP-deficient GBM cultures were more sensitive to single agent treatment with L-Alanosine (alanosine), an inhibitor of the enzyme adenylosuccinate synthetase (ADSS), which carries out the penultimate step in adenosine synthesis (43) (Fig. 6A). To confirm that alanosine-mediated inhibition of GBM cell growth was due to “purine starvation” rather than to off-target effects, we treated MTAP-null GBM cultures with alanosine in the presence of exogenous purine supplementation and found that purine nucleosides in the media protected GBM cells from alanosine-mediated growth inhibition (Fig. 6B). Furthermore, the protective effects of exogenous adenosine or ATP could be effectively attenuated by inhibitors of equilibrative nucleoside transporters (ENTs), through which extracellular adenosine crosses the cell membrane (44) (Fig. 6C). Finally, the nucleotide analog 5’ deoxyadenosine (5’ dAdo), an MTAP substrate that allows for MTAP-dependent replenishing of the purine pool, effectively protected MTAP-intact GBM cultures but not MTAP-null cells from L-alanosine (Fig. 6D and E).
Figure 6. Purine deprivation therapy targets MTAP-null, CD133-positive GBM cells.
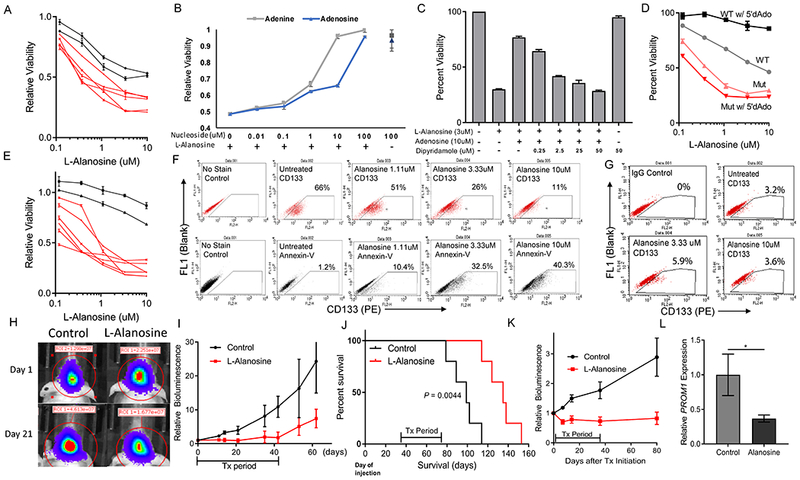
(A) L-alanosine dose response curves were measured for 7 different patient-derived GBM cell lines, showing differential sensitivity to L-Alanosine based on MTAP status. Red lines = MTAP deleted, Black lines = MTAP WT. Cell viability is measured by CCK8. (B) Supplementation of culture media with exogenous purines (adenine or adenosine) rescues MTAP-null 13-0302 cells from L-alanosine toxicity. (C) Inhibition of purine ENT1/2 transporters with dipyridamole blocks adenosine-mediated rescue of L-alanosine treated 13-0302 cells. (D) Differential sensitivity to L-alanosine conferred by MTAP status is magnified with the addition of exogenous MTAP substrate 5’dAdo. MTAP deleted cells (12-0160) shown in red, MTAP wildtype cells (12-0358) shown in grey/black. (E) L-Alanosine + 5’dAdo (30uM) treatment of the same cell lines shown in panel A, with cell viability measured by CCK8. (F) MTAP-null 13-0302 cells were treated with L-alanosine for 3 days then stained with PE-conjugated anti-CD133 antibodies or PE-conjugated Annexin V and quantified by flow cytometry. Flow cytometry shows that L-Alanosine specifically depletes CD133+ cells in a dose-dependent fashion (top), and induces apoptosis as measured by Annexin V quantification (bottom). (G) MTAP WT 12-0358 cells were treated with the indicated doses of L-Alanosine for 3 days and stained with PE-conjugated anti-CD133 antibodies. (H) Representative images of 12-0160 intracranial xenograft tumor response to L-Alanosine (225 mg/kg, i.p.) on day 21 of treatment, measured by bioluminescence. (I) Average bioluminescent values for 12-0160-luciferase intracranial xenografts, n=5 mice per arm. Treatment was started 35 days after cell injection. Mice were treated with i.p. L-Alanosine daily for 42 days. First sacrifice of control animals corresponds with the last day of treatment (day 42), subsequent data points on this control curve are skewed downwards because of loss of bioluminescent signal from sacrificed animals, ANOVA P-value = 0.0009. (J) Kaplan-Meier curves showing prolonged survival of alanosine-treated animals from panel I. Median Survival = 99 vs 135 days, log-rank P-value < 0.0044. (K) Average bioluminescence values showing response of 13-0302 intracranial xenografts to L-Alanosine (225mg/kg), n=7 animals per arm. Treatment began 15 days after cell injection and mice were treated for 35 days (ANOVA P-value < 1×10⁻⁴). (L) PROM1 expression was measured by RT-PCR using RNA from L-Alanosine-treated 12-0160 intracranial xenograft tissue (n = 6 samples per condition, each sample was measured in triplicate in 2 independent experiments, P < 0.05).
Validation of the purine starvation principle in MTAP-null GBM cells and the finding that MTAP loss potentiates GBM stem-like cells, together with the recent discovery that purine synthesis is especially important for maintenance of GSCs (45), led us to hypothesize that the CD133-positive subset of tumor cells in MTAP-null GBM cultures may have enhanced sensitivity to purine starvation. Indeed, treatment of MTAP-null but not MTAP-intact GBM cultures with L-alanosine preferably depletes the CD133-positive subpopulation of cells in a dose-dependent manner (Fig. 6F and G; Supplementary Fig. S11A), a process that is accompanied by an increased fraction of apoptotic cells. Supplementation of the culture media with exogenous purines rescued the CD133-positive cells, confirming the cause of cell depletion was purine starvation (Supplementary Fig. S11B). To further test this purine deprivation strategy in vivo, we established orthotopic xenografts using MTAP-null, patient-derived GBM cultures in nude mice, and treated the mice with L-alanosine as a single agent. We found that a six-week treatment regimen was well-tolerated by mice and effectively suppressed tumor progression in vivo as monitored by bioluminescence and animal survival (Fig. 6H–J; Supplementary Figs. S11C and D). Of note, we observed a more durable suppression of tumor growth when treating a cell line with a higher fraction of CD133-positive cells (66% in 13-0302 vs 16% in 12-0160 by flow cytometry) (Fig. 6K), consistent with the idea that CD133-positive cells have heightened sensitivity to purine starvation. Importantly, gene expression analysis of xenograft tumor samples demonstrated reduced PROM1 expression following alanosine treatment (Fig. 6L), confirming that CD133-positive GBM cells are uniquely susceptible to purine starvation in the in vivo tumor microenvironment. All together, these results support that MTAP loss provides an opportunity for exploiting purine starvation as a therapeutic intervention in GBM.
DISCUSSION
In summary, we show that loss of MTAP, a metabolic enzyme, shapes the DNA methylome landscape and affects the identity/stemness of GBM cells. The finding that MTAP can act as such a profound regulator of epigenetic dynamics has broad implications for our understanding of the functional interplay between metabolism and epigenetics in cancer cells. In this regard, the effect of MTAP status on the DNA methylome is reminiscent of the effects of mutations in other metabolic genes (such as IDH1/2, FH, and SDH) in glioma and other cancer types. While the cellular contexts and outcomes are different, in each case a mutated metabolic enzyme induces the accumulation of aberrant metabolites, which in turn act on epigenetic regulators to alter the DNA methylome landscape (22,23,46,47). This study thus provides a new example supporting the emerging concept of aberrant metabolism-induced epigenetic alterations in tumor cells (48,49) and highlights the possibility of yet other metabolic alterations contributing to aberrant epigenetic regulation as previously speculated (50). We note that the distinct mediators underlying the spectrum of effects associated with MTAP loss are likely far more complicated than any single factor. The mechanistic roles of the inhibition of PRMT5, as well as other biochemical consequences of MTAP loss, including altered metabolic flux, compromised activity of additional methyltransferases, and perturbed regulation of polyamine pathways (of which MTA is a byproduct), remain to be explored in future studies.
The novel link shown here between MTAP loss, altered DNA methylation, and stem-like GBM cells provides mechanistic support for a role of MTAP loss in GBM pathogenesis, as aberrant DNA methylation is a key feature of cancer cells (20,51–54), and the expression of CD133 is associated with poor clinical outcomes in GBM patients (30). Stem-like tumor cells have been extensively characterized and are well accepted as a major culprit in GBM pathogenesis and in tumor resistance to chemo- and radiotherapy (28,29). We note that while PROM1 expression defines stem cells that can give rise to cancer in various organs (55), and CD133 (AC133) is a well-established protein marker of GBM stem-like cells (32), a wide range of additional protein markers have been identified, each associated with distinct cellular characteristics, cellular origins, and cellular hierarchy (28). Thus, MTAP loss may potentiate only certain aspects or sub-types of stem-like GBM cells, and further studies in additional GBM pathogenesis models will be required to fully elucidate this link. Nevertheless, while many factors regulate the homeostasis of GSCs (28,56), the results described here support that loss of MTAP, one of the most common genetic alterations in GBM, contributes to the genesis and/or maintenance of these stem-like cancer cells and is involved in regulating their characteristics in GBM pathogenesis.
Finally, we stress that although MTAP loss may potentiate GBM development, it also provides a unique and promising opportunity for exploiting novel therapeutic strategies against this disease. While the straightforward principle of purine starvation has previously been tested in several cancer cell lines and even in a clinical trial for some MTAP-deleted cancers outside the brain with therapeutic promise unrealized (43), we here establish the proof-of-principle for potential therapeutic efficacy in GBM using intracranial models. The increased efficacy of alanosine against the intracranial xenograft models in this study compared to subcutaneous tumors in previous studies may have to do with purine availability in the tumor microenvironment and unique purine metabolism in the brain. Previous studies have shown that circulating adenine is lower in the brain than in peripheral tissues and plasma (57), perhaps underlying the unique efficacy of purine deprivation in the intracranial environment. Notably, the protective effect we demonstrated from extracellular purines in vitro suggests that the previously observed lack-of-benefit in other cancer types in peripheral tissues could be due to tumor rescue by purines in the tumor microenvironment (43), and that blocking nucleotide transporters and/or implementing dietary interventions (e.g., low purine diets) could potentially be exploited in future studies aiming to optimize purine deprivation-based cancer treatment. In the case of GBM, our finding that a single, low-toxicity purine synthesis inhibitor leads to extended survival and preferably depletes the CD133-positive subset of GBM cells is noteworthy. Given the prominent role of stem-like tumor cells in GBM pathogenesis and resistance to treatment (28–30), the finding that this subset of GBM cells is potentiated by MTAP loss, yet is particularly vulnerable to purine starvation, suggests that purine deprivation-based therapy may be a uniquely suitable strategy for treatment of MTAP-null GBM.
Supplementary Material
Significance:
This study links the frequently mutated metabolic enzyme MTAP to dysregulated epigenetics and cancer cell stemness and establishes MTAP status as a factor for consideration in characterizing GBM and developing therapeutic strategies.
ACKNOWLEDGEMENTS
This work was supported by a National Cancer Institute National Research Service Award (F30CA206336; L. Hansen), a National Comprehensive Cancer Network Young Investigator Award (Y. He), and the National Institute of Neurological Disorders and Stroke of the NIH, Award Number R01NS101074 (Y. He). This work was also supported by funding from an NIH P30 Cancer Center Support Grant to Duke Cancer Institute (Grant ID: NIH CA014236), and an NIH Duke SPORE in Brain Cancer grant (P50 CA190991), as well as grants from the Circle of Service Foundation (Y. He), and the Southeastern Brain Tumor Foundation (Y. He). We thank Dr. Chuan-Yuan Li for providing plasmids and guidance for the astrocyte transformation model, Ping Fan of the Duke Cancer Institute’s Pharmacokinetic/Pharmacodynamic core laboratory for the LC-MS/MS metabolite analysis, Heather Hemric, Laura-Leigh Rowlette, and Holly Dressman of the Duke Sequencing and Genomic Technologies Shared Resource for the Affymetrix array processing service, Changzheng Du for his help with immunoblot experiments, Kristen Roso for her help with the southern blot experiments, Huishan Zhu for her help with tissue processing, and Karen Abramson and Emily Grass of the Duke Molecular Physiology Institute for their help with processing the DNA methylation arrays. We also thank Bill H. Diplas for helpful scientific discussion and suggestions and Jenna Lewis for her editorial revision of the manuscript. Y.H. thanks Dr. Bert Vogelstein for the initial discussion of and encouragement for starting the study.
Footnotes
Conflict of Interest Disclosure Statement:
The early therapeutic technology has been licensed to Istari Oncology and no royalties have been received
REFERENCES
- 1.Brennan CW, Verhaak RG, McKenna A, Campos B, Noushmehr H, Salama SR, et al. The somatic genomic landscape of glioblastoma. Cell 2013;155:462–77 [DOI] [PMC free article] [PubMed] [Google Scholar]
- 2.Nobori T, Karras JG, Della Ragione F, Waltz TA, Chen PP, Carson DA. Absence of methylthioadenosine phosphorylase in human gliomas. Cancer research 1991;51:3193–7 [PubMed] [Google Scholar]
- 3.Kadariya Y, Yin B, Tang B, Shinton SA, Quinlivan EP, Hua X, et al. Mice heterozygous for germ-line mutations in methylthioadenosine phosphorylase (MTAP) die prematurely of T-cell lymphoma. Cancer research 2009;69:5961–9 [DOI] [PMC free article] [PubMed] [Google Scholar]
- 4.Kadariya Y, Tang B, Wang L, Al-Saleem T, Hayakawa K, Slifker MJ, et al. Germline Mutations in Cooperate with to Accelerate Tumorigenesis in Mice. PloS one 2013;8:e67635. [DOI] [PMC free article] [PubMed] [Google Scholar]
- 5.Camacho-Vanegas O, Camacho SC, Till J, Miranda-Lorenzo I, Terzo E, Ramirez MC, et al. Primate genome gain and loss: a bone dysplasia, muscular dystrophy, and bone cancer syndrome resulting from mutated retroviral-derived MTAP transcripts. American journal of human genetics 2012;90:614–27 [DOI] [PMC free article] [PubMed] [Google Scholar]
- 6.Li CF, Fang FM, Kung HJ, Chen LT, Wang JW, Tsai JW, et al. Downregulated MTAP expression in myxofibrosarcoma: A characterization of inactivating mechanisms, tumor suppressive function, and therapeutic relevance. Oncotarget 2014 [DOI] [PMC free article] [PubMed] [Google Scholar]
- 7.Zhi L, Liu D, Wu SG, Li T, Zhao G, Zhao B, et al. Association of common variants in MTAP with susceptibility and overall survival of osteosarcoma: a two-stage population-based study in Han Chinese. Journal of Cancer 2016;7:2179–86 [DOI] [PMC free article] [PubMed] [Google Scholar]
- 8.Marce S, Balague O, Colomo L, Martinez A, Holler S, Villamor N, et al. Lack of methylthioadenosine phosphorylase expression in mantle cell lymphoma is associated with shorter survival: implications for a potential targeted therapy. Clinical cancer research : an official journal of the American Association for Cancer Research 2006;12:3754–61 [DOI] [PubMed] [Google Scholar]
- 9.Lin X, Yan C, Gao Y, Du J, Zhu X, Yu F, et al. Genetic variants at 9p21.3 are associated with risk of esophageal squamous cell carcinoma in a Chinese population. Cancer science 2016 [DOI] [PMC free article] [PubMed] [Google Scholar]
- 10.Hori H, Tran P, Carrera CJ, Hori Y, Rosenbach MD, Carson DA, et al. Methylthioadenosine phosphorylase cDNA transfection alters sensitivity to depletion of purine and methionine in A549 lung cancer cells. Cancer Res 1996;56:5653–8 [PubMed] [Google Scholar]
- 11.Kamatani N, Nelson-Rees WA, Carson DA. Selective killing of human malignant cell lines deficient in methylthioadenosine phosphorylase, a purine metabolic enzyme. Proc Natl Acad Sci U S A 1981;78:1219–23 [DOI] [PMC free article] [PubMed] [Google Scholar]
- 12.Lubin M, Lubin A. Selective killing of tumors deficient in methylthioadenosine phosphorylase: a novel strategy. PloS one 2009;4:e5735. [DOI] [PMC free article] [PubMed] [Google Scholar]
- 13.Bigaud E, Corrales FJ. Methylthioadenosine (MTA) Regulates Liver Cells Proteome and Methylproteome: Implications in Liver Biology and Disease. Molecular & cellular proteomics : MCP 2016;15:1498–510 [DOI] [PMC free article] [PubMed] [Google Scholar]
- 14.Huang S Histone methyltransferases, diet nutrients and tumour suppressors. Nature reviews Cancer 2002;2:469–76 [DOI] [PubMed] [Google Scholar]
- 15.Lee SH, Cho YD. Induction of apoptosis in leukemia U937 cells by 5’-deoxy-5’-methylthioadenosine, a potent inhibitor of protein carboxylmethyltransferase. Experimental cell research 1998;240:282–92 [DOI] [PubMed] [Google Scholar]
- 16.Oliva A, Galletti P, Zappia V, Paik WK, Kim S. Studies on substrate specificity of S-adenosylmethionine: protein-carboxyl methyltransferase from calf brain. European journal of biochemistry / FEBS 1980;104:595–602 [DOI] [PubMed] [Google Scholar]
- 17.Mavrakis KJ, McDonald ER 3rd, Schlabach MR, Billy E, Hoffman GR, deWeck A, et al. Disordered methionine metabolism in MTAP/CDKN2A-deleted cancers leads to dependence on PRMT5. Science 2016;351:1208–13 [DOI] [PubMed] [Google Scholar]
- 18.Kryukov GV, Wilson FH, Ruth JR, Paulk J, Tsherniak A, Marlow SE, et al. MTAP deletion confers enhanced dependency on the PRMT5 arginine methyltransferase in cancer cells. Science 2016;351:1214–8 [DOI] [PMC free article] [PubMed] [Google Scholar]
- 19.Marjon K, Cameron MJ, Quang P, Clasquin MF, Mandley E, Kunii K, et al. MTAP Deletions in Cancer Create Vulnerability to Targeting of the MAT2A/PRMT5/RIOK1 Axis. Cell reports 2016;15:574–87 [DOI] [PubMed] [Google Scholar]
- 20.Mack SC, Hubert CG, Miller TE, Taylor MD, Rich JN. An epigenetic gateway to brain tumor cell identity. Nature neuroscience 2016;19:10–9 [DOI] [PMC free article] [PubMed] [Google Scholar]
- 21.Li F, Liu X, Sampson JH, Bigner DD, Li CY. Rapid Reprogramming of Primary Human Astrocytes into Potent Tumor-Initiating Cells with Defined Genetic Factors. Cancer research 2016;76:5143–50 [DOI] [PMC free article] [PubMed] [Google Scholar]
- 22.Lu C, Ward PS, Kapoor GS, Rohle D, Turcan S, Abdel-Wahab O, et al. IDH mutation impairs histone demethylation and results in a block to cell differentiation. Nature 2012;483:474–8 [DOI] [PMC free article] [PubMed] [Google Scholar]
- 23.Turcan S, Rohle D, Goenka A, Walsh LA, Fang F, Yilmaz E, et al. IDH1 mutation is sufficient to establish the glioma hypermethylator phenotype. Nature 2012;483:479–83 [DOI] [PMC free article] [PubMed] [Google Scholar]
- 24.Evans GB, Furneaux RH, Lenz DH, Painter GF, Schramm VL, Singh V, et al. Second generation transition state analogue inhibitors of human 5’-methylthioadenosine phosphorylase. Journal of medicinal chemistry 2005;48:4679–89 [DOI] [PubMed] [Google Scholar]
- 25.Hu Y, Smyth GK. ELDA: extreme limiting dilution analysis for comparing depleted and enriched populations in stem cell and other assays. Journal of immunological methods 2009;347:70–8 [DOI] [PubMed] [Google Scholar]
- 26.Ulasov IV, Nandi S, Dey M, Sonabend AM, Lesniak MS. Inhibition of Sonic hedgehog and Notch pathways enhances sensitivity of CD133(+) glioma stem cells to temozolomide therapy. Molecular medicine 2011;17:103–12 [DOI] [PMC free article] [PubMed] [Google Scholar]
- 27.Liu G, Yuan X, Zeng Z, Tunici P, Ng H, Abdulkadir IR, et al. Analysis of gene expression and chemoresistance of CD133+ cancer stem cells in glioblastoma. Molecular cancer 2006;5:67. [DOI] [PMC free article] [PubMed] [Google Scholar]
- 28.Lathia JD, Mack SC, Mulkearns-Hubert EE, Valentim CL, Rich JN. Cancer stem cells in glioblastoma. Genes & development 2015;29:1203–17 [DOI] [PMC free article] [PubMed] [Google Scholar]
- 29.Bao S, Wu Q, McLendon RE, Hao Y, Shi Q, Hjelmeland AB, et al. Glioma stem cells promote radioresistance by preferential activation of the DNA damage response. Nature 2006;444:756–60 [DOI] [PubMed] [Google Scholar]
- 30.Zeppernick F, Ahmadi R, Campos B, Dictus C, Helmke BM, Becker N, et al. Stem cell marker CD133 affects clinical outcome in glioma patients. Clinical cancer research : an official journal of the American Association for Cancer Research 2008;14:123–9 [DOI] [PubMed] [Google Scholar]
- 31.Singh SK, Hawkins C, Clarke ID, Squire JA, Bayani J, Hide T, et al. Identification of human brain tumour initiating cells. Nature 2004;432:396–401 [DOI] [PubMed] [Google Scholar]
- 32.Singh SK, Clarke ID, Terasaki M, Bonn VE, Hawkins C, Squire J, et al. Identification of a cancer stem cell in human brain tumors. Cancer research 2003;63:5821–8 [PubMed] [Google Scholar]
- 33.Brescia P, Ortensi B, Fornasari L, Levi D, Broggi G, Pelicci G. CD133 is essential for glioblastoma stem cell maintenance. Stem cells 2013;31:857–69 [DOI] [PubMed] [Google Scholar]
- 34.Gopisetty G, Xu J, Sampath D, Colman H, Puduvalli VK. Epigenetic regulation of CD133/PROM1 expression in glioma stem cells by Sp1/myc and promoter methylation. Oncogene 2013;32:3119–29 [DOI] [PMC free article] [PubMed] [Google Scholar]
- 35.Tabu K, Sasai K, Kimura T, Wang L, Aoyanagi E, Kohsaka S, et al. Promoter hypomethylation regulates CD133 expression in human gliomas. Cell research 2008;18:1037–46 [DOI] [PubMed] [Google Scholar]
- 36.Kim M, Costello J. DNA methylation: an epigenetic mark of cellular memory. Experimental & molecular medicine 2017;49:e322. [DOI] [PMC free article] [PubMed] [Google Scholar]
- 37.Hong G, Li H, Zhang J, Guan Q, Chen R, Guo Z. Identifying disease-associated pathways in one-phenotype data based on reversal gene expression orderings. Scientific reports 2017;7:1348. [DOI] [PMC free article] [PubMed] [Google Scholar]
- 38.Okawa S, Gagrica S, Blin C, Ender C, Pollard SM, Krijgsveld J. Proteome and Secretome Characterization of Glioblastoma-Derived Neural Stem Cells. Stem cells 2017;35:967–80 [DOI] [PMC free article] [PubMed] [Google Scholar]
- 39.Zhou D, Alver BM, Li S, Hlady RA, Thompson JJ, Schroeder MA, et al. Distinctive epigenomes characterize glioma stem cells and their response to differentiation cues. Genome biology 2018;19:43. [DOI] [PMC free article] [PubMed] [Google Scholar]
- 40.Li M, Balch C, Montgomery JS, Jeong M, Chung JH, Yan P, et al. Integrated analysis of DNA methylation and gene expression reveals specific signaling pathways associated with platinum resistance in ovarian cancer. BMC medical genomics 2009;2:34. [DOI] [PMC free article] [PubMed] [Google Scholar]
- 41.Zhao Q, Rank G, Tan YT, Li H, Moritz RL, Simpson RJ, et al. PRMT5-mediated methylation of histone H4R3 recruits DNMT3A, coupling histone and DNA methylation in gene silencing. Nature structural & molecular biology 2009;16:304–11 [DOI] [PMC free article] [PubMed] [Google Scholar]
- 42.Braun CJ, Stanciu M, Boutz PL, Patterson JC, Calligaris D, Higuchi F, et al. Coordinated Splicing of Regulatory Detained Introns within Oncogenic Transcripts Creates an Exploitable Vulnerability in Malignant Glioma. Cancer cell 2017;32:411–26 e11 [DOI] [PMC free article] [PubMed] [Google Scholar]
- 43.Kindler HL, Burris HA 3rd, Sandler AB, Oliff IA. A phase II multicenter study of L-alanosine, a potent inhibitor of adenine biosynthesis, in patients with MTAP-deficient cancer. Investigational new drugs 2009;27:75–81 [DOI] [PubMed] [Google Scholar]
- 44.Choi JS, Berdis AJ. Nucleoside transporters: biological insights and therapeutic applications. Future medicinal chemistry 2012;4:1461–78 [DOI] [PubMed] [Google Scholar]
- 45.Wang X, Yang K, Xie Q, Wu Q, Mack SC, Shi Y, et al. Purine synthesis promotes maintenance of brain tumor initiating cells in glioma. Nature neuroscience 2017;20:661–73 [DOI] [PMC free article] [PubMed] [Google Scholar]
- 46.Letouze E, Martinelli C, Loriot C, Burnichon N, Abermil N, Ottolenghi C, et al. SDH mutations establish a hypermethylator phenotype in paraganglioma. Cancer cell 2013;23:739–52 [DOI] [PubMed] [Google Scholar]
- 47.Xiao M, Yang H, Xu W, Ma S, Lin H, Zhu H, et al. Inhibition of alpha-KG-dependent histone and DNA demethylases by fumarate and succinate that are accumulated in mutations of FH and SDH tumor suppressors. Genes & development 2012;26:1326–38 [DOI] [PMC free article] [PubMed] [Google Scholar]
- 48.Kaelin WG Jr., McKnight SL. Influence of metabolism on epigenetics and disease. Cell 2013;153:56–69 [DOI] [PMC free article] [PubMed] [Google Scholar]
- 49.Koivunen P, Lee S, Duncan CG, Lopez G, Lu G, Ramkissoon S, et al. Transformation by the (R)-enantiomer of 2-hydroxyglutarate linked to EGLN activation. Nature 2012;483:484–8 [DOI] [PMC free article] [PubMed] [Google Scholar]
- 50.Lu C, Thompson CB. Metabolic regulation of epigenetics. Cell metabolism 2012;16:9–17 [DOI] [PMC free article] [PubMed] [Google Scholar]
- 51.Vidal E, Sayols S, Moran S, Guillaumet-Adkins A, Schroeder MP, Royo R, et al. A DNA methylation map of human cancer at single base-pair resolution. Oncogene 2017 [DOI] [PMC free article] [PubMed] [Google Scholar]
- 52.Sharma S, Kelly TK, Jones PA. Epigenetics in cancer. Carcinogenesis 2010;31:27–36 [DOI] [PMC free article] [PubMed] [Google Scholar]
- 53.Tsai HC, Baylin SB. Cancer epigenetics: linking basic biology to clinical medicine. Cell research 2011;21:502–17 [DOI] [PMC free article] [PubMed] [Google Scholar]
- 54.Baylin SB, Jones PA. A decade of exploring the cancer epigenome - biological and translational implications. Nature reviews Cancer 2011;11:726–34 [DOI] [PMC free article] [PubMed] [Google Scholar]
- 55.Zhu L, Finkelstein D, Gao C, Shi L, Wang Y, Lopez-Terrada D, et al. Multi-organ Mapping of Cancer Risk. Cell 2016;166:1132–46 e7 [DOI] [PMC free article] [PubMed] [Google Scholar]
- 56.Fan X, Khaki L, Zhu TS, Soules ME, Talsma CE, Gul N, et al. NOTCH pathway blockade depletes CD133-positive glioblastoma cells and inhibits growth of tumor neurospheres and xenografts. Stem cells 2010;28:5–16 [DOI] [PMC free article] [PubMed] [Google Scholar]
- 57.Pakkenberg H, Ford DH, Rhines R, Israely RA. Adenine-H3 uptake in nervous tissue, including regenerating nerve cells, as compared with other tissues in euthyroid, hypo- and hyperthyroid male rats. Acta neurologica Scandinavica 1965;41:497–512 [DOI] [PubMed] [Google Scholar]
Associated Data
This section collects any data citations, data availability statements, or supplementary materials included in this article.