Abstract
Immune checkpoint inhibitors have been successful across several tumor types; however, their efficacy has been uncommon and unpredictable in glioblastomas (GBM), where <10% of patients show long-term responses. To understand the molecular determinants of immunotherapeutic response in GBM, we longitudinally profiled 66 patients, including 17 long-term responders, during standard therapy and after treatment with PD-1 inhibitors (nivolumab or pembrolizumab). Genomic and transcriptomic analysis revealed a significant enrichment of PTEN mutations associated with immunosuppressive expression signatures in non-responders, and an enrichment of MAPK pathway alterations (PTPN11, BRAF) in responders. Responsive tumors were also associated with branched patterns of evolution from the elimination of neoepitopes, as well as differences in T cell clonal diversity and tumor microenvironment profiles. Our study shows that clinical response to anti-PD-1 immunotherapy in GBM is associated with specific molecular alterations, immune expression signatures, and immune infiltration that reflect the tumor’s clonal evolution during treatment.
Reporting summary.
Further information on research design is available in the Life Sciences Reporting Summary linked to this article.
Introduction
Glioblastoma (GBM) is the most common primary brain malignancy in adults. The current standard of care for newly-diagnosed glioblastoma has limited efficacy, with a median overall survival of approximately 16–20 months1. There is still no effective treatment for progressive or relapsed GBM, which occurs invariably in most patients. In the last decade, immunotherapy with checkpoint inhibitors has shown remarkable success in treating a variety of tumors, including advanced melanoma2, non-small-cell lung cancer3, and Hodgkin’s lymphoma4, among others. There has been considerable interest in utilizing immunotherapy in GBM, but a recent clinical trial of Programed cell death 1 (PD-1) immune checkpoint inhibitors in recurrent glioblastoma showed that only a small subset of patients (8%) demonstrated objective responses5. The mechanistic basis for the variation in response patterns remains to be explained.
Improved response to anti-PD-1 therapy has been found to be associated with higher mutational burdens in tumors across multiple cancer types6,7, as well as with levels of T cell infiltration in the tumor microenvironment8. However, compared to melanomas or non-small cell lung cancer, GBM harbors a lower burden of somatic mutations9 and a more immunosuppressive tumor microenvironment. One mechanism of immunosuppression is T cell exhaustion and apoptosis via PD-1 ligands (PD-L1/2) expressed by tumor cells: upon binding PD-1 on the surface of cytotoxic T cells, the T cells become incapable of eliciting effective anti-tumor responses. PD-1 inhibitor therapy impairs this immune checkpoint and enhances the anti-tumor immune response8. Given the variable and unpredictable response of GBM patients to PD-1 inhibitor therapies, we have extensively profiled 66 patients across a variety of time points, collecting DNA, RNA, tissue imaging, and clinical data (Figure 1A). We sought to evaluate the genomic and stromal features associated with clinical outcomes, and to gain insight into the underlying mechanisms of immunotherapy response.
Figure 1. Analysis pipeline and clinical characteristics of the cohort.
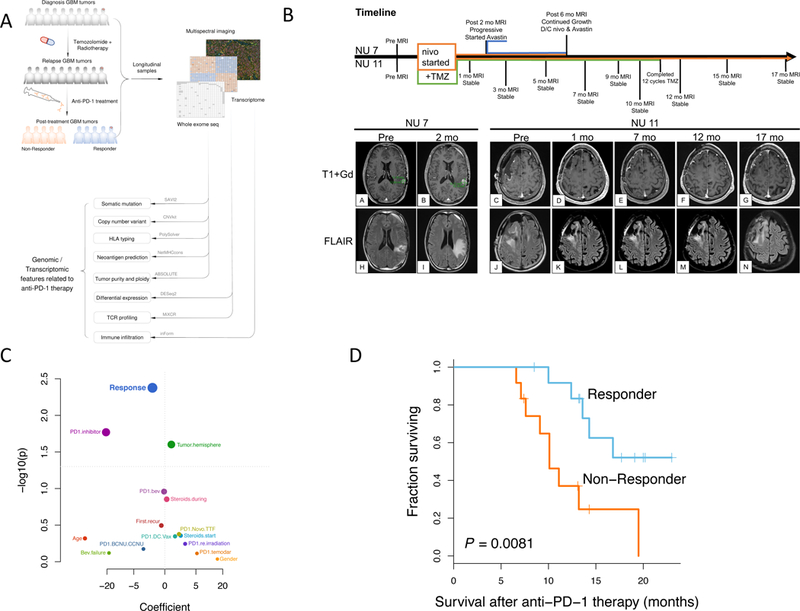
(A) Sample collection and computational workflow. (B) Brain MRIs of two patients treated with nivolumab, one of whom showed disease progression following 2 months of treatment (Left, NU 7), the other showing stable disease without progression after 17 months of treatment (Right, NU 11). (C) Univariate survival analysis revealed that only response to anti-PD-1 therapy is significantly correlated with overall survival of the patients (n = 25); p-value, two-sided log-rank test. (D) Kaplan-Meier curve comparing overall survival of patients who responded to anti-PD-1 therapy (n = 13) to those that did not respond (n = 12); p-value, two-sided log-rank test.
Results
Response to Anti-PD-1 Immunotherapy Correlates with Improved Post-treatment Patient Survival.
We compiled a retrospective series of 66 adult GBM patients who were treated with PD-1 inhibitors (pembrolizumab or nivolumab) upon recurrence. Baseline patient characteristics and available data modalities of our cohort can be found in Supplementary Table 1 and Extended Data Fig. 1A.
Patients were classified as responders if they met at least one of the following two criteria:
-
1)
Tissue sampled during surgery after PD-1 inhibitor therapy grossly showed only an inflammatory response and very few to no tumor cells (as associated with pseudo-progression).
-
2)
Tumor volumes as seen from MRI were either stable or shrinking continually over at least six months.
In Figure 1B, we show brain MRIs of two patients treated with nivolumab with their corresponding relative timelines. Patient NU 7 showed progression after two months of nivolumab as measured by the RANO criteria10. Meanwhile, patient NU 11 showed stable disease without progression after 17 months.
Demographic and clinical characteristics including response pattern, age at treatment initiation, gender, and choice of PD-1 inhibitor were evaluated in a univariate survival analysis (Fig. 1C). Since criterion 2 of our definition of response contains a temporal component, in order to avoid potential confounding, we excluded from this analysis patients whose survival was less than six months. Response to the PD-1 inhibitor was found to be the most significantly associated with overall survival as measured from the initiation of immunotherapy: patients who showed a responsive pattern to anti-PD-1 immunotherapy had a median survival of 14.3 months compared to the 10.1 months of non-responsive patients (p=0.0081, log-rank test) (Fig. 1D). Without excluding patients, this effect was even stronger: responders had a median survival of 15.5 months whereas non-responders had 5.7 months (p=2.2e-5, log-rank test) (Extended Data Fig. 1B,D). Similarly, survival as measured from initial diagnosis was also increased in responders (p = 1.6e-3, log-rank test, Extended Data Fig. 1C). However, there was no significant difference in the time spanning between initial diagnosis and the start of anti-PD-1 treatment between the two groups (p = 0.96, Wilcoxon rank-sum test).
Genomic Features of GBMs under immunotherapy.
We analyzed 58 whole exomes and 38 transcriptomes from longitudinal tumor-matched blood normal samples for 17 patients, and also incorporated the results from a cancer gene panel for 39 patients (Fig. 2A).
Figure 2. Mutational landscape, genomic correlates of response, and tumor evolution under anti-PD-1 therapy.
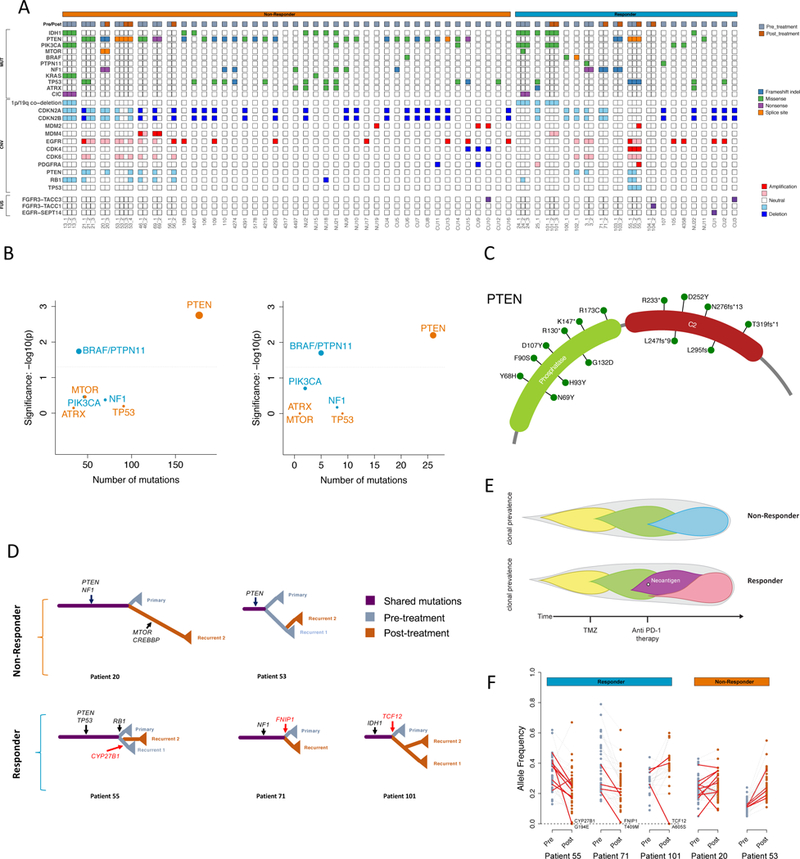
(A) Clinical and genetic profiles of the cohort. (B) Enrichment of BRAF/PTPN11 and PTEN mutations in tumors from responders and non-responders, respectively, compared to the TCGA-GBM background (left, n = 503 patients) and within the cohort (right, n = 45 patients); two-tailed Fisher’s exact test, see Methods. (C) Locations of identified mutations within the PTEN protein. (D) Evolutionary trees of 5 patients (2 non-responders & 3 responders) evaluated by whole-exome sequencing. Selected driver mutations are labeled in black. The variants that were eliminated after anti-PD-1 therapy and predicted to generate neoantigens are labeled in red. (E) Different tumor evolution models characterize non-responders and responders. The upper panel represents non-responders following a linear pattern of evolution. The lower panel represents responders following a branching pattern of evolution, with the elimination of a clone possessing a neoantigen after anti-PD-1 therapy. (F) Variant allele frequency of protein coding mutations before and after immunotherapy. Predicted expressed neoantigens are depicted in red.
We identified a median of 47 non-synonymous somatic mutations in the 33 tumors, with a range from 14 to 83, typical for GBM11 (Supplementary Table 2). Contrary to previous observations in other tumor types6,7,12, we did not find more non-synonymous single nucleotide variants (nsSNVs) in the responsive compared to the non-responsive baseline tumors (Extended Data Fig. 2). In fact, we observed a non-significant trend in the opposite direction; based on the pre-treatment samples from the first surgery for each patient, non-responders had a median nsSNV count of 40 whereas responders had 26 (p = 0.11, Wilcoxon rank-sum test). A statistically non-significant trend was also observed between response and aneuploidy (p = 0.88, t-test, Extended Data Fig. 2)13. Similarly, human leukocyte antigen class I (HLA-I) neoepitope load predictions yielded similar patterns for the two groups (median of 45 in non-responders and 35 in responders, p = 0.41, Wilcoxon rank-sum test). Although a recent study has shown that zygosity at HLA-I genes influences survival of advanced melanoma and non-small cell lung cancer patients treated with immunotherapies14, we did not find any significant association between HLA zygosity with immunotherapy response or survival. Additionally, there was no significant difference of tumor purity between these two groups (median of 0.41 in non-responders and 0.38 in responders, p = 0.19, Wilcoxon rank-sum test).
Enrichment of PTEN Mutations in Anti-PD-1 Non-Responsive GBM.
We then sought to identify mutations (nsSNVs and indels) that were significantly enriched in either responsive or non-responsive tumors. In total, we identified 11 IDH1 R132G/H mutated tumors, of which 4 were found in responders and 7 in non-responders. Focusing on the remaining 45 IDH1 wild-type tumors, we found 23 PTEN mutations among the 32 non-responders, but only 3 among the 13 responders (Figures 2B, C). Within the cohort, PTEN was significantly more frequently mutated in the non-responsive tumors than the responsive ones (Fisher p = 0.0063, odds ratio = 8.5, FDR corrected p < 0.05, Figure 2B, right). Considering that the background PTEN mutation rate is around 33% (154 of 458 tumors in IDH1 wild-type glioblastomas from TCGA15), PTEN mutations were also more enriched in non-responders than expected (Fisher p = 0.0018, odds ratio = 3.3, false discovery rate (FDR) corrected p < 0.05, Figure 2B, left, see Methods).
Notably, existing studies in melanoma have shown that PTEN loss in tumor cells increases the expression of immunosuppressive cytokines, resulting in decreased T cell infiltration in tumors and inhibited autophagy, which decreases T cell-mediated cell death16. Meanwhile, a study in glioblastoma has shown that tumor-specific T cells lysed PTEN wild-type glioma cells more efficiently than those expressing mutant PTEN17. By utilizing single-sample gene set enrichment analysis (ssGSEA) to calculate the enrichment score of the PI3K-AKT pathway for each tumor in our cohort, we also observed significantly higher PI3K-AKT pathway activity among PTEN mutant non-responsive tumors (t-test p = 0.049, Extended Data Fig. 3A). However, we did not find any difference in CD274 (which encodes PD-L1) RNA expression between responsive and non-responsive tumors (t-test p = 0.374, Extended Data Fig. 3B).
Enrichment of MAPK (ERK) pathway mutations in Anti-PD-1 Responsive GBM.
We also found 4 mutations in the MAPK pathway components (including BRAF and PTPN11) among the 13 responders, only 1 among the 32 non-responders (Fig. 2B). Considering the rarity of MAPK pathway mutations among IDH1 wild-type glioblastoma (mutation rate 7.8%, 36 of 458 tumors from TCGA), MAPK pathway genes were significantly more frequently mutated in the responsive tumors than expected (Fisher p = 0.018, odds ratio = 5.1, FDR corrected p < 0.05). Similarly, MAPK pathway mutations are also significantly enriched in responders within our cohort (Fisher p = 0.019, odds ratio = 12.8, FDR corrected p < 0.05). Given the high prevalence of BRAF mutations in melanoma and the dramatic success of immunotherapy in treating advanced melanoma, this finding may have relevant implications for the MAP kinase pathway and immune response18. Concordantly, the MAPK pathway was recently implicated in the modulation of T cell recognition of melanoma cells in a genome-wide CRISPR screen analysis19.
Clonal evolution of tumors under immunotherapy reflects negative selection against neoantigens.
Recent studies in cancer immuno-editing have shown that the immune system selects for tumor variants with reduced immunogenicity, a phenomenon that could contribute to immune-evasive features of gliomas20. The pattern of initial response and later relapse among the responders in our cohort led us to investigate the evolution of tumors undergoing anti-PD-1 immunotherapy. The number of mutations exclusive to or in common with each sample was used to construct evolutionary trees for 5 patients (2 non-responders and 3 responders) for whom we had both pre- and post-immunotherapy tumor samples (Fig. 2D).
We found that the tumors from non-responders and responders exhibit different patterns of evolution. The higher fraction of mutations exclusive to post-immunotherapy tumors compared to the pre-anti-PD-1 treatment case in the two non-responders (patient 20 & 53) suggests that they followed the classical linear model of tumor evolution. In contrast, the tumors from two responders (patients 55 & 71) were more similar to the branched model, with clonal alterations in pre-anti-PD-1 dominant clone not present after therapy, suggesting that specific alterations and evolutionary patterns are associated with treatment (Fig. 2E). In the case of Patient 55, we found 3 missense mutations (MYPN R409H, UBQLN3 R159W, CYP27B1 G194E) that were present before anti-PD-1 therapy (Recurrent 1), but not after (Recurrent 2). Interestingly, one of these mutations (CYP27B1 G194E) is highly expressed (RPKM >5) and predicted to result in immunogenic neoantigens. Similarly, for two other responders (Patients 71 and 101), we found a missense mutation (FNIP1 T409M and TCF12 A605S, respectively) missing after immunotherapy, which is also highly expressed (RPKM >5) and predicted to generate a neoantigen (Fig. 2F).
We also tracked the evolution of lymphocytes within the tumor by identifying TCR and immunoglobulin RNA sequences. Across 7 patients, we assessed the total number of relevant reads, and the clonal diversity via Shannon entropy, an information theory measure of randomness (Extended Data Fig. 4). We found that non-responders had a greater increase in clonal diversity among T cells compared to responders (Fig. 3A, p = 0.024, Exact Mann-Whitney U test). Likewise, the same effect was seen in the clonality of immunoglobulin reads, suggesting a similar response in B cells (Extended Data Fig. 5, p = 0.048, Exact Mann-Whitney U test).
Figure 3. Transcriptomic signatures related to response to anti-PD-1 therapy.
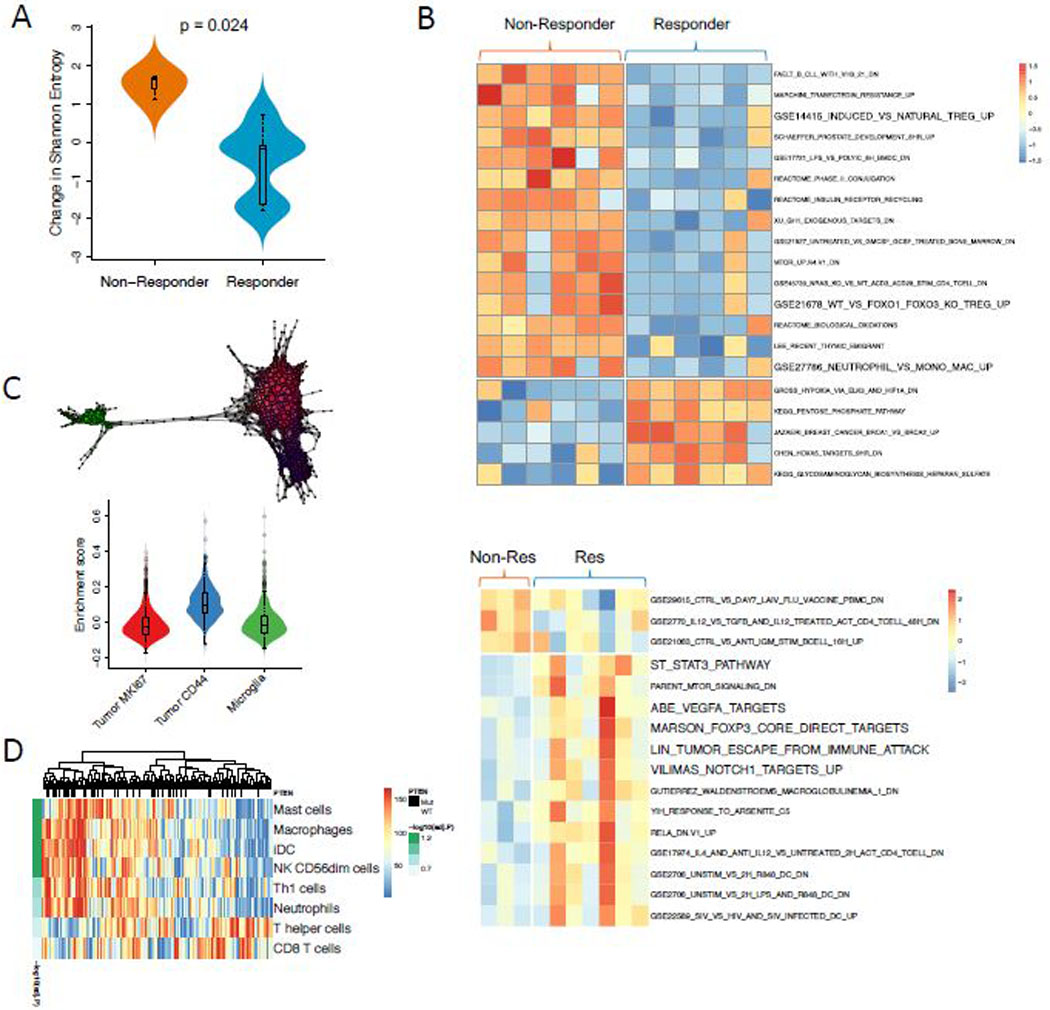
(A) T cell clonal diversity before and after immunotherapy was assessed by identifying TCR RNA sequences within the tumor. Non-responders had a greater increase in Shannon entropy among T cells compared to responders (p = 0.024, two-sided Exact Mann-Whitney U test; n = 16 independent timepoints from 7 patients). (B) Heatmap showing the top gene sets differentially enriched in responders versus non-responders prior to (upper panel) and after immunotherapy (lower panel). (C) Single-cell RNA-Seq identifies a cluster of CD44 expressing tumor cells that are enriched in displaying an immunosuppressive profile (n = 4000 cells). (D) Heatmap showing the associations between PTEN mutations and immune cell enrichment in TCGA (two-sided Wilcoxon rank-sum test; n=167 samples). All boxplots show the median, interquartile range, and whiskers (1.5 times interquartile range); violin plots represent sample distributions via kernel density estimation.
Enriched Transcriptomic Signatures in Anti-PD-1 Non-Responsive GBM.
Expression subtyping into proneural, mesenchymal, and classical subtypes21 did not result in any association with response (Extended Data Fig. 6). From a differential enrichment analysis across a total of 9,292 gene sets from MSigDB, we observed that prior to PD-1 inhibitor treatment, gene sets related to regulatory T cells were enriched among the top-ranked gene sets (p = 0.037, Fig. 3B). Additionally, enrichment analysis showed that genes up-regulated in Treg cells were significantly more active in non-responsive tumors (Extended Data Fig. 7). FOXP3-expressing Treg cells, which suppress aberrant immune response against self-antigens, have been shown to be negatively associated with clinical response to adaptive immunotherapy in human cancers22. Interestingly, following immunotherapy, gene sets related to immunosuppression were more active in responsive tumors, including FOXP3 and STAT3 signatures as well as an immune evasion signature previously reported in renal cell carcinoma23 (Fig. 3B).
Immunohistochemistry imaging of five tumors after anti-PD-1 treatment (2 responders and 3 non-responders) did not identify CD4+FOXP3+ regulatory T cells, suggesting that the aforementioned FOXP3 expression signature originated from another cell type. To investigate the origin of this immune signature, we studied the transcriptional profiles of 9,000 cells from three GBMs, including a PTEN-mutated tumor24. Cells associated with the signature were enriched in a PTEN-mutated tumor (p < 1e-16, Kolmogorov-Smirnov test, Extended Data Fig. 8), consistent with associations found in TCGA PTEN-mutated samples (p < 1e-16, Kolmogorov-Smirnov test, Extended Data Fig. 8). Using topological data analysis25, we identified three major cellular populations: microglia, actively proliferating tumor cells (Ki67+), and tumor cells with migrational markers (CD44+). Of these groups, the immunosuppressive signature was most associated with the CD44+ tumor subpopulation of the PTEN-mutated case (p < 1e-16, t-test, Fig 3C, Extended Data Fig. 9).
The observation that these immune signatures are up-regulated in non-responsive tumors suggests that PTEN may play a role in the formation of the tumor immune microenvironment. To further explore the potential immunological impact of PTEN mutations, we analyzed RNA-seq data from 172 samples from TCGA. We found that PTEN mutations are significantly correlated with the aforementioned FOXP3-related transcriptional signature, and with lower tumor purity (p=0.028, Wilcoxon rank test, Extended Data Fig. 10). Then, ssGSEA was employed to measure the per sample infiltration levels of 24 immune cell types26. Consistent with a previous report27, correlation analysis revealed that PTEN mutations are significantly associated with higher level of macrophages, microglia, and neutrophils in the tumor microenvironment (p < 0.05, Wilcoxon rank-sum test, FDR corrected p < 0.1, Fig. 3D). As the predominant immune cells infiltrating gliomas, tumor-associated macrophages have been shown to release a wide array of growth factors and cytokines that can facilitate tumor proliferation, survival and migration28.
Immune Cell Infiltration Correlates with Response to anti-PD-1.
Next, we investigated if PTEN mutations were associated with the structure of the tumor microenvironment, which we explored with quantitative multiplex immunofluorescence (qmIF)29,30. We stained and analyzed FFPE specimens from 17 patients with matched pre- and post- anti-PD-1 treatment samples (7 non-responders, 10 responders, Fig. 4A). We found that PTEN-mutated tumors tended to have higher overall levels of CD68+ macrophage infiltration, although the difference did not reach statistical significance. Given that macrophages have heterogeneous roles, upon further categorization we observed in PTEN-mutated tumors a significantly higher density of CD68+HLA-DR- macrophages (p = 0.011, Wilcoxon rank-sum test, Fig. 4B), a subpopulation that indicates poor survival in melanoma29. Finally, after immunotherapy, the density of CD3+ T cells in PTEN-wild-type samples significantly increased compared to pre-treatment samples (p = 0.0095, Wilcoxon rank-sum test, Fig. 4B), while the PTEN-mutated samples did not show this change. The same pattern was also observed in both CD3+CD8- (p = 0.0095, Wilcoxon rank-sum test, Fig. 4B) and CD3+CD8+ T cells (p = 0.038, Wilcoxon rank-sum test, Fig. 4B).
Figure 4. Tumor microenvironment profiling through quantitative multiplex immunofluorescence.
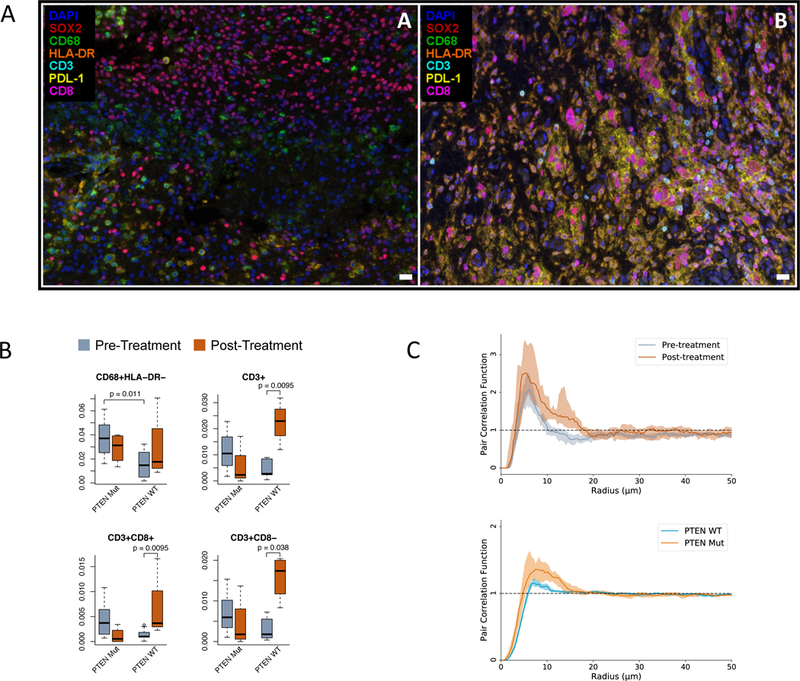
(A) Representative Multispectral Images (MSI) from pre-treatment samples showing DAPI (nuclei, blue), SOX2 (tumor, red), CD68 (microglia/macrophages, green), HLA-DR (activation marker, orange), CD3 (T cells, cyan), PD-L1 (immune suppression, yellow), and CD8 (CTLs, magenta), in a non-responder (left) and a responder (right). The white bars represent 10 μm. A total of n = 337 images were acquired. (B) Cellular proportions for identified cell types are shown before and after immunotherapy, as a fraction of the total cell count (n = 17 patients; p-values, two-sided Wilcoxon rank-sum test). Boxplots show the median, interquartile range, and whiskers (1.5 times interquartile range). (C) Pair correlation functions compare the degree of clustering of cells as a function of radius, for macrophages in PTEN-wild-type patients (above, n = 126 images) and for tumor cells prior to immunotherapy (below, n = 204 images). Lines represent the point-wise median across samples; shaded regions represent 95% confidence intervals.
To assesses the degree of clustering between cell types, we applied a technique from spatial statistics, the pair correlation function. We found that prior to immunotherapy, tumor cells clustered more strongly with each other in PTEN-mutated cases compared to PTEN-wild-type (p = 2.4e-4, Wilcoxon rank-sum test, Fig. 4C). Furthermore, in PTEN-wild-type cases, macrophages became more strongly clustered with each other following treatment (p = 0.0012, Wilcoxon rank-sum test, Fig. 4C); however, this effect was reversed in PTEN mutants (p = 0.032).
Discussion
In summary, we have confirmed that GBM patients who were responsive to anti-PD-1 immunotherapy (as evaluated through radiology and pathology) had significantly better overall survival after treatment. In our cohort, tumors from non-responders were significantly enriched for PTEN mutations; furthermore, RNA-seq analysis indicated that these PTEN mutations may induce a distinct immunosuppressive microenvironment. Single-cell RNA profiling revealed that the source of this signature originates not from Treg cells, but rather from tumor cells overexpressing CD44, a marker associated with cellular mobility and GBM aggressiveness31. Immunohistochemistry analysis confirmed the lack of increase of T cell infiltration in PTEN-mutant tumors, concurring with transcriptomic signatures seen in pretreated cases from TCGA. We also identified differences in spatial structure of the tumor microenvironment that were associated with PTEN status; the increased clustering of tumor cells in PTEN mutants may impede immune infiltration. Similar results were observed in melanoma16 and in uterine leiomyosarcoma32, where PTEN loss was associated with reduced immune infiltration and resistance to anti-PD-1 therapy. Furthermore, the AKT-mTOR pathway downstream of PTEN has been implicated in both PD-L1 expression33 as well as immune evasion in cancers34. These in turn may determine the response pattern of GBM patients to anti-PD-1 immunotherapy.
There is good evidence in the literature that alterations in the MAPK signaling pathway are implicated in the development of an unfavorable cancer immune phenotype35. On the other hand, preclinical evidence suggests that MAPK pathway inhibition can dramatically increase the efficacy of immunotherapy36. The observation in our cohort that BRAF/PTPN11 mutations are enriched in tumors responsive to anti-PD-1 therapy supports the rationale for combining checkpoint inhibitors with MAPK targeted therapy in multiple cancers35,37. Furthermore, these genomic phenomena may be interconnected, as a study in prostate cancer has proposed a PTEN/PTPN11 axis that is responsible for immunosuppression38.
Another important finding in our study is the distinct evolutionary patterns of responding and non-responding tumors under immunotherapy. Although we did not find higher somatic mutation and neoepitope loads in responding tumors, our analysis of their evolution provides strong evidence that the immune system plays an important role in the negative selection of clones containing immunogenic neoepitopes, and thus promotes tumors in escaping immune surveillance. This also confirms previous observations from gastrointestinal cancers where low mutational loads did not preclude tumor infiltration by mutation-reactive, class I- and II-restricted T cells39. Additionally, non-responders were found to have a greater increase in T cell diversity following immunotherapy, suggesting the failure of selective recruitment of lymphocytes into the tumor microenvironment. Supporting the role of tumor evolution in shaping the microenvironment, gene sets associated with immunosuppression were more active in non-responders prior to immunotherapy but were more active in responders following treatment. These findings are consistent with the notion that tumors of non-responders possessed primary resistance to immunotherapy, whereas responders demonstrate a gradual acquisition of resistance following successful selection pressure40.
In conclusion, our study identified multiple genomic features related to response to anti-PD-1 therapy in GBM patients and depicted distinct evolutionary patterns of GBM under immunotherapy. Whereas overall PD-1 inhibitors do not provide a survival benefit for GBM patients, our study showed that a sub-group of patients might benefit from this therapy, suggesting a molecular, personalized approach for refining patient selection for immunotherapy. While this approach requires further validation, it might provide a means for the effective application of therapy for glioblastoma.
Methods
Patient selection.
We collected a series of adult GBM patients (treated with pembrolizumab or nivolumab upon recurrence) from two institutions: Northwestern University (n=20) and Columbia University (n=46) with proper IRB approval at each institution. Informed consent was obtained from all patients, and this study complied with all relevant ethical regulations. All patients were treated with the standard therapy of temozolomide and radiation41 prior to the administration of PD-1 inhibitors. We excluded patients for which there were no pre-immunotherapy specimens (either at diagnosis or after standard therapy recurrence) available. The baseline patient characteristics for our cohort are found in Supplemental Table 1, and the distribution of available data modalities across the cohort is found in Extended data Fig. 1.
Sequencing and mapping.
On average, 100-fold exome-wide target coverage was achieved for all of the sequenced tumor samples, and 60-fold for matched blood normal samples. High-quality reads for these samples were mapped by BWA42 to the hg19 human genome assembly with default parameters. All mapped reads were then marked for duplicates by Picard to eliminate potential duplications.
Somatic mutations.
To identify somatic mutations from whole-exome sequencing data for samples from patients with GBM, we applied the variant-calling software SAVI2 (statistical algorithm for variant frequency identification43), which is based on an empirical Bayesian method. Specifically, we first generated a list of variant candidates by successively eliminating positions without variant reads, positions with low sequencing depth, positions that were biased for one strand, and positions that contained only low-quality reads. Then, the numbers of high-quality reads for forward-strand reference alleles, reverse-strand reference alleles, forward-strand non-reference alleles, and reverse-stand non-reference alleles were calculated at the remaining candidate positions to build the prior and the posterior distribution of mutation allele fraction. Finally, somatic mutations were identified on the basis of the posterior distribution of differences in mutation allele fraction between normal and tumor samples. SAVI2 was able to assess mutations by simultaneously considering multiple tumor samples, as well as their corresponding RNA samples, if available. Only variants with a mutant allele frequency of 5% or greater were included for further analysis.
Analysis of mutation frequencies.
Our pipeline is capable of detecting intragenic exon deletions, whereas these alterations are not reported in TCGA. When comparing the rate of PTEN mutations between our cohort and TCGA, for the sake of egalitarianism we have excluded the 3 calls of these intragenic exon deletions from our cohort.
Analysis of copy number changes.
CNVkit44 was used to detect copy number changes from whole exome sequencing data.
Tumor purity estimation.
In our cohort, we calculated tumor purity with ABSOLUTE45. For TCGA, pre-computed values from ESTIMATE46 were used.
Gene fusion detection.
ChimeraScan47 was used to generate the starting set of gene fusion candidates. To reduce the false positive rate and nominate potential driver events, we applied the Pegasus annotation and prediction pipeline. We reconstructed the entire fusion sequence on the basis of breakpoint coordinates and assigned a driver score to each candidate fusion via a machine learning model trained largely on GBM data48.
Gene expression analysis.
Paired-end transcriptome reads were processed using STAR49 aligner based on the Ensembl GRCh37 human genome assembly with default parameters. Normalized gene expression values were calculated by featureCounts50 as RPKM. ssGSEA was performed using the R package GSVA51. We compared the transcriptomic profiles of the two tumor groups using ssGSEA based on 5 collections of annotated gene sets from the Molecular Signature Database v6.0 (C2 curated gene sets, C4 computational gene sets, C6 oncogenic gene sets, and C7 immunologic gene sets)52. Then differentially-enriched gene sets between the responders and non-responders were defined by an effect size of GSVA score differences being greater than 0.8 and a t-test p value of less than 0.01.
HLA typing and neoantigen prediction.
To test if HLA zygosity affects immunotherapy response or survival, we determined HLA genotypes of 17 patients for whom we had normal blood whole-exome sequencing data and verified using tumor RNA. HLA typing for each sample was performed on blood DNA using the POLYSOLVER algorithm53. We furthermore validated the calls with tumor RNA, which achieved perfect concordance on samples where both were available. We used the pVAC-Seq54 pipeline with the NetMHCcons55 binding strength predictor to identify neoantigens. NetMHCcons integrates three state-of-the-art methods, NetMHC, NetMHCpan and PickPocket, to give the most accurate predictions with consideration of the patient’s HLA type. As required, we used the variant effect predictor from Ensembl to annotate variants for downstream processing by pVAC-Seq. For each single-residue missense alteration, MHC binding affinity was predicted for all the wild-type and mutant peptides of 8, 9, 10, and 11 amino acids in length. The mutant peptide with the strongest binding affinity was kept for further analysis.
Single cell data analysis.
Single cell transcriptional profiles were obtained from 9,000 cells over three samples24. GSEA was used to assess enrichment of transcriptomic signatures among the samples. Topological representations of cellular expression were constructed with Mapper (Ayasdi Inc), outputting a network where nodes represent sets of cells with similar characteristics. RGB values were computed for each node in proportion to its composition of Ki67+ tumor cells, microglia, and CD44+ tumor cells, respectively.
Tumor purity estimation and cellular fraction.
ABSOLUTE was used to infer tumor purity and ploidy for each whole-exome sequencing sample by integrating mutational allele frequencies and copy number calls.
Lymphocyte clonality analysis.
TCR and immunoglobulin RNA sequences were processed via MiXCR56. This was performed for a total of 7 patients for whom we had pre- and post-immunotherapy RNA-seq data of sufficient quality. Of these patients (2 non-responders and 5 responders), one from each response criteria had two samples post-therapy (patients 53 and 101). Clonal diversity was calculated through Shannon entropy.
Quantitative multiplex immunofluorescence (qmIF) analysis.
Formalin-fixed, paraffin-embedded (FFPE) tumor samples were collected for each sample and Hematoxylin and Eosin (H&E) slides were reviewed by a neuropathologist (PC) to confirm presence of tumor. Opal multiplex staining was performed on FFPE immunoblank slides for CD3 (T cells), CD8 (cytotoxic T lymphocytes (CTLs)), CD68 (microglia/macrophages), HLA-DR (activation marker), PD-L1 (immunosuppression marker), and SOX2 (tumor marker) 45,46. Images were acquired using Vectra™ (PerkinElmer) for whole slide scanning, and multispectral images (MSI) were acquired for all areas with at least 99% tissue, using inForm™ software (PerkinElmer) to unmix and remove autofluorescence. MSIs were analyzed using inForm™ software and R to evaluate density of immune phenotypes within the tumor microenvironment.
Spatial analysis.
Phenotyped immunofluorescence data was processed into pair correlation functions (PCFs) using the spatstat R package57. Inhomogeneous PCFs were calculated up to a radius of 50 microns for Tumor and CD68+ cells, provided that there was a minimum of 20 cells of that type in the sample. The isotropic edge correction and a normalization power of 2 were used. The area under the curve for each PCF was used as a summary statistic for quantifying clustering, and plots represent the point-wise median PCF across samples with 95% confidence intervals obtained via bootstrapping.
Statistical analysis.
All statistical analyses were conducted in R and Python. In all boxplots, the center lines represent the median, lower and upper box limits are respectively the first and third quartiles, and whiskers represent the maximal values up to 1.5 times the interquartile range. All values extending beyond this range are considered fliers/outliers. Violin plots use the Gaussian kernel to estimate densities. The two-sided Wilcoxon rank-sum (Mann-Whitney) test was generally used to nonparametrically compare two populations, unless we had prior knowledge that distributions were normal, in which case the two-sided t-test was used. P-values were adjusted for multiple comparisons using the Benjamini-Hochberg (FDR) procedure, and statistical significance was assessed at an adjusted p-value threshold of 0.05.
Extended Data
Extended Data Figure 1. Additional clinical characteristics of the cohort.
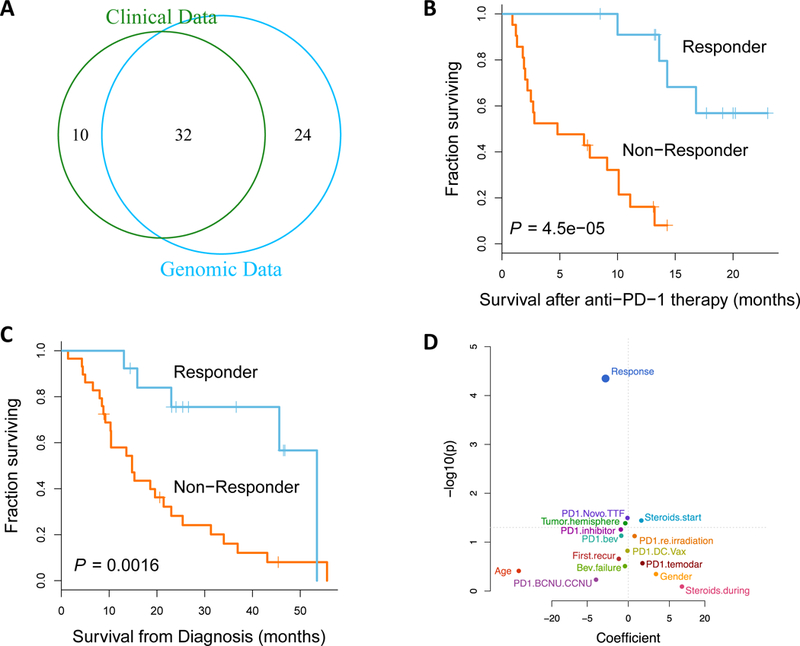
(A) Venn diagram of the data modalities available across the 66-patient cohort. Kaplan-Meier curve comparing post-treatment survival (B) and overall survival from diagnosis (C) of patients who responded to anti-PD-1 therapy (n=13) to those that did not respond (n=29; p-value, two-sided log-rank test), assessed across the entire cohort. (D) Univariate survival analysis reveals that response to anti-PD-1 therapy is still most correlated with post-treatment survival of the patients when assessed across the entire cohort (n=42, 13 responders, 29 non-responders; p-value, two-sided log-rank test).
Extended Data Figure 2. Additional analysis of genomic correlates of response to anti-PD-1 immunotherapy.
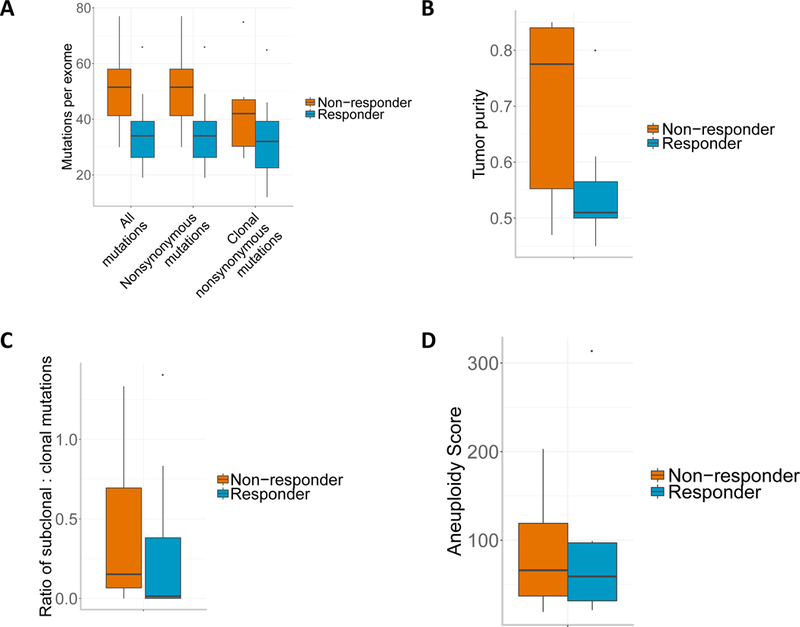
(A) Mutation burden by response group (n=17 patients). (B) Tumor purity, as estimated by ABSOLUTE, by response group. (C) Ratio of subclonal to clonal mutations, as estimated by ABSOLUTE, by response group. (D) Aneuploidy score analysis of non-responders vs. responders. Boxplots show the median, interquartile range, and whiskers (1.5 times interquartile range).
Extended Data Figure 3. Additional analysis of transcriptomic correlates of response to anti-PD-1 immunotherapy.
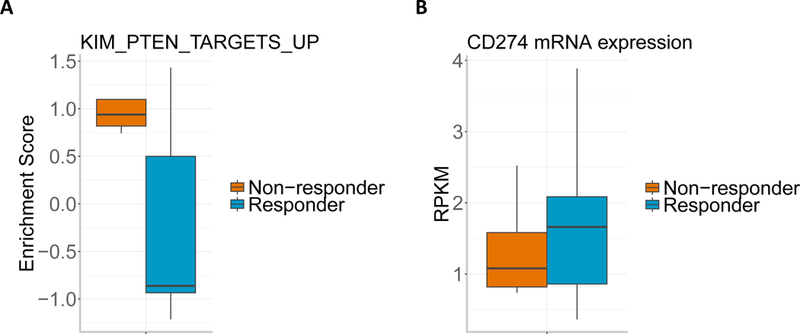
(A) GSEA enrichment score of gene set KIM_PTEN_TARGETS_UP for non-responders vs responders (n=12 patients). The boxplot shows the median, interquartile range, and whiskers (1.5 times interquartile range). (B) Boxplot of CD274 (encoding PD-L1) mRNA expression in responders vs. non-responders (n=12 patients). The boxplot shows the median, interquartile range, and whiskers (1.5 times interquartile range).
Extended Data Figure 4. Clonal diversity of lymphocytes before and after immunotherapy.
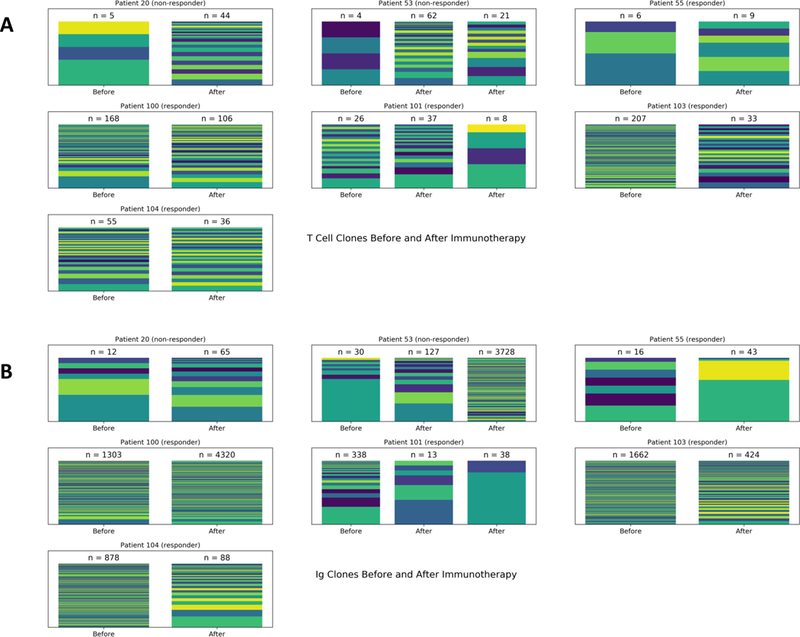
Within 7 patients with longitudinal information on TCR and immunoglobulin (Ig) RNA expression, MiXCR was used to group reads into T Cell (A) and B Cell clones (B). Each color on a bar represents the fractional presence of a different clone, with the total clonal read count n listed above.
Extended Data Figure 5. Non-responders demonstrate a greater increase in clonal diversity of B Cells following immunotherapy.
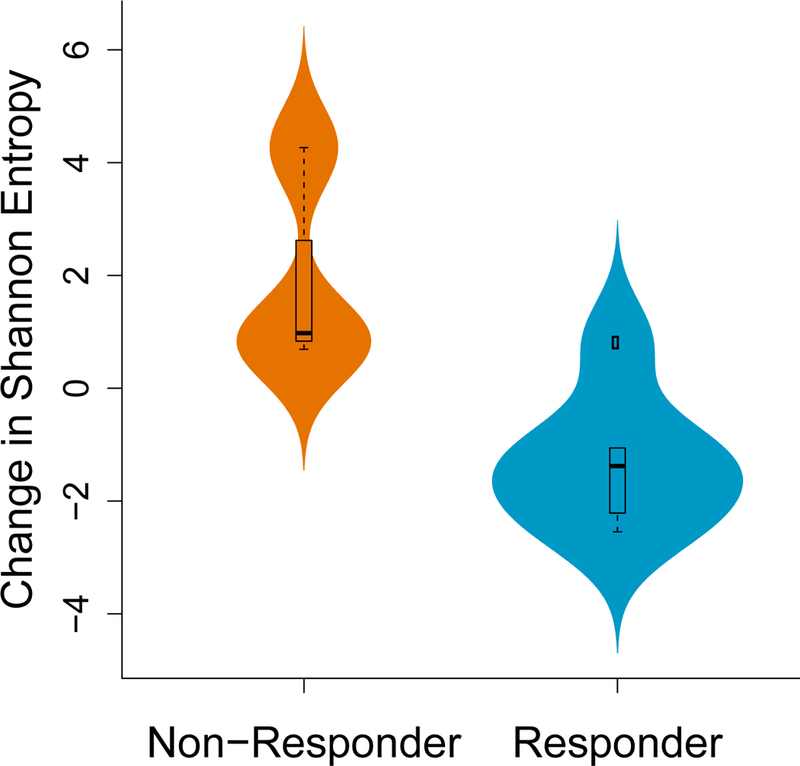
B-cell clonal diversity before and after immunotherapy was assessed by identifying immunoglobulin RNA sequences within the tumor. Non-responders had a greater increase in Shannon entropy among B cells compared to responders (p = 0.048, two-sided Exact Mann-Whitney U test; n = 16 independent timepoints from 7 patients). The boxplot shows the median, interquartile range, and whiskers (1.5 times interquartile range); the violin plot represents sample distributions via kernel density estimation.
Extended Data Figure 6. Tumor subtype.
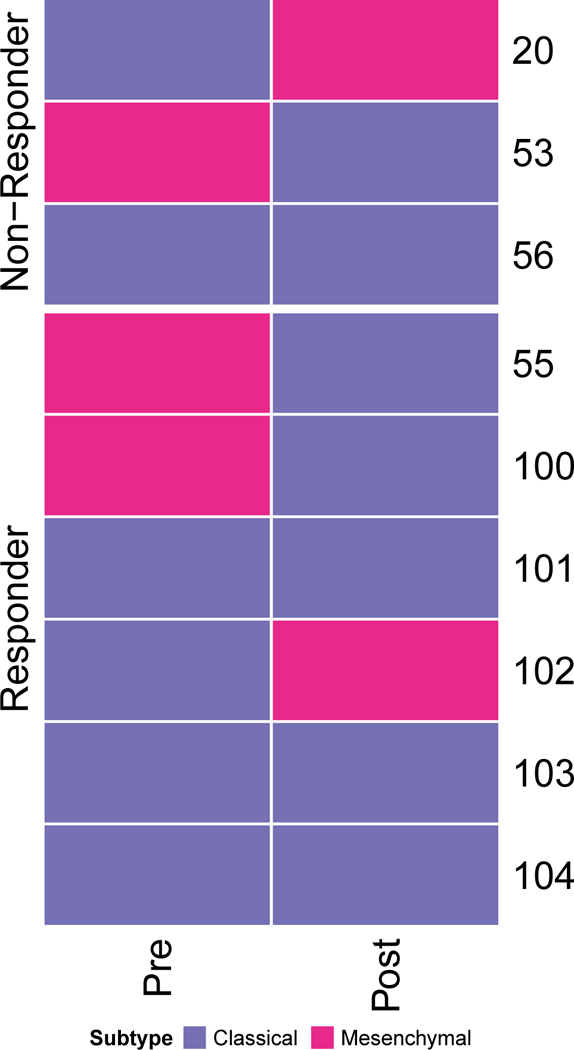
Expression subtyping of tumors from 9 patients (pre- & post-treatment) into proneural, mesenchymal, and classical subtypes.
Extended Data Figure 7. GSEA analysis.
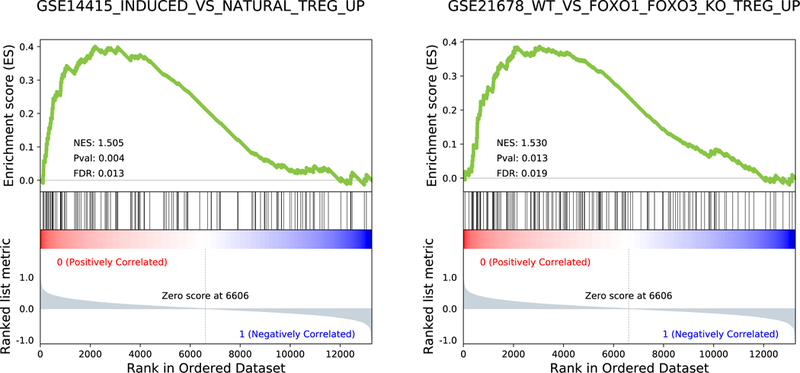
GSEA enrichment plots (n = 12 patients; 6 responders vs 6 non-responders) of two regulatory T cells (Treg) related gene sets; p-values, two-sided Kolmogorov-Smirnov test.
Extended Data Figure 8. Enrichment of regulatory T-cells signatures.
(A) Cells associated with the regulatory T-cells signature were enriched in a PTEN-mutated tumor. (B) Tumors associated with the regulatory T-cells signature were enriched in PTEN-mutated samples.
Extended Data Figure 9. Single cell RNA-seq data analysis.

Topological data analysis of single cell RNA-seq data (n = 4000 cells) from a PTEN-mutated tumor, demonstrating clusters of cells with high expression of CD44 (A, in red) and of microglial signatures (B, in red).
Extended Data Figure 10. Tumor purity analysis.
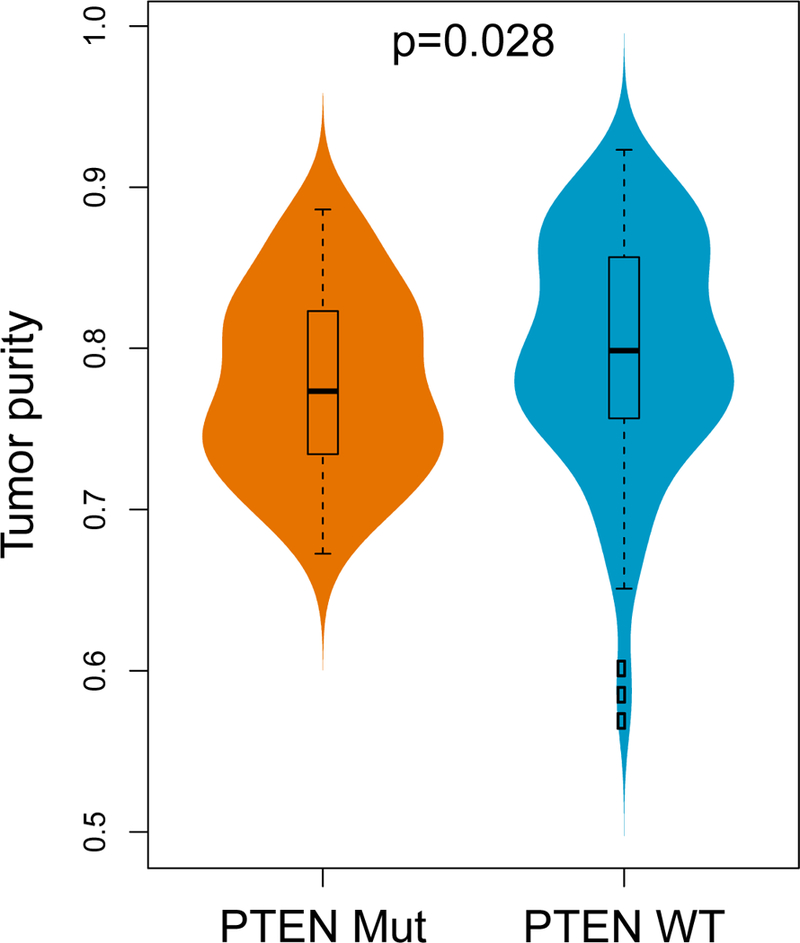
PTEN-mutated GBM tumors have significantly lower tumor purity compared to PTEN-wild-type tumors (n = 172, two-sided Wilcoxon rank-sum test). The boxplot shows the median, interquartile range, and whiskers (1.5 times interquartile range); the violin plot represents sample distributions via kernel density estimation.
Supplementary Material
ACKNOWLEDGMENTS
This work has been funded by NIH grants R01 CA185486 (RR), R01 CA179044 (RR), U54 CA193313, U54 209997 (RR), R01 NS103473 (PC, JB, PS), NSF/SU2C/V-Foundation Ideas Lab Multidisciplinary Team (PHY-1545805) (RR), 2018 Stand Up To Cancer Phillip A. Sharp Innovation in Collaboration Awards (RR) and Keep Punching Foundation (F.M.I.). Funding support from Northwestern 5DP5OD021356–04 (AS), P50CA221747 SPORE for Translational Approaches to Brain Cancer (AS, RL, CH), Developmental funds from The Robert H Lurie NCI Cancer Center Support Grant #P30CA060553 (AS). A.X.C. is funded by the Medical Scientist Training Program (T32GM007367). Robyn D. Gartrell is funded by CUIMC CTSA as TL1 Precision Medicine Fellow (1TL1TR001875–01) and Swim Across America.
Footnotes
Disclosure of Potential Conflicts of Interest
The authors declare no competing financial interests.
Code availability
All the custom code will be made available upon request.
Data availability
All the sequencing data have been deposited in SRA PRJNA482620. Processed data and basic association analyses will be made available upon request.
REFERENCES
- 1.Gilbert MR, et al. A randomized trial of bevacizumab for newly diagnosed glioblastoma. New England Journal of Medicine 370, 699–708 (2014). [DOI] [PMC free article] [PubMed] [Google Scholar]
- 2.Wolchok JD, et al. Nivolumab plus ipilimumab in advanced melanoma. New England Journal of Medicine 369, 122–133 (2013). [DOI] [PMC free article] [PubMed] [Google Scholar]
- 3.Garon EB, et al. Pembrolizumab for the treatment of non-small-cell lung cancer. New England Journal of Medicine 372, 2018–2028 (2015). [DOI] [PubMed] [Google Scholar]
- 4.Ansell SM, et al. PD-1 blockade with nivolumab in relapsed or refractory Hodgkin’s lymphoma. New England Journal of Medicine 372, 311–319 (2015). [DOI] [PMC free article] [PubMed] [Google Scholar]
- 5.Filley AC, Henriquez M & Dey M Recurrent glioma clinical trial, CheckMate-143: the game is not over yet. Oncotarget 8, 91779 (2017). [DOI] [PMC free article] [PubMed] [Google Scholar]
- 6.Le DT, et al. PD-1 blockade in tumors with mismatch-repair deficiency. New England Journal of Medicine 372, 2509–2520 (2015). [DOI] [PMC free article] [PubMed] [Google Scholar]
- 7.Rizvi NA, et al. Mutational landscape determines sensitivity to PD-1 blockade in non-small cell lung cancer. Science 348, 124–128 (2015). [DOI] [PMC free article] [PubMed] [Google Scholar]
- 8.Tumeh PC, et al. PD-1 blockade induces responses by inhibiting adaptive immune resistance. Nature 515, 568 (2014). [DOI] [PMC free article] [PubMed] [Google Scholar]
- 9.Alexandrov LB, et al. Signatures of mutational processes in human cancer. Nature 500, 415 (2013). [DOI] [PMC free article] [PubMed] [Google Scholar]
- 10.Wen PY, et al. Updated response assessment criteria for high-grade gliomas: response assessment in neuro-oncology working group. Journal of clinical oncology 28, 1963–1972 (2010). [DOI] [PubMed] [Google Scholar]
- 11.Wang J, et al. Clonal evolution of glioblastoma under therapy. Nature genetics 48, 768 (2016). [DOI] [PMC free article] [PubMed] [Google Scholar]
- 12.Hugo W, et al. Genomic and transcriptomic features of response to anti-PD-1 therapy in metastatic melanoma. Cell 165, 35–44 (2016). [DOI] [PMC free article] [PubMed] [Google Scholar]
- 13.Davoli T, Uno H, Wooten EC & Elledge SJ Tumor aneuploidy correlates with markers of immune evasion and with reduced response to immunotherapy. Science 355, eaaf8399 (2017). [DOI] [PMC free article] [PubMed] [Google Scholar]
- 14.Chowell D, et al. Patient HLA class I genotype influences cancer response to checkpoint blockade immunotherapy. Science 359, 582–587 (2018). [DOI] [PMC free article] [PubMed] [Google Scholar]
- 15.Brennan CW, et al. The somatic genomic landscape of glioblastoma. Cell 155, 462–477 (2013). [DOI] [PMC free article] [PubMed] [Google Scholar]
- 16.Peng W, et al. Loss of PTEN promotes resistance to T cell–mediated immunotherapy. Cancer discovery 6, 202–216 (2016). [DOI] [PMC free article] [PubMed] [Google Scholar]
- 17.Parsa AT, et al. Loss of tumor suppressor PTEN function increases B7-H1 expression and immunoresistance in glioma. Nature medicine 13, 84 (2007). [DOI] [PubMed] [Google Scholar]
- 18.Dong C, Davis RJ & Flavell RA MAP kinases in the immune response. Annual review of immunology 20, 55–72 (2002). [DOI] [PubMed] [Google Scholar]
- 19.Pan D, et al. A major chromatin regulator determines resistance of tumor cells to T cell–mediated killing. Science, eaao1710 (2018). [DOI] [PMC free article] [PubMed] [Google Scholar]
- 20.Arrieta VA, et al. The possibility of cancer immune editing in gliomas. A critical review. OncoImmunology 7, e1445458 (2018). [DOI] [PMC free article] [PubMed] [Google Scholar]
- 21.Wang Q, et al. Tumor evolution of glioma-intrinsic gene expression subtypes associates with immunological changes in the microenvironment. Cancer cell 32, 42–56. e46 (2017). [DOI] [PMC free article] [PubMed] [Google Scholar]
- 22.Yao X, et al. Levels of peripheral CD4+ FoxP3+ regulatory T cells are negatively associated with clinical response to adoptive immunotherapy of human cancer. Blood 119, 5688–5696 (2012). [DOI] [PMC free article] [PubMed] [Google Scholar]
- 23.Lin K-Y, et al. Ectopic expression of vascular cell adhesion molecule-1 as a new mechanism for tumor immune evasion. Cancer research 67, 1832–1841 (2007). [DOI] [PMC free article] [PubMed] [Google Scholar]
- 24.Yuan J, et al. Single-Cell Transcriptome Analysis of Lineage Diversity and Microenvironment in High-Grade Glioma. bioRxiv, 250704 (2018). [DOI] [PMC free article] [PubMed] [Google Scholar]
- 25.Rizvi AH, et al. Single-cell topological RNA-seq analysis reveals insights into cellular differentiation and development. Nature Biotechnology 35, 551–560 (2017). [DOI] [PMC free article] [PubMed] [Google Scholar]
- 26.Senbabaoglu Y, et al. Tumor immune microenvironment characterization in clear cell renal cell carcinoma identifies prognostic and immunotherapeutically relevant messenger RNA signatures. Genome biology 17, 231 (2016). [DOI] [PMC free article] [PubMed] [Google Scholar]
- 27.Zhang C, et al. Tumor Purity as an Underlying Key Factor in Glioma. Clinical Cancer Research (2017). [DOI] [PubMed] [Google Scholar]
- 28.Hussain SF, et al. The role of human glioma-infiltrating microglia/macrophages in mediating antitumor immune responses. Neuro-oncology 8, 261–279 (2006). [DOI] [PMC free article] [PubMed] [Google Scholar]
- 29.Gartrell RD, et al. Quantitative Analysis of Immune Infiltrates in Primary Melanoma. Cancer immunology research 6, 481–493 (2018). [DOI] [PMC free article] [PubMed] [Google Scholar]
- 30.Stack EC, Wang C, Roman KA & Hoyt CC Multiplexed immunohistochemistry, imaging, and quantitation: a review, with an assessment of Tyramide signal amplification, multispectral imaging and multiplex analysis. Methods 70, 46–58 (2014). [DOI] [PubMed] [Google Scholar]
- 31.Mooney KL, et al. The role of CD44 in glioblastoma multiforme. Journal of Clinical Neuroscience 34, 1–5 (2016). [DOI] [PubMed] [Google Scholar]
- 32.George S, et al. Loss of PTEN is associated with resistance to anti-PD-1 checkpoint blockade therapy in metastatic uterine leiomyosarcoma. Immunity 46, 197–204 (2017). [DOI] [PMC free article] [PubMed] [Google Scholar]
- 33.Lastwika KJ, et al. Control of PD-L1 expression by oncogenic activation of the AKT–mTOR pathway in non–small cell lung cancer. Cancer research 76, 227–238 (2016). [DOI] [PubMed] [Google Scholar]
- 34.Noh KH, et al. Activation of Akt as a mechanism for tumor immune evasion. Molecular therapy 17, 439–447 (2009). [DOI] [PMC free article] [PubMed] [Google Scholar]
- 35.Bedognetti D, Roelands J, Decock J, Wang E & Hendrickx W The MAPK hypothesis: immune-regulatory effects of MAPK-pathway genetic dysregulations and implications for breast cancer immunotherapy. Emerging Topics in Life Sciences 1, 429–445 (2017). [DOI] [PMC free article] [PubMed] [Google Scholar]
- 36.Ebert PJ, et al. MAP kinase inhibition promotes T cell and anti-tumor activity in combination with PD-L1 checkpoint blockade. Immunity 44, 609–621 (2016). [DOI] [PubMed] [Google Scholar]
- 37.Deken MA, et al. Targeting the MAPK and PI3K pathways in combination with PD1 blockade in melanoma. Oncoimmunology 5, e1238557 (2016). [DOI] [PMC free article] [PubMed] [Google Scholar]
- 38.Toso A, et al. Enhancing chemotherapy efficacy in Pten-deficient prostate tumors by activating the senescence-associated antitumor immunity. Cell reports 9, 75–89 (2014). [DOI] [PubMed] [Google Scholar]
- 39.Tran E, et al. Immunogenicity of somatic mutations in human gastrointestinal cancers. Science 350, 1387–1390 (2015). [DOI] [PMC free article] [PubMed] [Google Scholar]
- 40.Sharma P, Hu-Lieskovan S, Wargo JA & Ribas A Primary, adaptive, and acquired resistance to cancer immunotherapy. Cell 168, 707–723 (2017). [DOI] [PMC free article] [PubMed] [Google Scholar]
METHODS REFERENCES
- 41.Stupp R, et al. Radiotherapy plus concomitant and adjuvant temozolomide for glioblastoma. New England Journal of Medicine 352, 987–996 (2005). [DOI] [PubMed] [Google Scholar]
- 42.Li H & Durbin R Fast and accurate short read alignment with Burrows–Wheeler transform. Bioinformatics 25, 1754–1760 (2009). [DOI] [PMC free article] [PubMed] [Google Scholar]
- 43.Trifonov V, Pasqualucci L, Tiacci E, Falini B & Rabadan R SAVI: a statistical algorithm for variant frequency identification. BMC systems biology 7, S2 (2013). [DOI] [PMC free article] [PubMed] [Google Scholar]
- 44.Talevich E, Shain AH, Botton T & Bastian BC CNVkit: genome-wide copy number detection and visualization from targeted DNA sequencing. PLoS Comput Biol 12, e1004873 (2016). [DOI] [PMC free article] [PubMed] [Google Scholar]
- 45.Carter SL, et al. Absolute quantification of somatic DNA alterations in human cancer. Nature biotechnology 30, 413 (2012). [DOI] [PMC free article] [PubMed] [Google Scholar]
- 46.Yoshihara K, et al. Inferring tumour purity and stromal and immune cell admixture from expression data. Nature communications 4, 2612 (2013). [DOI] [PMC free article] [PubMed] [Google Scholar]
- 47.Iyer MK, Chinnaiyan AM & Maher CA ChimeraScan: a tool for identifying chimeric transcription in sequencing data. Bioinformatics 27, 2903–2904 (2011). [DOI] [PMC free article] [PubMed] [Google Scholar]
- 48.Abate F, et al. Pegasus: a comprehensive annotation and prediction tool for detection of driver gene fusions in cancer. BMC systems biology 8, 97 (2014). [DOI] [PMC free article] [PubMed] [Google Scholar]
- 49.Dobin A, et al. STAR: ultrafast universal RNA-seq aligner. Bioinformatics 29, 15–21 (2013). [DOI] [PMC free article] [PubMed] [Google Scholar]
- 50.Liao Y, Smyth GK & Shi W featureCounts: an efficient general purpose program for assigning sequence reads to genomic features. Bioinformatics 30, 923–930 (2013). [DOI] [PubMed] [Google Scholar]
- 51.Hänzelmann S, Castelo R & Guinney J GSVA: gene set variation analysis for microarray and RNA-seq data. BMC bioinformatics 14, 7 (2013). [DOI] [PMC free article] [PubMed] [Google Scholar]
- 52.Subramanian A, et al. Gene set enrichment analysis: a knowledge-based approach for interpreting genome-wide expression profiles. Proceedings of the National Academy of Sciences 102, 15545–15550 (2005). [DOI] [PMC free article] [PubMed] [Google Scholar]
- 53.Shukla SA, et al. Comprehensive analysis of cancer-associated somatic mutations in class I HLA genes. Nature biotechnology 33, 1152 (2015). [DOI] [PMC free article] [PubMed] [Google Scholar]
- 54.Hundal J, et al. pVAC-Seq: A genome-guided in silico approach to identifying tumor neoantigens. Genome medicine 8, 11 (2016). [DOI] [PMC free article] [PubMed] [Google Scholar]
- 55.Karosiene E, Lundegaard C, Lund O & Nielsen M NetMHCcons: a consensus method for the major histocompatibility complex class I predictions. Immunogenetics 64, 177–186 (2012). [DOI] [PubMed] [Google Scholar]
- 56.Bolotin DA, et al. MiXCR: software for comprehensive adaptive immunity profiling. Nature methods 12, 380 (2015). [DOI] [PubMed] [Google Scholar]
- 57.Baddeley A, Rubak E & Turner R Spatial point patterns: methodology and applications with R, (Chapman and Hall/CRC, 2015). [Google Scholar]
Associated Data
This section collects any data citations, data availability statements, or supplementary materials included in this article.


