

Interpersonal relationships have broad impacts on social and psychological functioning (Nelson, 2013; Rubin, Bukowski & Parker, 2006). Variations in interpersonal relational processes and contexts are related to a wide range of psychological health outcomes, such as depressive symptoms and life satisfaction (Measelle, Stice & Hogansen, 2006; Rubin, Coplan & Bowker, 2009). Specifically, people who engage in fewer interpersonal relations tend to report more depressive symptoms (Coplan, Girardi & Findlay, 2007), while those who engage with their peers more often tend to report greater life satisfaction (Peterson, Park & Seligman, 2005). Interpersonal relations are multifaceted and include various relational processes and contexts, thus specific patterns of interpersonal relationships may have stronger associations with depressive symptoms and life satisfaction. The ways in which unique relational processes and contexts are associated with one another, depressive symptoms, and life satisfaction have implications for a wide audience, including parents, educators, health professionals and researchers, among others.
Recent advancements in technology have resulted in a steady increase in the use of social media and text messaging to maintain interpersonal relationships. As of 2016, 68% of all Americans report using the social media platform Facebook, with 76% reporting daily Facebook use (Pew Research Center, 2016). Further, between 2007–2012, the rate of text messaging among American adults increased from 58 to 80% (Pew Research Center, 2012). As the contexts in which we communicate continue to evolve, it is imperative to understand the associations between modern relational contexts (e.g., social media) and overall interpersonal relations and psychological health. Friendships rely on reciprocal interactions; specifically, the willingness of friends to both initiate and accept attempts to connect (Rubin, Bukowski & Parker, 2006). Similarly, face-to-face relations are associated with stronger social ties than those developed through technology-based engagement (Kraut et al., 2002). Thus, the extent to which individuals maintain reciprocal relationships and engage with their peers in face-to-fact contexts may be associated with depressive symptoms and life satisfaction.
Past research has found that heightened screen time (e.g., using computers or smartphones) is associated with poorer mental well-being, broadly (e.g., happiness or life satisfaction; Przybylski & Weinstein, 2017). Additional work has found that technology-based relations (e.g., those maintained through social media, texting, etc.) are ultimately less rich than face-to-face interactions (Kraut et al., 2002). However, research examining the impact of technology use on overall interpersonal relational patterns and psychological health remains inconsistent. Specifically, while some suggest that technology-based relations provide a context for socially anxious individuals to connect and enhance interpersonal relations (Sheldon, 2008; Birnie & Harvoth, 2002), others suggest that those not already engaged in interpersonal relations will rely on technology-based relational contexts and remain otherwise withdrawn (Nelson et al., 2016; Kraut et al., 2002). Much of this past work has conceptualized interpersonal relations as a single process, rather than examining initiated, accepted, and group relations as unique interpersonal relational processes, which may, in part, account for differences in study findings. Thus, the current study seeks to fill this gap in the literature by examining the associations between unique patterns of multicontextual interpersonal relations across relational processes and contexts and depressive symptoms and life satisfaction.
In sum, interpersonal relationships are related to depressive symptoms and life satisfaction, where multifaceted and reciprocal relations maintained across face-to-face contexts are associated with better psychological health. Technology-based methods of communicating are steadily increasing and yet little is known about its associations with overall patterns of interpersonal relationships and psychological health. Thus, the purpose of the current study was to (1) identify patterns of engagement within various interpersonal relations across contexts (face-to-face and technology-based); and (2) examine whether depressive symptoms and life satisfaction are associated with specific patterns of engagement.
Latent class analysis (LCA) allows researchers to examine unique patterns across dimensions (e.g., technology-based engagement) of an underlying construct (e.g., interpersonal relations). With a latent class approach, we can examine whether specific dimensions of interpersonal relations (e.g., technology-based interactions) alone are associated with depressive symptoms and life satisfaction or whether the associations are contingent upon an overall relational pattern. For example, we may find that any class including technology-based interactions is associated with higher depressive symptomology or we may find that technology-based interactions are only associated with heighten depressive symptoms when other conditions in the interpersonal relationship patterns are met (e.g., a lack of face-to-face connections). Moreover, social network theories posit that interpersonal relations and friendships are often formed around shared attributes or demographic characteristics (e.g., homophily; Kandel, 1978) and thus interpersonal relational patterns may vary by race, gender, and age. Thus, demographic variables were included as covariates to determine whether certain demographic characteristics altered the latent class structure.
It was hypothesized that the latent classes would represent variations in the relational processes (e.g., initiated, passive, or group) and contextual (e.g., face-to-face or technology-based) patterns. Because past research has highlighted the importance of reciprocal relationships and face-to-face connections, was hypothesized that individuals in classes characterized by relational patterns that include reciprocal relationships with friends and face-to-face interactions would report lower depressive symptoms and higher life satisfaction than those in classes characterized by technology-dominated relations and/or non-reciprocal engagement (e.g., not initiating connections with friends).
Method
Procedures
A convenience sample of participants was recruited from Amazon’s Mechanical Turk (MTurk), an online data collection tool. Quota sampling was used to closely match the demographics of the study sample to that of the United States. Participants were first directed to a page containing a brief description of the study, the voluntary nature of their participation, as well as any and all steps taken to ensure their safety, privacy, and confidentiality. After reading the brief description and protections, participants who were still interested in participating in the study provided informed consent by selecting a radio style button, which served as an electronic signature. After providing informed consent, participants were redirected to the survey. The study and study procedures were approved by the Institutional Review Board at Utah State University.
Sample
Nine hundred and sixty-two people participated, of which the majority were female (51.2%), European American (83.6%), and Non-Latino/Hispanic (93.2%). The sample age ranged from 18–78 years (M = 35.6, SD = 10.9). Overall the sample was well educated, with 39.3% of the sample having achieved a Bachelors degree. The sample demographics and descriptive statistics are provided in Table 1. Of note, the sample reports mild mood disturbances (M = 12.43, SD = 15.36), which suggests that the sample reports mood disturbances slightly above those considered normal without exceeding the clinical threshold (Beck et al., 1961). One additional study, which focused on scale development and validation, has been published using the analytic sample included in the present study (reference masked for review), and thus the focus of the current study is significantly different from past research using the data.
Table 1.
Participant Demographics
| Variable | Statistics |
|---|---|
| Age | M = 35.54 (SD = 10.88) |
| MIRS | M = 2.12 (SD = 0.50) |
| Beck Depression Inventory | M = 12.43 (SD = 15.36) |
| Satisfaction with Life Scale | M = 23.00 (SD = 7.53) |
| Gender | |
| Male | 48.4% |
| Female | 51.6% |
| Race | |
| European American | 83.6% |
| African American/Black | 7.4% |
| Asian | 6.1% |
| Native American or Alaskan Native | 0.4% |
| Native Hawaiian or Pacific Islander | 0.1% |
| Biracial/Multiracial | 2.4% |
| Ethnicity | |
| Latino/Hispanic | 6.8% |
| European American/Non-Latino | 93.2% |
| Education | |
| High School / GED | 28.4% |
| Associates Degree | 16.1% |
| Bachelors Degree | 29.4% |
| Masters Degree | 10.7% |
| Doctoral Degree | 1.8% |
| Trade or Vocational Degree | 2.4% |
| Other | 1.0% |
Note. N = 962. MIRS = multidimensional interpersonal relations scale; M = mean; SD = standard deviation; GED = general educational development
Measures
Demographics.
Participants completed a demographics questionnaire. The scale included information about participant’s age, gender identity, race, ethnicity, and educational attainment.
Multicontextual Interpersonal Relations Scale (MIRS).
Participants responded to the 14-item MIRS, which measures modern interpersonal relations processes and contexts (Simone, Geiser, & Lockhart, 2018) on a 4-point scale, ranging from 0 (very unlikely) to 3 (very likely). The scale captures several relational processes: initiated relations (e.g., hanging out with a friend in your own home), accepted relations (e.g., hanging out at a friend’s house), and group relations (e.g., going to a party), which can be maintained through several relational contexts: face-to-face, social media, text messaging, and phone calls. The MIRS showed good internal consistency in the present study (α = .90).
Consistent with other studies that apply LCA, the decision to dichotomize the MIRS data was made to allow for more interpretable results and response probability plots (e.g., Reese et al., 2015; Laska et al., 2009; Patterson et al., 2002). To this end, the responses “very unlikely” and “unlikely” were transformed into an “unlikely” category (0); whereas, “likely” and “very likely” were transformed into a “likely” category (1). After dichotomizing the data, the LCA results were essentially the same as those obtained with the original 4-point scale. We therefore present the results for the dichotomized data. Scale items and their associated response probabilities are presented in Table 2.
Table 2.
Multicontextual Interpersonal Relations Scale Items and Response Probabilities for the Full Analytic Sample
| MIRS Item | Response probability (S.E.) |
|---|---|
| Initiated relations | |
| 6. Initiate plans with friends | .72 (.01) |
| 11. Hang out with a friend in your own home | .79 (.01) |
| 10. Call a friend to talka | .58 (.02) |
| 8. Initiate text message conversations with friendsa | .82 (.01) |
| 9. Initiate Facebook conversations with friendsa | .63 (.02) |
| Accepted Relations | |
| 4. Respond to a Facebook messagea | .85 (.01) |
| 5. Respond to Facebook comments from friendsa | .83 (.01) |
| 2. Respond to text messages from friendsa | .96 (.01) |
| 3. Answer a phone call from a frienda | .92 (.01) |
| 7. Follow through with plans you made | .97 (.01) |
| 1. Hang out with friends if they invite me over | .89 (.01) |
| Group Relations | |
| 12. Hang out with friends at a social outing | .86 (.01) |
| 13. Go to a party you were invited to | .80 (.01) |
| 14. Hang out with friends in a public space | .90 (.01) |
Note. S.E. = standard error;
= technology-based relational contexts
Depressive Symptoms.
The Beck Depression Inventory (BDI; Beck et al., 1961) was used to measure participant’s symptoms of depression. The BDI was rated from 0–3, as described in terms of severity for each item, such as mood or sleep disturbance. Due to a technical error, the BDI as used in the present study contained 20 items rather than 21. The missing item measured recent changes in the participant’s interest in sex. The reduced 20-item BDI version showed acceptable internal consistency in the present sample (α = .85)
Satisfaction with Life Scale.
The 5-item Satisfaction with Life Scale (SWLS; Diener et al., 1985) was used as a measure of global life satisfaction. Sample items include: “In most ways my life is close to ideal,” and “If I could live my life over, I would change almost nothing.” Participants responded to each item using a 7-point scale, ranging from 0 (strongly disagree) to 7 (strongly agree). The SWLS showed good internal consistency among the current sample (α = .93).
Statistical Analyses
LCAs with one to eight classes were conducted on the 14-item MIRS using Mplus statistical software (Muthén & Muthén, 1998–2011) to identify subgroups of participants who show distinct patterns of interpersonal relational processes (initiated, accepted, and group) across relational contexts (face-to-face, social media, text messaging, and phone calls). Individuals were grouped into unique classes based on their responses to the items of the MIRS. For example, there may be a class of individuals who only accept relations within technology-based contexts and who are also unlikely to engage in initiated or group relations.
In the estimation of each model, we used 800 sets of random start values along with 50 initial stage iterations to ensure that the model estimates were not based on local maxima of the likelihood function. Each model was run a second time with 50 iterations and two times the random start values, to ensure that the best log likelihood values were still obtained. Model fit was assessed using a variety of indices as recommended by Nylund, Asparouhov, and Muthen (2007): Bayesian Information Criterion (BIC), sample-size adjusted Bayesian Information Criterion (aBIC; Sclove, 1987), parametric bootstrap likelihood ratio test (BLRT; McLachlan & Peel, 2000), reductions in −2 Log Likelihood (−2LL), and entropy. When comparing models, lower BIC and aBIC imply better model fit, and models with higher −2LL values are preferred. The BLRT uses a parametric bootstrap approach to estimate an empirical p value for testing a model with k classes against the k − 1 class model. Each model included 300 bootstrap draws with 150 random starts to ensure that the BLRT estimates were based on global maxima of the likelihood function. Finally, a higher entropy value indicates better model fit and suggests that the latent classes are distinct from one another.
Next, we examined possible relationships of the identified classes with demographic variables in an LCA with covariates. Specifically, gender (male/female), race (White/Non-White) and age (years) were included in the LCA as covariates. An LCA with covariates approach wherein the covariates were included in the class analysis model was selected, as past quantitative studies have suggested that it performs better when compared to other LCA with covariate analyses (Clark & Muthén, 2009) and it allows class membership to retain a latent structure, avoids classification error, and allows for the examination of possible direct effects of covariates on indicators and changes to the model when covariates are entered (Clark & Muthén, 2009).
An LCA with covariates included in the model was also applied to examine the extent to which class membership was associated with depressive symptoms and life satisfaction. In a separate set of analyses, which aimed to examine the mean differences in depressive symptoms scores, an LCA analysis was conducted wherein, the mean depressive symptoms or life satisfaction scores were allowed to vary across latent classes. In a second step, models were conducted with equal mean depressive symptom reports across classes and a log likelihood difference test was examined to determine whether the model with equal or unequal depressive symptom mean scores across classes fit the data better. The same process was done to examine mean differences in life satisfaction across latent classes.
Results
Results from the eight LCAs supported different class solutions according to different measures of model fit. Model fit information for all models are presenting in Table 3. Two indices of fit, −2LL and entropy, supported a 4-class solution. Specifically, while the AIC, BIC, aBIC, and BLRT indices of fit supported solutions with a higher number of classes (ranging from 5–8), solutions with more than 4 classes contained classes that were structurally similar to those found in the 4-class model. For example, the 5-class solution included an additional class that was essentially a variation of class 3 within the 4-class solution. This finding is consistent with the reduction in entropy values from .86 to .83 when moving from a 4- to 5-class solution, which indicates that the 4-class solution is better able to differentiate between classes. Moreover, reductions in −2LL began to taper in the models with more than 4 classes (see Figure 1). Thus, the 4-class solution was determined to be the best model to represent the sample response pattern probabilities.
Table 3.
Model Fit Comparisons Across 1- to 8 Class LCA Solutions
| Model | Log- Likelihood |
BLRT p | aBIC | BIC | AIC | Entropy |
|---|---|---|---|---|---|---|
| 1-class | −5705.6 | NA | 11463.0 | 11507.4 | 11439.3 | NA |
| 2-class | −4815.8 | .001 | 9738.6 | 9830.8 | 9689.6 | .85 |
| 3-class | −4567.4 | .001 | 9297.2 | 9437.0 | 9222.8 | .86 |
| 4-class | −4416.5 | .001 | 9050.9 | 9238.3 | 8951.0 | .86 |
| 5-class | −4365.5 | .001 | 9004.2 | 9239.2 | 8878.9 | .84 |
| 6-class | −4319.5 | .034 | 8967.6 | 9250.2 | 8816.9 | .85 |
| 7-class | −4283.9 | .141 | 8951.9 | 9282.2 | 8775.8 | .85 |
| 8-class | −4260.8 | .272 | 8961.3 | 9339.3 | 8759.9 | .86 |
Note. Bolded values highlight the best fitting model according to specific indices of fit. BLRT = parametric bootstrap likelihood ratio test; aBIC = sample-size adjusted Bayesian Information Criteria; BIC = Bayesian Information Criteria; AIC = Akaike Information Criteria.
Figure 1.
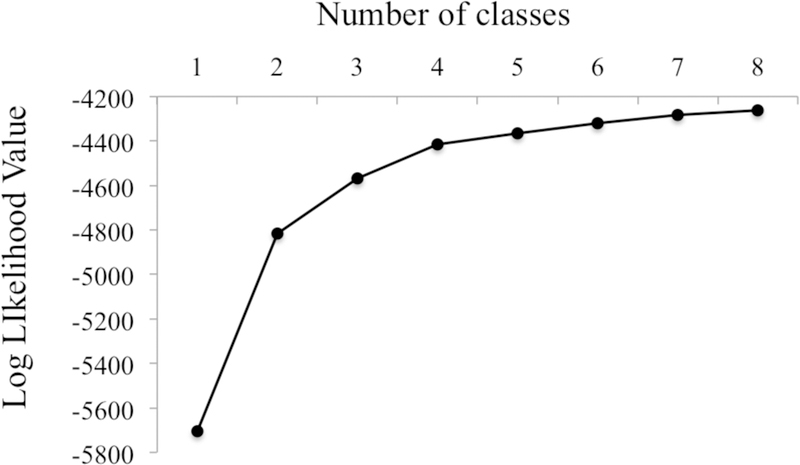
−2 Log Likelihood Values for 1- to 8- Class LCA Model Solutions
Average class assignment probabilities for the most likely class ranged between .88 and .95 in the 4-class solution, indicating good reliability of the class assignments in this model. The entropy value of 0.86 suggests a clear delineation of the latent classes (Muthén & Muthén, 2007; Celeux & Soromenho, 1996). The conditional probabilities of the “likely” category for each of the 14 items in the MIRS in the 4-class solution are presented in Figure 2. Class 1, labeled the “Multicontextual Reciprocal Relations” class, was the largest class in the analysis (50.6%) and was characterized by high probabilities of engaging in all interpersonal relational processes and contexts measured in the MIRS. Class 2 (12.7%) was characterized by high probabilities of engaging in reciprocal relational processes (e.g., initiated and accepted) and a lower probability of endorsing Facebook-specific relational contexts and thus, was labeled the “Facebook Avoidant Reciprocal Relations” class. Class 3 (24.0%) had high probabilities of engaging across multiple contexts (e.g., technology and face-to-face settings), as well as lower probabilities of reporting initiated relations and thus, Class 3 was labeled the “Multicontextual Passive Relations” class. Finally, Class 4 (12.7%) was labeled the “Technology-dominated Passive Relations” class, due to the low probabilities of engaging in all forms of initiated and group relations and face-to-face passive relations, and moderate probabilities of accepting technology-based relations.
Figure 2.
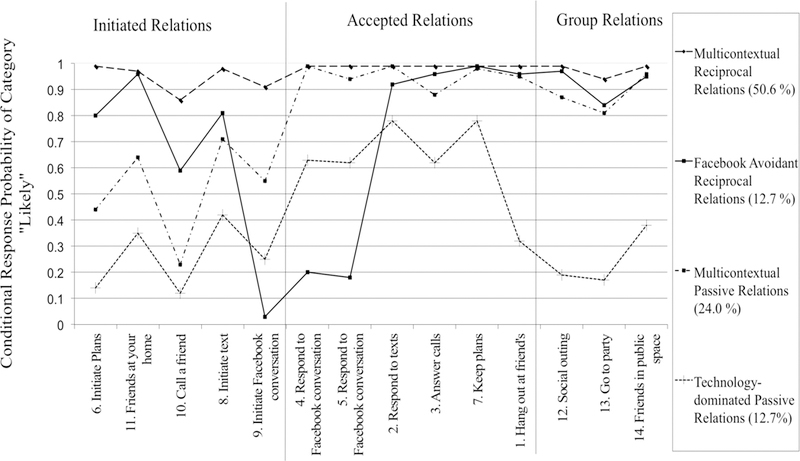
4-Class LCA Conditional Response Probability of Category “Likely”
To assess potential relationships between demographics and class membership, age, gender, education, and race were examined as covariates in the next step of the analysis. The 4-class solution did not change in structure when the covariates were added directly into the LCA model (Clark & Muthén, 2009). Only gender was significantly related to class membership. Results from the LCA with covariates analyses revealed significant differences in class membership by gender. Specifically, females had significantly lower odds (OR: 0.43, p < .001) of being classified in the Facebook Avoidant Reciprocal Relations class (Class 2) than males. No differences in class membership by race were identified.
Results from the LCA with depressive symptoms and life satisfaction included as covariates in the model revealed significant differences in class membership by depressive symptoms and life satisfaction. Specifically, for every one-point increase above the mean depressive symptomology there were higher odds of being in the Facebook Avoidant Reciprocal Relations class (OR: 1.01, p < .001), Multicontextual Passive class (OR: 1.05, p < .001), and the Technology-dominated Passive class (OR: 1.05, p < .001) as compared to Multicontexual Reciprocal class. Further, for every one-point increase above the mean life satisfaction there were lower odds of being in the Facebook Avoidant Reciprocal Relations class (OR: 0.94, p < .001), Multicontextual Passive class (OR: 0.94, p < .001) and the Technology-dominated Passive class (OR: 0.89, p < .001) as compared to Multicontexual Reciprocal class.
The results from the log likelihood difference tests from the LCA analyses that tested whether mean depressive symptoms and life satisfaction scores varied across classes highlighted significant mean differences in depressive symptoms and life satisfaction between classes. As predicted, the Multicontextual Reciprocal Relations class reported the lowest mean depressive symptoms (M = 11.08) and the Technology-dominated Passive Relations class reported the highest mean depressive symptoms (M = 22.93). The Facebook Avoidant Reciprocal Relations class reported the second lowest mean depressive symptoms (M = 13.09), followed by the Multicontextual Passive Relations class (M = 21.90). Further, the Multicontextual Reciprocal Relations class reported the highest life satisfaction (M = 25.05) and the Technology-dominated Passive Relations class reported the lowest mean life satisfaction (M = 18.37). Finally, the Facebook Avoidant Reciprocal Relations class reported the second highest mean score (M= 21.95), followed by the Multicontextual Passive Relations class (M = 21.69).
Discussion
The present study aimed to examine common patterns of modern interpersonal relational processes and contexts and their relations to depressive symptoms and life satisfaction. The results from the LCA suggest that a 4-class model best accounts for the response pattern probabilities for the 14-item MIRS. The 4-class solution separated individuals into groups based on patterns of engagement in various interpersonal relational processes and contexts with high classification accuracy, as reflected by the high entropy value and strong average class assignment probabilities for the most likely class membership. The results from the LCA with depressive symptoms and life satisfaction as covariates offer 2 important insights about the associations between interpersonal relationships and positive psychological health: (1) participating in a range of multifaceted interpersonal relational processes and contexts and (2) maintaining reciprocal relationships. Each of the findings are discussed below.
Consistent with previous findings (Coplan, Girardi & Findlay, 2007; Peterson, Park & Seligman, 2005; Kraut et al., 2002), the results from the LCA with covariates suggest engaging in multifaceted interpersonal relations is an indicator of depressive symptoms and life satisfaction. Specifically, the results indicate that individuals with higher depressive symptomology or lower life satisfaction have greater odds of being placed in a class other than the class characterized by high response probabilities across all interpersonal relational processes and contexts (Multicontextual Reciprocal Relations). Similarly, membership in classes characterized by multicontextual and/or reciprocal relations (e.g., Multicontextual Reciprocal Relations or Facebook Avoidant Reciprocal) was associated with lower depressive symptomology and higher life satisfaction than membership in classes characterized by high probabilities of technology-based contexts and/or passive relational processes (e.g., Technology-dominated Passive or Multicontextual Passive Relations). The results from the current study suggest that engaging in a broad range of relational processes and contexts is related to lower depressive symptomology and higher life satisfaction. This finding suggests that clinicians should evaluate the range of their clients’ interpersonal relations to determine whether clients are isolating themselves in more than one domain. Clinicians may seek to improve the psychological health and life satisfaction of their clients by motivating them to participate in a multifaceted set of interpersonal relations. Moreover, public health initiatives should consider ways to motivate communities to participate in a wide range of interpersonal relational processes and contexts to ultimately improve depressive symptomology and life satisfaction.
Participants in classes that include face-to-face relational contexts reported lower depressive symptomology and higher life satisfaction than those in the Technology-dominated Passive Relations class. This finding is consistent with previous research (Przybylski & Weinstein, 2017), which suggested that increased digital screen time was associated with poorer mental well-being. The results suggest that those who do not engage in face-to-face relations may rely on technology-based relational contexts and remain otherwise withdrawn (Nelson et al., 2016; Kraut et al., 2002), and thus maintain poor psychological health. This finding brings with it concerns about the steady increase in technology-based methods of connection. Clinicians should work with withdrawn clients to motivate participation in face-to-face relational contexts. Additionally, public health campaigns should focus on the important of forming and maintaining face-to-face relations in a society where social media use and technology-based connections steadily increase.
Finally, reciprocal interactions are essential to developing and maintaining friendship (Rubin, Bukowski, & Parker, 2006) and thus, may play a role in understanding depressive symptoms and life satisfaction. The results of the current study suggest that participating in reciprocal interactions is an indicator of psychological health. Specifically, participants who fell into classes characterized by participation in both initiated and accepted relations classes reported lower depressive symptomology and higher life satisfaction than did participants in classes characterized by passive relations regardless of how multifaceted their passive relations were. This finding suggests that reciprocal relationships are associated with better psychological health and life satisfaction. It is possible that individuals with higher depressive symptoms and lower life satisfaction tend to avoid initiating relations or that individuals with weaker friendship ties maintain poorer mental well-being. Clinicians may consider assessing clients’ interpersonal relation patterns with the MIRS to evaluate the extent to which clients maintain reciprocal relationships. Based on their assessment, clinicians may help work with clients to develop reciprocal relationships with their friends by developing ways to reduce potential anxiety around initiating engagement with peers.
Taken together, the findings from the current study offer a unique class structure to examine interpersonal relational processes and contexts that may then be used to examine the role of interpersonal relations in understanding depressive symptoms and life satisfaction. The current study suggests that depressive symptoms and life satisfaction are associated with a multifaceted range of relations that include both reciprocal interactions and face-to-face relations. The results of the current study may be extended to clinicians and public health efforts that aim to improve the overall depressive symptomology and life satisfaction.
Limitations
Although the study provides support for the hypothesized class structure of the scale, there are several limitations. First, the current study examined a sample of well-educated Amazon Mechanical Turk (MTurk) users. Consistent with other studies that have used MTurk to collect data (e.g., Berinsky, Huber, & Lenz, 2012), the current sample included a higher percentage of participants who have obtained an associates or bachelors degree as compared to the general United States population, which may limit the generalizability of the study findings. However, MTurk samples have been regarded as more representative of the general population when compared to other common convenience samples (e.g., college students; Berinsky, Huber, & Lenz, 2012; Casler, Bickel, & Hackett, 2013). Similarly, the current study does not include other potential demographic covariates (e.g., income), which may have additional implications for generalizability. As with any convenience sampling method, the use of Amazon Mechanical Turk to collect participants may introduce selection bias and may also offer a sample that is more technology savvy than the general population. Further, the MIRS only examines one social media outlet; Facebook. While Facebook is commonly used, there are a wide range of social media platforms. As such, future research should seek to extend this research by examining the class structure and its relation to depressive symptoms and life satisfaction with different social media platforms. While the current study used the BDI, a validated measure of depressive symptoms, however one item was missing due to a technical error. Further, the current cross-sectional analysis does not examine the temporality of the interpersonal relations and mental well-being relationship. Longitudinal studies of the MIRS will be helpful in further examining whether patterns in interpersonal relational processes and contexts influence or are influenced by depressive symptoms and life satisfaction.
Despite these limitations, the current studies provide a valuable contribution to the field of affective disorders. By examining modern patterns of interpersonal relational processes and contexts and their relation to depressive symptoms and life satisfaction, researchers can answer many questions about how technology is associated with the way we interact in our environment, and how those interactions are related to psychological health. Future research can add to the current findings by developing public health campaigns to increase engagement in face-to-face connections and reciprocal relations, or by examining how patterns of interpersonal relations longitudinally influence depressive symptomology and life satisfaction.
Acknowledgement:
This study was supported by Grant Number T32 MH082761 from the National Institute of Mental Health (PI: Scott Crow). The content is solely the responsibility of the authors and does not necessarily represent the official views of the National Institute of Mental Health or the National Institutes of Health.
Funding
The corresponding author, M.S.’s, current fellowship is funded by the National Institute of Mental Health (PI: Scott Crow; T32 MH082761). Thus, the study was, in part, supported by the National Institute of Mental Health. The content of this manuscript is solely the responsibility of the authors and does not necessarily represent the official views of the National Institute of Mental Health or the National Institutes of Health.
Footnotes
Compliance with Ethical Standards
Ethical Approval
All procedures performed in studies involving human participants were in accordance with the ethical standards of the institutional and/or national research committee and with the 1964 Helsinki declaration and its later amendments or comparable ethical standards.
Informed Consent
Informed consent was obtained from all individual participants included in the study (see Procedures section on page 5 for a detailed description).
Conflicts of Interest
Author MS declares that she has no conflict of interest. Author CG declares that he has no conflict of interest. Author GL declares that she has no conflict of interest.
References
- Beck AT, Ward CH, Mendelson M, Mock J, & Erbaugh J (1961). An inventory for measuring depression. Archives of General Psychiatry, 4, 561–571. 10.1001/archpsyc.1961.01710120031004 [DOI] [PubMed] [Google Scholar]
- Berinsky AJ, Huber GA, Lenz GS (2012). Evaluating online labor markets for experimental research: Amazon.com’s Mechanical Turk. Political Analysis, 20, 351–368. [Google Scholar]
- Birnie SA, & Horvath P (2002). Psychological predictors of internet social communication. Journal of Computer-Mediated Communication, 7(4), 0-0. [Google Scholar]
- Casler K, Bickel L, Hackett E (2013). Separate but equal? A comparison of participants and data gathered via Amazon’s MTurk, social media, and face-to-face behavioral testing. Computers in Human Behavior, 29, 2156–2160. [Google Scholar]
- Clark SL, & Muthén B (2009). Relating latent class analysis results to variables not included in the analysis. Manuscript submitted for publication. http://www.statmodel.com/download/relatinglca.pdf [Google Scholar]
- Coplan RJ, Girardi A, Findlay LC, & Frohlick SL (2007). Understanding solitude: young children’s attitudes and responses towards hypothetical socially-withdrawn peers. Social Development, 16, 390–409. doi: 10.1111/j.1467-9507.2007.00390.x [DOI] [Google Scholar]
- Celeux G, & Soromenho G (1996). An entropy criterion for assessing the number of clusters in a mixture model. Journal of Classification, 13, 195–212 [Google Scholar]
- Diener E, Emmons RA, Larsen RJ, & Griffin S (1985). The satisfaction with life scale. Journal of Personality Assessment, 49(1), 71–75. doi: 10.1207/s15327752jpa4901_13. [DOI] [PubMed] [Google Scholar]
- Kandel DB (1978). Homophily, selection, and socialization in adolescent friendships. American Journal of Sociology, 84, 427–436 [Google Scholar]
- Kraut R, Kiesler S, Boneva B, Cummings J, Helgeson V, & Crawford A (2002). Internet paradox revisited. Journal of Social Issues. 58, 49–74. doi: 10.1111/1540=4560.00248. [DOI] [Google Scholar]
- Laska MN, Pasch KE, Lust K, Story M, & Ehlinger E (2009). Latent class analysis of lifestyle characteristics and health risk behaviors among college youth. Prevention Science, 10(4), 376–386 [DOI] [PMC free article] [PubMed] [Google Scholar]
- McLachlan G, & Peel D (2000). Finite mixture models. New York: Wiley. [Google Scholar]
- Measelle JR, Stice E, & Hogansen JM (2006). Developmental trajectories of co-occurring depressive, eating, antisocial, and substance abuse problems in female adolescents. Journal of Abnormal Psychology, 115(3), 524–538. doi: 10.1037/0021-843X.115.3.524 [DOI] [PMC free article] [PubMed] [Google Scholar]
- Muthén LK, & Muthén BO (1998-2011). Mplus User’s Guide. Sixth Edition Los Angeles, CA: Muthén & Muthén. [Google Scholar]
- Muthén LK, Muthén BO. Re: What is a good value of entropy. 2007. [Online comment]. Retrieved from: http://www.statmodel.com/discussion/messages/13/2562.html?1237580237
- Nelson LJ, Coyne SM, Howard E, & Clifford BN (2016). Withdrawing to a virtual world: Associations between subtypes of withdrawal, media use, and maladjustment in emerging adults. Developmental Psychology, 52(6), 933–942. doi: 10.1037/dev0000128. [DOI] [PubMed] [Google Scholar]
- Nelson LJ (2013). Going it alone: Comparing subtypes of withdrawal on indices of adjustment and maladjustment in emerging adulthood. Social Development, 22, 533–538. doi: 10.1111/j.1467-9507.2012.00671.x [DOI] [Google Scholar]
- Nylund KL, Asparouhov T, & Muthén BO (2007). Deciding on the number of classes in latent class analysis and growth mixture modeling: A monte carlo simulation study. Structural Equation Modeling: A Multidisciplinary Journal, 14(4), 535–569. doi: 10.1080/10705510701575396 [DOI] [Google Scholar]
- Patterson BH, Dayton CM, Graubard BI (2002). Latent class analysis of complex sample survey data. Journal of American Statistical Association, 97(459), 721–741 [Google Scholar]
- Peterson C, Park N, & Seligman MEP (2005). Orientations to happiness and life satisfaction: The full life versus the empty life. Journal of Happiness Studies, 6(1), 25–41 [Google Scholar]
- Pew Research Center. (2012). Cell Phone Activities 2012: The Internet & American Life Project. Washington, DC: Duggan M & Rainie L. [Google Scholar]
- Pew Research Center. (2016). Social Media Update 2016. Washington, DC: Greenwood S., Perrin A & Duggan M. [Google Scholar]
- Przybylski AK, & Weinstein N (2017). A large-scale test of the goldilocks hypothesis: Quantifying the relations between digital-screen use and the mental well-being of adolescents. Psychological Science, 28(2), 204–2015. doi: 10.1177/0956797616678438 [DOI] [PubMed] [Google Scholar]
- Reese JB, Blackford A, Sussman J, Okuyama T, Akechi T, Bainbridge D, Howeel D, & Snyder CF (2015). Cancer patients’ function, symptoms and supportive care needs: a latent class analysis across cultures. Quality of Life Research, 24(1), 135–146 [DOI] [PMC free article] [PubMed] [Google Scholar]
- Rubin KH, Bukowski W, & Parker JG (2006). Peer interactions, relationships, and groupsIn: Eisenberg N (Ed.), Handbook of child psychology: Social, emotional, and personality Development (pp. 571–645). New York: Wiley. [Google Scholar]
- Rubin KH, Coplan RJ, & Bowker JC (2009). Social withdrawal in childhood. Annual Review of Psychology, 60, 141–71. doi: 10.1146/annurev.psych.60.110707.163642 [DOI] [PMC free article] [PubMed] [Google Scholar]
- Sclove L (1987). Application of model-selection criteria to some problems in multivariate analysis. Psychometrika, 52, 333–343. doi: 10.1007/BF02294360 [DOI] [Google Scholar]
- Sheldon P (2008). The relationship between unwillingness-to-communicate and students’ Facebook use. Journal of Media Psychology, 20, 67–75. doi: 10.1027/l864-1105.20.2.67 [DOI] [Google Scholar]
- Simone M, Geiser C, & Lockhart G (2018). Development and Validation of the Multicontextual Interpersonal Relations Scale (MIRS). European Journal of Psychological Assessment. doi: 10.1080/10705511.2018.1540934 [DOI] [Google Scholar]