

Antimicrobial resistance (AMR) is a major public health problem that requires publicly available tools for rapid analysis. To identify AMR genes in whole-genome sequences, the National Center for Biotechnology Information (NCBI) has produced AMRFinder, a tool that identifies AMR genes using a high-quality curated AMR gene reference database.
KEYWORDS: Campylobacter, Salmonella, analytical software, antimicrobial resistance, computational biology, database, foodborne pathogens, genomics, surveillance
ABSTRACT
Antimicrobial resistance (AMR) is a major public health problem that requires publicly available tools for rapid analysis. To identify AMR genes in whole-genome sequences, the National Center for Biotechnology Information (NCBI) has produced AMRFinder, a tool that identifies AMR genes using a high-quality curated AMR gene reference database. The Bacterial Antimicrobial Resistance Reference Gene Database consists of up-to-date gene nomenclature, a set of hidden Markov models (HMMs), and a curated protein family hierarchy. Currently, it contains 4,579 antimicrobial resistance proteins and more than 560 HMMs. Here, we describe AMRFinder and its associated database. To assess the predictive ability of AMRFinder, we measured the consistency between predicted AMR genotypes from AMRFinder and resistance phenotypes of 6,242 isolates from the National Antimicrobial Resistance Monitoring System (NARMS). This included 5,425 Salmonella enterica, 770 Campylobacter spp., and 47 Escherichia coli isolates phenotypically tested against various antimicrobial agents. Of 87,679 susceptibility tests performed, 98.4% were consistent with predictions. To assess the accuracy of AMRFinder, we compared its gene symbol output with that of a 2017 version of ResFinder, another publicly available resistance gene detection system. Most gene calls were identical, but there were 1,229 gene symbol differences (8.8%) between them, with differences due to both algorithmic differences and database composition. AMRFinder missed 16 loci that ResFinder found, while ResFinder missed 216 loci that AMRFinder identified. Based on these results, AMRFinder appears to be a highly accurate AMR gene detection system.
INTRODUCTION
Antimicrobial resistance (AMR) is a major public health problem, with an estimated 23,000 deaths annually in the United States attributable to antimicrobial resistant infections (https://www.cdc.gov/drugresistance/threat-report-2013/index.html). The ongoing evolution of multidrug resistance ensures that AMR will continue to be a health challenge for years to come. As described in the National Strategy on Combating Antibiotic Resistant Bacteria report (1), there is a critical need to understand how AMR is related to bacterial genotype, both to enhance AMR mechanism discovery and to enable AMR diagnostics. One key method to establish this link is genome sequencing, which can also be used for surveillance purposes.
Traditionally, AMR has been identified using phenotypic assays. The gold standard for measuring antimicrobial susceptibility is based on standardized dilution- or diffusion-based in vitro antimicrobial susceptibility testing (AST) methods, where extensive research and testing have been performed to correlate AST measurements with clinical outcomes (2). Increasingly, molecular methods are being used in resistance surveillance and, in some cases, also to guide clinical therapy. These methods range from PCR detection of known resistance elements (3) to mass spectrometry-based methods (4–8). Whole-genome shotgun sequencing (WGS) has been integrated into the clinical and public health settings, though the use of WGS has focused primarily on outbreak identification and tracking (9, 10). Along with epidemiological uses, there is great potential for the use of WGS to aid AMR detection (11–16). Accurate assessment of AMR gene content enables the discovery of novel resistance variants and can serve as the basis for predicting resistance phenotypes without the need for time-consuming phenotypic tests (12, 17, 18).
An in silico approach to assessing AMR content requires comprehensive and accurate AMR gene databases, as well as tools that can reliably identify AMR genes. There are many databases and tools using a variety of approaches and data sources, as described in a recent review (19). While some tools exclusively use BLAST-based approaches (20), others incorporate hidden Markov model (HMM) approaches (21). BLAST-based approaches are able to identify specific alleles and closely related genes. However, BLAST-based methods use arbitrary cutoffs that can miscall AMR genes or even misattribute resistance to non-AMR genes (e.g., misidentification of metallo-beta-hydrolases as metallo-beta-lactamases [22]). HMM approaches facilitate a hierarchical classification of AMR proteins, from alleles to gene families, but curation and validation of HMM libraries are required. Tools also differ based on whether they analyze nucleotide or protein sequences. Additionally, some tools are only available through a Web interface, while others can be operated on local servers, providing more flexibility to users. Researchers attempting to use currently available AMR databases must choose between these different database resources. Some contain collections of alignments of resistance genes for use in HMMs (21). Others consist of collections of nucleotide or protein sequences of either individual resistance genes or resistance-related mobile elements (23, 24). Some databases are actively curated, such as the Comprehensive Antibiotic Resistance Database (CARD) (24, 25), ResFinder (23), and the Lahey Clinic database (https://www.lahey.org/Studies/; now hosted and maintained by the National Center for Biotechnology Information [NCBI] as part of the NCBI’s Bacterial Antimicrobial Resistance Reference Gene Database), while others are not actively updated. Separate groups curate different classes of genes, and even a single class of genes (e.g., beta-lactamases) can be curated by multiple groups. In addition, some data resources include allelic variation of housekeeping genes that can confer or contribute to resistance, while others focus exclusively on acquired or common but not universal chromosomal resistance mechanisms (here referred to for brevity as “acquired”). Assessing and comparing these resources and tools is also challenging, as there are few high-quality strain collections that have been extensively genotyped and phenotyped and that are also publicly available.
Here, we describe the development of a comprehensive AMR gene database, the Bacterial Antimicrobial Resistance Reference Gene Database, and the development of AMRFinder, an AMR gene identification tool, along with publicly available data sets to test AMR gene detection methods. To identify AMR genes from sequence data, we created over 560 AMR HMMs (22) and curated over 4,579 AMR protein sequences, placing both in a hierarchical framework of gene families, symbols, and names in collaboration with multiple groups, including CARD (22). We then developed AMRFinder to leverage both the content and structure of this database to accurately identify and name AMR gene sequences.
Our database is protein-based since AMR gene nomenclature, including beta-lactamase allele designation, is defined by protein identity and similarity. Working in protein space also enables the use of protein-based HMMs that have been informed by biological data to discover potentially novel AMR genes. AMRFinder’s hierarchical framework of gene families, symbols, and names is designed to report accurate gene symbols (e.g., blaKPC-2), as the gene symbol is usually the key data type used in high-throughput genomic surveillance of AMR.
To validate this system for high-throughput use, we used a collection of isolates from the National Antimicrobial Resistance Monitoring System (NARMS) program, a U.S. surveillance system that tracks critically important food-associated pathogens collected from a range of sources and multiple laboratories that have undergone extensive susceptibility testing and whole-genome shotgun sequencing. We compare our results to earlier surveys AMR in foodborne isolates, and we also compared AMRFinder performance with that of a version of ResFinder 2.0 released in 2017.
RESULTS
We constructed a database of AMR genes, the Bacterial Antimicrobial Resistance Reference Gene Database (https://www.ncbi.nlm.nih.gov/pathogens/isolates#/refgene/), based on protein sequences that are publicly available and accessioned in RefSeq. We also constructed a set of HMMs that have manually curated and validated cutoffs. We built a tool, AMRFinder, that uses our reference database of protein sequences, the HMM set, and a protein family hierarchy to apply protein names as well as gene names to annotated bacterial genomes with the most specification possible based on the sequence evidence. The AMRFinder tool generates a report of the names, symbols, and coordinates of acquired AMR genes along with descriptions of the evidence used to identify the sequence (https://www.ncbi.nlm.nih.gov/pathogens/antimicrobial-resistance/AMRFinder/).
Validation of AMRFinder using genotype/phenotype correlations.
To verify and validate the results of the AMRFinder system, we analyzed a collection of isolates that were sequenced and susceptibility tested as part of the NARMS program. We then compared the resistance patterns predicted by AMR genes identified in the genome sequence to the results of the phenotypic susceptibility tests (and, when tested, point mutations). We further compared the resistance gene calls made by AMRFinder to calls from the commonly used resistance gene finding tool ResFinder (23).
A total of 6,301 NARMS isolates with both phenotypes and whole-genome shotgun sequences were compiled, and 59 were removed for quality reasons described above, leaving 6,242 isolates for this analysis (Fig. 1). After assembly and annotation, AMRFinder was used to generate a list of 16,003 AMR gene calls, yielding 132 unique genes and alleles. Resistance predictions for the 132 genes and alleles observed in the set of 6,242 isolates were compiled from the literature (Table S4) and used to predict resistance.
FIG 1.
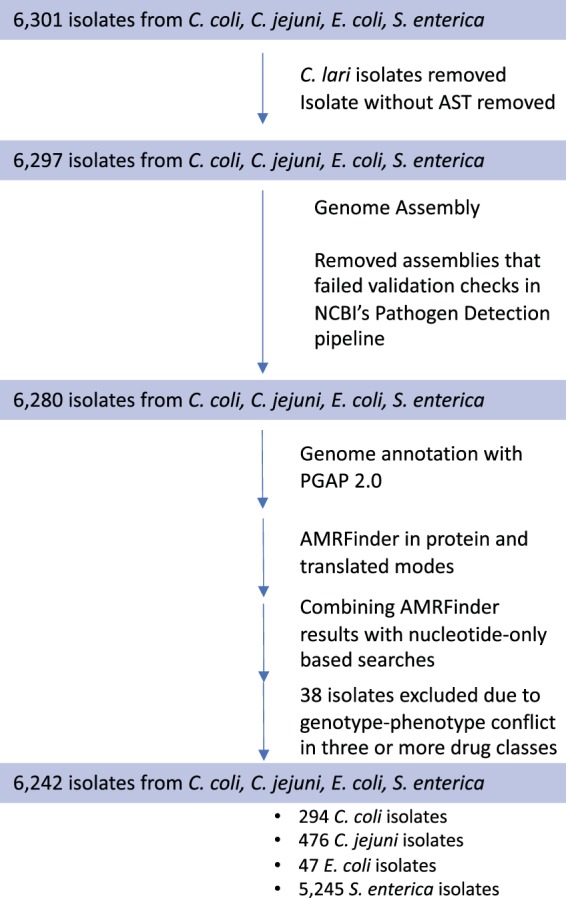
Data processing and analysis flow. Processing steps and isolate inclusion and exclusion criteria are indicated by arrows, with the number of isolates retained in each phase indicated in the colored boxes. Thirty-eight isolates were excluded if their AST phenotypes in three or more drug classes differed from predictions based on acquired AMR genes.
For the entire set, 87,679 susceptibility tests were performed. A high proportion, 98.4% (86,276), were consistent with predictions based on the resistance genotypes (acquired resistance genes, and, when tested, point mutations). Of the 13,903 tests that were predicted to be resistant, 95.5% were observed to be resistant (positive predictive value [PPV] = 0.955), while of the 73,776 tests expected to be susceptible, 99.2% were observed to be susceptible (negative predictive value [NPV] = 0.992; Table 1). A total of 2,136 of the 6,242 isolates (34.2%) were pansusceptible. Gentamicin and streptomycin susceptibility calls in Salmonella enterica were the most common incorrect predictions, accounting for 38% of inconsistent calls (532/1,403). In total, 17% of all isolates (1,053) had one or more inconsistent calls between genotype and phenotype.
TABLE 1.
Consistency between antibiotic susceptibility phenotypes and genotype-based predictions for all NARMS isolatesa
| No. of isolates predicted by genotype | No. of phenotype observations |
|
|---|---|---|
| Resistant | Susceptible | |
| Resistant | 13,122 | 781 |
| Sensitive | 622 | 73,154 |
Overall consistency was 98.4% of susceptibility tests performed, with a PPV of 0.955 and an NPV of 0.992.
Escherichia coli and Salmonella enterica genotype-phenotype associations.
Escherichia coli isolates had the highest consistency, with 99.7% (656/658) of susceptibility tests predicted by the resistance genotype. Within S. enterica isolates, 98.0% of susceptibility tests were consistent with the resistance genotype, with a PPV of 0.94 and an NPV of 0.992 (Table 2). No resistance to amikacin or meropenem was observed or predicted among E. coli and S. enterica isolates.
TABLE 2.
S. enterica susceptibility and consistency with AMRFinder genotypic predictiona
| Antibiotic | No. of isolates |
% consistentc | % resistant | PPVd | NPV | |
|---|---|---|---|---|---|---|
| Susceptibleb | Resistantb | |||||
| Amikacin | 2,820 | 0 | 100.0% | 0.0% | NC | 1 |
| AMC | 4,622 (7) | 718 (38) | 99.2% | 14.0% | 0.99 | 0.992 |
| Ampicillin | 3,734 (27) | 1,620 (44) | 98.7% | 30.7% | 0.984 | 0.988 |
| Azithromycin | 2,592 (5) | 6 (1) | 99.8% | 0.3% | 0.545 | 0.999 |
| Cefoxitin | 4,686 (67) | 658 (14) | 98.5% | 12.4% | 0.908 | 0.997 |
| Ceftiofur | 4,093 (13) | 697 (13) | 99.5% | 14.7% | 0.982 | 0.997 |
| Ceftriaxone | 4,652 (8) | 744 (21) | 99.5% | 14.7% | 0.989 | 0.996 |
| CHL | 5,214 (5) | 202 (4) | 99.8% | 3.8% | 0.976 | 0.999 |
| Ciprofloxacine | 5,283 (14) | 114 (14) | 99.5% | 2.4% | 0.891 | 0.997 |
| Co-trimoxazole | 5,343 (8) | 69 (5) | 99.8% | 1.4% | 0.896 | 0.999 |
| Gentamicin | 4,692 (109) | 571 (53) | 97.0% | 11.5% | 0.84 | 0.989 |
| Kanamycin | 3,382 (23) | 412 (67) | 97.7% | 12.3% | 0.947 | 0.981 |
| Meropenem | 609 | 0 | 100.0% | 0.0% | NC | 1 |
| Nalidixic acid | 5,294 (35) | 15 (81) | 97.9% | 1.8% | 0.3 | 0.985 |
| Streptomycin | 3,291 (254) | 1,756 (76) | 93.9% | 33.7% | 0.877 | 0.977 |
| Sulfonamide | 3,763 (35) | 1,572 (55) | 98.3% | 30.0% | 0.978 | 0.986 |
| Tetracycline | 2,558 (42) | 2,776 (49) | 98.3% | 52.1% | 0.985 | 0.981 |
Overall consistency was 98.0%, with a PPV of 0.94 and an NPV of 0.992.
The number of isolates with genotypes consistent with either phenotypic susceptibility or resistance to a given antibiotic is shown, with the number of isolates with genotypes inconsistent with either susceptibility or resistance to a given antibiotic displayed in parentheses; values of zero in parentheses have been dropped for clarity.
“% consistent” describes the percentage of isolates with a phenotype consistent with genotype.
NC means the value cannot be calculated as there are no expected resistant isolates.
For ciprofloxacin, the no. of resistant isolates included isolates with intermediate and resistant MIC results.
None of the 47 E. coli isolates was resistant to either nalidixic acid or ciprofloxacin, nor were any predicted to be. S. enterica displayed high consistency for both ciprofloxacin and nalidixic acid (Table 2). When decreased susceptibility (resistant [R] or intermediate [I]) versus susceptibility (susceptible [S]) is used to categorize ciprofloxacin phenotypes (26), S. enterica isolates had high positive predictive values (PPV = 0.891) and high negative predictive values (NPV = 0.997). For nalidixic acid, the positive predictive value was quite low (PPV = 0.3). Thirty-five qnr+ isolates (71.4%) were susceptible to nalidixic acid, but they had an MIC of one doubling dilution below the nalidixic acid breakpoint of 32 μg/ml (Fig. 2); 13 qnr+ isolates were resistant to nalidixic acid. These results are consistent with previous work that indicates that qnr loci might not be very effective at conferring resistance to nalidixic acid even though qnr loci can significantly increase nalidixic acid MICs (27). Of the 80 isolates that had ciprofloxacin resistance mutations, 79 were resistant to nalidixic acid. Thus, in S. enterica, the presence of qnr genes or known point mutations conferred either resistance or decreased susceptibility to ciprofloxacin.
FIG 2.

Qnr loci affect ciprofloxacin (a) and nalidixic acid (b) MICs in S. enterica. Columns on the x axis correspond to observed MIC values; brackets below indicate the susceptible, intermediate, or resistant (SIR) values for those MICs. On the y axis, colored bars indicate the percentage of isolates sharing the same genotype with a given MIC value. Numbers above each column indicate the number of isolates observed with that MIC and genotypes. In the side legend, the number in parentheses is the number of isolates with the corresponding genotype. “No genes” indicates those isolates lacking any predicted fluoroquinolone resistance genes. oqxAB indicates the presence of these fluoroquinolone resistance genes in an isolate. “qnr” indicates the presence of one of the following Qnr family genes: QnrB2, QnrB19, QnrB77, QnrS1, QnrS2, or an unassigned QnrB family allele. “oqxAB, qnr” indicates an OqxAB, QnrB19 genotype. Point mutations for ciprofloxacin (a) are indicated by the gene in which they occurred, followed by the site and changed residues.
Only six of 11 S. enterica isolates predicted to be azithromycin resistant were resistant. These six resistant isolates carried mph(A); however, one azithromycin-susceptible isolate also carried mph(A). The other four susceptible isolates carried either the ere(A) or abc-f resistance genes; these isolates did not have elevated MICs near the top end of the susceptible range.
As expected, we observed that 718 out of 725 S. enterica isolates (99.0%) with one or more blaCMY-family genes were resistant to amoxicillin-clavulanic acid. As observed previously (26), other beta-lactamases conferred decreased or intermediate susceptibility to amoxicillin-clavulanic acid (Fig. 3). In total, 92.6% of isolates (50/54) that carried a blaPSE/blaCARB family beta-lactamase (a novel blaCARB allele or blaCARB-2) displayed intermediate susceptibility to amoxicillin-clavulanic acid, while over half of those isolates (9/17) with a blaHER family beta-lactamase displayed intermediate susceptibility to amoxicillin-clavulanic acid, with the remainder having an MIC of 8 μg/ml, which is the highest MIC categorized as susceptible. blaTEM isolates had a similar pattern, with nearly half displaying intermediate susceptibility to amoxicillin-clavulanic acid.
FIG 3.

Beta-lactamases confer unexpected decreased susceptibility to amoxicillin-clavulanic acid in S. enterica. x and y axes in Fig. 3. Allelic variants within a beta-lactamase family are grouped together under the family name; an isolate can have multiple alleles belonging to the same family. blaPSE family beta-lactamases are either CARB-2 or unassigned CARB alleles. blaCMY family beta-lactamases were either novel blaCMY alleles or the CMY-2 allele. blaHER indicates either the HER-3 allele or a novel HER-family allele. blaTEM indicates either a novel TEM allele or TEM-1. “No genes” indicates those isolates lacking beta-lactamases.
Overall, the presence or absence of acquired gentamicin and kanamycin resistance genes was a good predictor of susceptibility phenotypes (Table 2). Of the 2,820 Salmonella isolates that were tested for susceptibility to amikacin, none were resistant, nor were they predicted to be resistant. However, we noticed that several reported gentamicin and kanamycin resistance genes conferred decreased susceptibility to gentamicin and kanamycin even if the MICs were not high enough to qualify as resistant (Fig. 4a and b). The majority of aac(3)-IV+ isolates (36/47) and 26% of ant(2″)-Ia+ isolates displayed intermediate susceptibility to gentamicin. Many aac(6′)-Ib+ isolates were susceptible to gentamicin, but the MICs of these isolates were higher than those of isolates lacking known resistance genes. While most kanamycin resistance genes were associated with phenotypic resistance, 13% of ant(2″)-Ia+ isolates had intermediate susceptibility.
FIG 4.

Gentamicin (a) and kanamycin (b) resistance in S. enterica. Format as described for Fig. 2 except aminoglycoside-modifying genes are grouped together by family. “No genes” indicates isolates lacking any predicted gentamicin and kanamycin resistance genes, respectively.
As noted previously, streptomycin susceptibility calls accounted for a large fraction of the inconsistent calls, with many such isolates containing putative streptomycin resistance genes. There were no obvious direct relationships between particular resistance genes and streptomycin susceptibility (see Table S7). We examined whether partial genes (defined as 50% to 90% of the closest reference protein length) affected susceptibility calls. Partial genes accounted for only 6.4% of streptomycin discrepancies, suggesting this observation is not due to potential nonfunctional genes. While the mechanism of discordance between streptomycin resistance genes and susceptibility is unclear, this relationship has been observed in multiple surveys of Enterobacteriaceae (15, 17, 26, 28, 29; see also Table S8).
Campylobacter genotype-phenotype associations.
Campylobacter coli had the lowest consistency, with 96.7% of susceptibility tests consistent with the resistance genotype, a PPV of 0.904, and an NPV of 0.982 (Table 3). In total, 98.9% of phenotypes were accurately predicted for Campylobacter jejuni, with PPV = 0.971 and NPV = 0.992 (Table 4).
TABLE 3.
C. coli susceptibility and consistencya
| Antibiotic | No. of isolates |
% consistentc | % resistant | PPVd | NPV | |
|---|---|---|---|---|---|---|
| Susceptibleb | Resistantb | |||||
| Azithromycin | 265 | 29 | 100.0% | 9.9% | 0.763 | 1 |
| Ciprofloxacin | 207 | 87 | 100.0% | 29.6% | 1 | 1 |
| Clindamycin | 248 | 29 (17) | 94.2% | 15.6% | NC | 0.844 |
| Erythromycin | 265 | 29 | 100.0% | 9.9% | 0.763 | 1 |
| Florfenicol | 294 | 0 | 100.0% | 0.0% | NC | 1 |
| Gentamicin | 288 | 6 | 100.0% | 2.0% | 1 | 1 |
| Nalidixic acid | 201 (3) | 87 (3) | 98.0% | 30.6% | 1 | 0.986 |
| Telithromycin | 257 (16) | 21 | 94.6% | 7.1% | 0.553 | 1 |
| Tetracycline | 80 (3) | 210 (1) | 98.6% | 71.8% | 0.989 | 0.988 |
Overall consistency was 96.7%, with a PPV of 0.904 and an NPV of 0.982.
The number of isolates with genotypes consistent with either susceptibility or resistance to a given antibiotic is shown, with the number of isolates with genotypes inconsistent with either susceptibility or resistance to a given antibiotic displayed in parentheses. Values of zero in parentheses have been dropped for clarity.
“% consistent” describes the percentage of isolates with a consistent phenotype. For macrolides and fluoroquinolones, consistency estimates include point mutation data.
NC means the value cannot be calculated as there are no expected resistant isolates.
TABLE 4.
C. jejuni susceptibility and consistencya
| Antibiotic | No. of isolates |
% consistent | % resistant | PPVb | NPV | |
|---|---|---|---|---|---|---|
| Susceptible | Resistant | |||||
| Azithromycin | 476 | 0 | 100.0% | 0.0% | 0 | 1 |
| Ciprofloxacin | 386 (1) | 86 (3) | 99.2% | 18.7% | 0.989 | 0.992 |
| Clindamycin | 470 | 0 (6) | 98.7% | 1.3% | NC | 0.987 |
| Erythromycin | 476 | 0 | 100.0% | 0.0% | 0 | 1 |
| Florfenicol | 476 | 0 | 100.0% | 0.0% | NC | 1 |
| Gentamicin | 475 | 0 (1) | 99.8% | 0.2% | NC | 0.998 |
| Nalidixic acid | 385 (3) | 86 (2) | 98.9% | 18.7% | 0.977 | 0.992 |
| Telithromycin | 476 | 0 | 100.0% | 0.0% | 0 | 1 |
| Tetracycline | 145 (4) | 325 (2) | 98.7% | 68.9% | 0.988 | 0.986 |
Overall consistency was 98.9%, with a PPV of 0.971 and an NPV of 0.992.
The number of isolates with genotypes consistent with either susceptibility or resistance to a given antibiotic is shown, with the number of isolates with genotypes inconsistent with either susceptibility or resistance to a given antibiotic displayed in parentheses. Values of zero in parentheses have been dropped for clarity.
In C. coli and C. jejuni, fluoroquinolone resistance was associated with point mutations, not with acquired genes (Tables 3, 4). Based on previous reports (12), we examined the relationship between gyrA mutations previously determined to confer fluoroquinolone resistance and fluoroquinolone-resistant isolates among these Campylobacter species isolates. All but two fluoroquinolone-resistant and no fluoroquinolone-susceptible C. coli isolates possessed a GyrA T86I mutation (Table S5). In C. jejuni, 84/85 isolates with GyrA T86I mutations were resistant to ciprofloxacin, and 83/85 were resistant to nalidixic acid; three C. jejuni isolates without known fluoroquinolone resistance mutations were resistant to both quinolones; no unique mutations were found in these three isolates.
All C. jejuni isolates were susceptible to azithromycin, erythromycin, and telithromycin, with only six C. jejuni isolates displaying resistance to clindamycin (Table 4). None of the clindamycin-resistant C. jejuni isolates had any screened known resistance mutations or novel mutations at screened sites, suggesting novel resistance mutations in either 23S or the 50S/L22 subunit (Table S5). Macrolide resistance was far more common in C. coli (Table 3), with most resistant isolates possessing an A2075G mutation in 23S (Table S6), as has been observed previously (12).
AMRFinder-ResFinder comparison.
ResFinder is a widely used AMR determinant detection program (23). To assess the relative accuracy of AMRFinder, we compared the gene symbol calls at similar positions in the two tools. As described in Materials and Methods, discrepant gene symbol calls were classified into the following four different categories: synonyms, overspecification (e.g., calling a novel or partial blaTEM allele as blaTEM-1), underspecification (e.g., calling an actual blaTEM-1 allele a blaTEM family allele), and miscalls (e.g., mislabeling a full-length, 100% identical sequence as a different, known full-length sequence).
Overall, out of 14,023 AMR genes identified by both AMRFinder and ResFinder, there were 1,229 gene symbol discrepancies (Table 5 and Table S8). These discrepancies could be mapped to 42 gene symbols out of a total of 132 unique AMRFinder gene symbol calls. ResFinder misidentified 247 genes with an exact match to a known AMR gene or allele (e.g., misidentifying blaOXA-193 as blaOXA-61), and overspecified the gene symbol in 977 cases, representing 18 misidentified gene symbols and 21 overspecified gene symbols out of the set of 132 unique AMR gene symbols. AMRFinder underspecified three gene symbols, representing five cases.
TABLE 5.
Discrepancies by category observed in gene symbol calls by AMRFinder and ResFinder 2.0 from 2017
| Error typea | AMRFinder | ResFinder |
|---|---|---|
| Misclassification | 0 | 247 |
| Underspecification | 5 | 0 |
| Overspecification | 0 | 977 |
Synonyms are not included in this table, as they do not represent miscalls by either system.
The ResFinder misclassifications resulted from either the absence of the matching sequence in the ResFinder database used in this study or a lack of correspondence between the closest nucleotide hit and actual observed sequence. For example, 32 aac(6′)-Ib family genes, including 22 known 100% identity aac(6′)-Ib4 sequences, were miscalled as aac(6′)-Ib-cr by ResFinder. The gene aac(6′)-Ib-cr contributes to decreased fluoroquinolone susceptibility and confers amikacin and tobramycin resistance, while aac(6′)-Ib4 does not confer resistance or decreased susceptibility to amikacin, ciprofloxacin, or tobramycin. We would note that none of the 16 S. enterica aac(6′)-Ib4+ isolates that also were tested for susceptibility to amikacin were resistant to amikacin, supporting the AMRFinder call of aac(6′)-Ib4. In 977 instances, ResFinder overspecified the gene symbol, as it calls the closest hit as the correct gene symbol. Many of these were novel, unnamed allelic variants of beta-lactamase families (n = 699; Table S8), and ResFinder reported the closest hit (e.g., blaOXA-61 when a novel blaOXA sequence was observed).
We also examined the loci that were missed by either ResFinder or AMRFinder. ResFinder did not find 1,147 AMR loci that AMRFinder identified (Table 6). Most of the missed loci (81.2%) belonged to drug or disinfectant classes that ResFinder does not cover, namely, bleomycin and quaternary ammonium compounds. Bleomycin resistance is included in the AMRFinder database and is highly associated with the clinically relevant NDM family carbapenemases (30), while qac enzymes can be linked to multiple resistance genes and are of regulatory interest in agriculture and in clinical surveillance (31). The next largest set of discrepancies belonged to AMR genes or alleles that were not represented in the ResFinder database (8.8%). The default setting length of 60% of the reference sequence also resulted in 111 missed calls. Of 66 genes not found by ResFinder that could be assessed by susceptibility data (out of the total of 111), 53 genes were consistent with the susceptibility data (associated with a resistant phenotype), while 13 were not.
TABLE 6.
Unique proteins found by AMRFinder
| Explanation | No. of proteinsc | % of proteins |
|---|---|---|
| Drug class not in ResFinder | 931 | 81.2 |
| Proteins below thresholdsa | 111 | 9.7 |
| Gene not found in ResFinder | 101 | 8.8 |
| Translation/frameshift errorsb | 4 | 0.3 |
In 10 cases, ResFinder was unable to detect these, as the nucleotide sequence was too divergent from any sequence found in the database. In 101 instances, there was no gene in the ResFinder database with >90% DNA sequence similarity to the predicted genes.
Frameshifts led to early stop codons, resulting in stop codon positions that differed by more than 40 bp between the two methods.
Total no. of proteins, 1,147.
AMRFinder missed 16 loci that ResFinder found. In all 16 cases, these were frameshifts or in-frame stop codons that resulted in a translated protein that either was not identified at all or had a stop codon position that differed from the ResFinder stop position by more than 40 bp. Of the three loci that AMRFinder missed that were assessed phenotypically, all of which were frameshifts, two were resistant in spite of the apparent frameshift, while one was susceptible. There were also 21 instances of an aph(6)-I like gene that was divergent from AMR genes in either the ResFinder or the AMRFinder protein databases. Due to this divergence, the two systems identified proteins that differed in length and thus had divergent start and stop sites, and were therefore called as misses. Given the small number of apparent frameshifts in our isolate collection, it is difficult to assess the role of frameshifts with regard to these particular data. From a general perspective of susceptibility prediction, failure to detect frameshifts would lead to the overestimation of resistance, since pseudogenes would be identified incorrectly as functional resistance genes.
DISCUSSION
We developed and populated a highly curated database with hierarchical structure for AMR proteins, manually curated cutoffs, and associated hierarchical names. AMRFinder uses this AMR protein database, HMMs, a hierarchy of AMR protein families, and a custom rule set to identify AMR genes. In addition, AMRFinder reports the evidence used to make each call so that users can evaluate its strength and their confidence in the call.
We observed high consistency between the presence of acquired AMR determinants and resistance phenotypes in a collection of over 6,200 NARMS isolates. We note, however, that, as part of our sample consisted of isolates that were resistant to one or more antibiotics, our choice of isolates might overestimate the overall PPV while underestimating the NPV. Incorporating mutational resistance also increased PPV and decreased NPV for certain drugs, especially fluoroquinolones and macrolides, as resistance to these drugs was predominantly mutational and not due to acquired AMR genes. The E. coli sample was small (n = 47), and most E. coli isolates were susceptible to most antibiotics, leading to very high consistency. In S. enterica, discrepancies in aminoglycoside resistance and fluoroquinolone resistance typically arose from acquired resistance genes conferring intermediate MICs or MICs at the high end of the susceptible range. As other studies in foodborne pathogens have demonstrated (26, 28), clinical breakpoints, while obviously critical for appropriate treatment, do not always correspond to the presence or absence of resistance genes.
Beta-lactam resistance in S. enterica showed high overall correlation between resistance phenotypes and genotypes. Beta-lactam resistance phenotypes and genotypes were highly correlated in S. enterica. Elevated MICs and intermediate susceptibility amoxicillin-clavulanic acid phenotypes in S. enterica were associated with the presence of beta-lactamases other than blaCMY. NCBI’s Pathogen Detection system (http://ncbi.nlm.nih.gov/pathogens), as part of a collaboration with the FDA GenomeTrakr (32), CDC PulseNet (33), and USDA Food Safety and Inspection Service (USDA-FSIS), routinely clusters genomes by sequence similarity, including those of the isolates described in this report, to support outbreak and traceback investigations of clonal isolates. We determined that these isolates belong to different single-nucleotide polymorphism clusters, and so it does not appear that this pattern stems from chance sampling of a single clone with an unknown resistance mechanism, although we cannot rule out an unknown, common mechanism of decreased susceptibility. One possible explanation for why blaPSE family-, blaHER-, and blaTEM beta-lactamase-carrying isolates would display this phenotypic difference could be that these beta-lactamases are overproduced in the presence of amoxicillin-clavulanic acid; overexpression of blaTEM-1 in E. coli confers amoxicillin-clavulanic acid resistance (34). Alternatively, changes in permeability or efflux could lower the intracellular concentration of either the drug or the inhibitor, conferring intermediate or decreased susceptibility.
As found in previous studies, resistance to macrolides and quinolones in these C. coli and C. jejuni (12) isolates is largely due to point mutations. When we screened for point mutations in gyrA and 23S, we were able to predict phenotypes with extremely high accuracy. This highlights the importance of point mutations in determining resistance phenotypes. Future editions of AMRFinder will incorporate point mutation information for Campylobacter spp., E. coli, and S. enterica.
Comparing AMRFinder to ResFinder revealed the importance of annotation and of a comprehensive AMR reference gene database. Protein length variation, when working with AMR proteins, can yield false conclusions. For any AMR gene detection system, incomplete or incorrect databases can lead to AMR gene identification errors.
We also found that there were instances where the highest-scoring ResFinder hit was either incorrect due to absence of a sequence specific enough to make the correct call or to a reference nucleotide sequence that was divergent from the correct sequence. One case was the aac(6′) family aminoglycoside-modifying enzyme. Slight nucleotide changes that result in protein differences can result in the gain or loss of fluoroquinolone and aminoglycoside resistance (35). When we reran the isolate assemblies with conflicting results using ResFinder 3.1 (download date, 13 April 2019), we found mixed results. For the 30 aac(6′)-Ib4 full-length alleles, we found that ResFinder misidentified these alleles as aac(6′)-Ib3, as aac(6′)-Ib4 was not included in the ResFinder database; a one-amino-acid difference represented by a single nucleotide between aac(6′)-Ib3 and aac(6′)-Ib4 changes the phenotype from amikacin, kanamycin, and tobramycin resistance to gentamicin resistance (36). This finding highlights the importance of database completeness. We also observed miscalls of QnrB alleles (quinolone resistance) and OXA-61 family beta-lactamases due to the closest nucleotide hit not corresponding to the correct protein hit. Using a newer version of ResFinder as described above, 181/647 disagreements resolved, as the correct allele was included in the ResFinder database; however, 466/647 disagreements could not be resolved, as multiple alleles were returned, including the correct allele, that could not be distinguished from the correct allele by ResFinder output of nucleotide identity or coverage. AMRFinder, by having a nested hierarchical classification of AMR proteins into families, is able to appropriately name novel AMR genes, which can avoid imputing incorrect function by overspecifying the gene name. Without a clear interpretation of what similarity, but not complete identity, to known AMR genes means, using a “highest scoring hit” approach can lead to false conclusions regarding AMR gene content.
Although allele miscalls might appear to be minor, and in many cases do not affect susceptibility patterns, there are cases where these differences have profound effects on the predicted resistance phenotype. As mentioned above, very minor differences in aminoglycoside-modifying enzymes can result in significant differences in susceptibility. Recent work with KPC family beta-lactamases has revealed that a subset of alleles, including blaKPC-8, confer resistance not only to carbapenemases, but also to ceftazidime-tazobactam (36). blaKPC-8 was first described in 2008 before ceftazidime-tazobactam existed as a treatment option. In some circumstances, accurate identification down to the allele level is crucial to characterizing the relationship between resistance genotype and phenotype. Comparisons in this study used older versions of both the AMRFinder and ResFinder databases out of necessity, as both systems are continuously improving their databases. Since we locked down the databases for both systems, as of 1 September 2018, the ResFinder database has grown from 2,254 nucleotide sequences to 3,307 (a 35% increase), and the AMRFinder database has increased by 17%, from 3,921 protein sequences to 4,579. These improvements may increase the accuracy of both systems.
We also note that the CARD system has recently been released as a software tool (24). We encourage the development and release of new tools and encourage additional comparisons among various AMR gene detection systems and databases.
Note that reliability of WGS-based methods is dependent on the accuracy of the underlying WGS data. This problem has been addressed previously for methods that directly search sequencing reads to find AMR genes (37) but not for assembly-based approaches. Low-level contamination or poor-quality sequence data can lead to inaccurate assessments; this is a particular problem with “greedy” assemblers that will assemble very low-coverage regions. Consensus assemblers run the risk that nearly identical orthologous genes or low-level sequence contamination might yield an incorrect sequence. Low-quality assemblies can also result in partial genes, making assessment of resistance genes challenging. To increase the accuracy and reliability of AMR gene identification, NCBI has developed an assembler that emphasizes base accuracy, increasing the reliability of allele identification (38).
In analyzing these data, we also encountered several issues. There are two competing, partially overlapping aminoglycoside-modifying enzyme nomenclature systems. This makes constructing reference gene databases, as well as validating these databases and their associated tools, extremely difficult. We also discovered that, in developing the genotype-phenotype matrix, there are many alleles and genes that have either not been characterized phenotypically at all or have only been characterized against a subset of antibiotics. This was a particular problem with the beta-lactamases, where in some cases alleles were characterized phenotypically before the advent of currently used drugs. In addition, some genes are described very broadly. Terms such as “cephalosporin-hydrolyzing” or “aminoglycoside-modifying” do not aid accurate prediction. While these terms can be useful when confronted with a novel allele or gene, in that they avoid making unwarranted statements about phenotype, we would encourage more phenotypic assessment of novel and existing genes using well-standardized methods and quality control, such as the CLSI or EUCAST standards, to guide WGS-based methods and increase our basic understanding of AMR. It would also help to have more phenotypic data publicly available and linked to existing genome sequences (https://www.ncbi.nlm.nih.gov/biosample/docs/antibiogram/).
In AMRFinder, we have adopted a protein-focused approach, as opposed to a nucleotide-oriented approach, for several reasons. First, protein annotation and similarity comparisons against both reference proteins and using HMMs with appropriate cutoffs can aid in determining if the gene is in frame and of correct length, whereas a nucleotide approach can miss nonsense mutations. Second, the protein sequence encodes the AMR function. Even single-amino-acid changes can significantly alter resistance phenotypes, and this variation should be explicitly captured. Third, there can be discordance between nucleotide and protein sequences, leading to the misassignment of alleles and thus potentially to incorrect prediction of AMR phenotypes. Note, however, that there can be upstream mutations or chromosomal versus plasmid location effects that interfere with gene expression, and that these types of mutations are not being reported by AMRFinder. For example, blaKPC alleles in the context of different Tn4401 variants are expressed at different levels (39, 40). Even when we used both nucleotide and protein approaches and removed isolates that had genotype-phenotype discrepancies among three or more drug classes, we still observed that 17% of isolates had one or more discrepancies between the resistance genotype and the observed antibiogram. In spite of the high consistency for tests against single antibiotics, isolates tested on multiple drugs will likely have one or more discrepancies as a simple statistical property. For example, assuming a consistency rate of 98% for each antibiotic, 21% of isolates tested against 12 antibiotics with a consistency of 98% would have one or more errors. Further technical refinements will be needed to lower the per-isolate discrepancy, if clinical prediction is a primary goal.
The tool we have described, AMRFinder, uses a combined protein BLAST and HMM approach. BLAST can identify complete or near matches to known genes. HMMs based on curated data, on the other hand, can identify putative resistance genes that fall below arbitrary BLAST thresholds, enabling the recognition of novel resistance genes. By integrating both of these methods, we are able to assign the most specific functional name possible to the AMR protein (41).
Users of AMRFinder should note that its mission is to identify encoded proteins that have the capacity to contribute to antimicrobial resistance. The actual resistance phenotype conferred by the proteins AMRFinder detects for any one isolate can and will depend on additional factors, expression levels for those proteins, and contributing factors outside AMRFinder’s current coverage, such as porin mutations or overexpression of efflux transporters. While we demonstrated high consistency between genotype and phenotype for a collection of four foodborne pathogens, this might not occur in other species. For those other species, AMRFinder reports a comprehensive roster of relevant acquired or intrinsic antimicrobial resistance proteins detected, properly identified and given informative names, but the report should not be expected to assert that the effects of those proteins found will be a clinical resistance phenotype.
While AMRFinder is a powerful tool for identifying acquired resistance genes, our Campylobacter results highlight the importance of assessing the role of point mutations; a version of AMRFinder that is currently under development will incorporate point mutations that confer resistance found in the three species described in this study. To better understand the context in which AMR genes occur, NCBI is also developing a biocide and metal resistance database to screen for genes linked to resistance to those compounds. The latest AMRFinder software, source code, and databases are publicly available at https://www.ncbi.nlm.nih.gov/pathogens/antimicrobial-resistance/AMRFinder/. While this study only examined a limited set of foodborne pathogens, NCBI’s Pathogen Detection system facilitates the analysis of foodborne and clinical isolates to aid outbreak and traceback investigations and uses AMRFinder to identify AMR genes from over 200,000 clinical and environmental bacterial isolates (https://www.ncbi.nlm.nih.gov/pathogens/), enabling the rapid identification of isolates with important AMR-related genotypes.
MATERIALS AND METHODS
AMR gene database.
The Bacterial Antimicrobial Resistance Reference Gene Database is derived from multiple sources, including the compilation of beta-lactamase alleles and Qnr family quinolone resistance protein alleles compiled by the Lahey Clinic team (http://www.lahey.org/studies/ [42]), ResFinder (23), and the Comprehensive Antimicrobial Resistance Database (CARD [25]). At the request of the Lahey Clinic team of Karen Bush, George Jacoby, and Timothy Palzkill (https://www.lahey.org/Studies/), NCBI has assumed responsibility for assigning and curating beta-lactamase alleles. Since January 2016, NCBI has assigned 676 new beta-lactamase alleles, which are included in our collection of AMR proteins. We obtained compilations of resistance genes for several classes of ribosome-targeting antibiotics from Marilyn Roberts (personal communication) (43). We obtained collections of AMR proteins encoded in integron regions from both the Repository of Antibiotic resistance Cassettes (RAC) (44) and the INTEGRALL database (45). Additional sources included compilations provided by collaborating groups such as the FDA Center for Veterinary Medicine, University of Oxford (Derrick Crook), and the Klebsiella Sequence Typing Database at the Pasteur Institute (http://bigsdb.pasteur.fr/klebsiella/klebsiella.html). These sources were supplemented by continuous examination of review articles and new reports of resistance proteins.
The Reference Gene Database contains a hierarchy of AMR protein families, and sequences are stored in NCBI’s RefSeq database (22). Each protein, and each protein family, has a curated name and gene symbol. Gene symbols can point to more than one protein sequence, while alleles point to one unique amino acid sequence. Multiple distinct alleles within an AMR protein family may share the same gene symbol, but each allele designation represents exactly one unique protein translation. The proteins are arranged in protein family hierarchies based on protein homology (all families of class A beta-lactamase belong to a family called “class A beta-lactamase”), and on function (all classes of beta-lactamase belong to a family called “beta-lactamase,” even though one class may lack homology to the others). For each protein family, we inspected a multiple sequence alignment of all proteins from the family, often with additional homologs added to help establish the correct start site. From the multiple sequence alignment, and following inspection as needed, we assessed which collected proteins carried frameshifts, truncations or extensions from bad start site selection, or other sequence defects. At this stage, we also reviewed the breadth of the family, and identified any outliers whose inclusion might have resulted from a questionable prior placement. Typically, this review of a protein family occurred as placement in the hierarchy was finalized and as a protein profile hidden Markov model (HMM) was constructed (see below), with customized cutoff scores, to serve as the classifier that detects members of that protein family.
The 4,579 resistance proteins in our database as of this writing confer resistance to 34 classes of antimicrobials and disinfectants and are encoded by over 800 gene families. All underlying nucleotide records contain complete coding sequence and are not derived from synthetic constructs. Nucleotide sequences were oriented with the AMR protein coding region on the positive strand, and records were constructed, where possible, to include an additional 100 bp on either side of the coding region to assist in the design of primers. Protein records were created as described previously (22). This collection has a standardized nomenclature to provide maximal functional information as well as ease of bioinformatic use, and it is found under in our Reference Gene Browser (https://www.ncbi.nlm.nih.gov/pathogens/isolates#/refgene/) as well as in RefSeq BioProject PRJNA313047.
AMR HMM construction.
The ResFams (21) library of HMMs, based on sequences taken from CARD sequences and clustered by their CARD antibiotic resistance ontology assignments, provided important early assistance in recognizing putative AMR proteins and resolving them into discrete families. However, to create a hierarchical classification system for AMR proteins with sufficiently fine divisions of recognized families and cutoff values able to distinguish AMR from non-AMR proteins while searching very large data sets, we created, calibrated, and annotated an entirely new HMM library, available at https://ftp.ncbi.nlm.nih.gov/hmm/NCBIfam-AMRFinder/.
Groups of related AMR proteins with similar sequences and similar gene symbols as taken from our various sources were aligned using MUSCLE (46) or Clustal W (47), then viewed, trimmed, and culled of misassigned, redundant, frameshifted, or fragmentary sequences using Belvu (48). The resulting curated multiple sequence “seed” alignments were used to construct protein profile HMMs using the HMMER3 package (http://hmmer.org/) because the improved sensitivity and selectivity of HMMs built from more inclusive seed alignments can separate more clearly true family members from outgroup sequences. In some cases, BLAST or HMM searches recruited additional sequences that were judged valid to add to the seed alignments so that the scores obtained in HMM search results could more clearly separate true family members from outgroup sequences. During HMM construction, the literature was reviewed, molecular phylogenetic trees and search results were examined, and an informative protein name was selected for each HMM built to represent a family of AMR proteins. Cutoffs were set individually for each HMM through a manual process that involved confirmation of the supporting literature, benchmarking against other AMR proteins from related families, and the background of millions of additional proteins included in NCBI’s nonredundant protein sequence database. For the minority of multigene resistance systems in which the two or more components are required and are expected to cooccur, such as vancomycin resistance, the list of member proteins found by the HMM for each component provided guidance for adjusting the cutoffs for HMMs for the remaining components. Once built, each HMM that became a part of AMRFinder received ongoing scrutiny for its fidelity in confirming placements of AMR proteins in our hierarchy, performing correctly against large tests built for the purpose, and assessing AMR gene lists of thousands of genomes. NCBI’s RefSeq and Prokaryotic Gene Annotation Pipeline (PGAP) now use these HMMs to perform consistent functional annotation of AMR proteins during automatic annotation of bacterial genomes (22). Ongoing community feedback to the NCBI helpdesk (pd-help@ncbi.nlm.nih.gov) in response to PGAP and RefSeq annotation of AMR proteins occurs, and is encouraged, and this will provide continual additional review of the AMRFinder HMM collection.
Identifying acquired AMR genes.
(i) Protein searches. AMRFinder-prot uses the database of AMR gene sequences, HMMs, the hierarchical tree of AMR protein designations, and a custom rule set to generate names and coordinates for AMR genes along with descriptions of the evidence used to identify the sequence. Software and documentation are available at https://github.com/ncbi/amr and https://www.ncbi.nlm.nih.gov/pathogens/antimicrobial-resistance/AMRFinder/. Genes are reported with the following procedure after both HMMER and BLASTP searches are run (Fig. 5).
FIG 5.

Schematic representation of the AMRFinder algorithm for (a) searching protein sequences and (b) searching nucleotide sequences.
(ii) BLASTP matches. In AMRFinder, BLASTP (49, 50) is run with the options “-task blastp-fast -word_size 6 -threshold 21 -evalue 1e-20 -comp_based_stats 0” against the AMR gene database described above. Exact BLAST matches over the full length of the reference protein are reported. If there is no exact match, then the following rules are applied. Matches with <90% identity or with <50% coverage of the protein are dropped. If the hit is to a fusion protein then at least 90% of the protein must be covered. A BLAST match to a reference protein is removed if it is covered by another BLAST match which has more identical residues or the same number of identical residues, but to a longer reference protein. A single match is chosen as the best of what remains sorting by the following criteria, in order: (i) if it is exact; (ii) has more identical residues; (ii) hits a shorter protein; or (iv) the gene symbol comes first in alphabetical order.
(iii) HMM matches. HMMER version 3.1b2 (http://hmmer.org/) is run using the options “-cut_tc -Z 10000” with the HMM database described above. HMM matches with a full_score of <TC1 or a domain_score of <TC2 are dropped. All HMM matches to HMMs for parent nodes of other HMM matches in the hierarchy are removed. The match(es) with the highest full score are kept. If there is an exact BLAST match or the family of the BLAST match reference protein is a descendant of the family of the HMM then the information for the nearest HMM node to the BLAST match are returned.
(iv) Translated DNA searches. Translated alignments using BLASTX of the assembly against the AMR protein database were used to help identify partial, split, or unannotated AMR proteins using the options “-task tblastn-fast -word_size 3 -evalue 1e-20 -seg no -comp_based_stats 0.” The algorithm for selecting hits is as described above for proteins, but note that HMM searches are not performed against the unannotated assembly.
(v) Nucleotide searches. Nucleotide-nucleotide BLAST searches were also performed for evaluation purposes, although this is not built into AMRFinder. We collected the nucleotide sequences for all proteins in GenBank with sequences identical to those in the AMR database. The genome assembly for each isolate was masked at locations identified as AMR genes by AMRFinder before aligning the remainder against the nucleotide sequences we collected above. Hits were combined to determine coverage of the reference protein, and all 7 hits with more than 50% length and more than 90% sequence similarity to a reference sequence were selected for analysis.
(vi) Reporting possibly nonfunctional protein sequences. No purely bioinformatic method can perfectly differentiate between functional and nonfunctional sequences. In the interests of sensitivity and possible epidemiological utility, AMRFinder may report hits that might be functional, but for each reported hit, AMRFinder provides sufficient information to assess the functionality of the protein. This information includes the percent identity of the matching sequence, the proportion of the reference sequence that is covered by the match, the actual hit length, the reference protein length, and the HMM matched when an HMM hit is found. Because frameshift or nonsense mutations may cause a misleadingly high identity sequence to be detected by translated blast, AMRFinder appends “[stop]” to the protein name for sequences where an early stop codon was detected.
Samples.
The 6,242 isolates used in this study are from various NARMS projects (51) and include 294 Campylobacter coli, 476 Campylobacter jejuni, 47 Escherichia coli, and 5,425 Salmonella enterica isolates. Sources for these isolates include human clinical S. enterica isolates from 2014 that were resistant to at least one antibiotic, NARMS food animal cecal testing projects, food adulterant isolates that include Shiga-toxin producing E. coli, and routine NARMS retail meat surveillance.
There were a small number of isolates whose excessive differences between MIC tests and predictions of resistance suggested artifacts from resistance gene loss, sample swaps, testing errors, mixed cultures, or other confounding factors. We eliminated isolates where resistance calls differed from the gene-based prediction for all tested members of three or more drug classes defined as aminoglycosides, beta-lactams, lincosamides, ketolides, macrolides, phenicols, quinolones, sulfonamides, tetracyclines, and trimethoprim-sulfamethoxazole. This filter removed 38 isolates from the analyses (0.6%, Fig. 1).
Genome assembly and annotation.
Illumina whole-genome shotgun reads were assembled using SPAdes v.3.5.0 using the default parameters (52). To be included in the study we required the isolate assemblies constructed for this study to meet the following criteria: (i) one and only one species-appropriate, full-length, gyrA gene; (ii) <100 kb of the assembly in contigs covered by <10% of the genome-wide average coverage; (iii) <8 Mb in size; (iv) sufficient sequence for >20-fold genome coverage; and (v) NCBI species average nucleotide identity (ANI) matched (Fig. 1; see also reference 53). To calculate coverage, reads for each isolate were aligned back to the assembly with Burrows-Wheeler Aligner (BWA) version 0.7.10-r789 using the MEM algorithm and default parameters (54). SAMtools version 1.3.1 was then used to convert alignments to read depths for each base (55). Genomes were annotated using NCBI’s PGAP version 2.0 pipeline (22, 56). For 540 isolates, we used genome assemblies already deposited in GenBank that met the quality thresholds for the SPAdes assemblies (Table S1).
Contig filtering.
Using the genome-wide and per-contig average read depth data calculated as described above, AMR genes identified were filtered and removed from analysis if the read depth of the contig containing a given AMR gene was <1/10 of the average per-base read depth for the entire assembly.
Combining results.
First, redundant equal-scoring hits to the same protein or identical location on the assembly were removed. To remove redundant detection of the same protein between translated and protein searches, translated AMRFinder hits that overlapped over more than 75% of their length with protein AMRFinder hits were removed as duplicates; we observed that a wide range of cutoffs yielded the same result (data not shown). Finally, nucleotide BLAST hits that overlapped over more than 75% of their length with either AMRFinder-prot or translated BLAST hits were removed as duplicates. A total of 14,984 (98.19%) AMR genes were identified by the annotation-based protein AMRFinder, while 268 (1.77%) were identified by translated DNA BLAST. The remaining 7 hits (0.046%) were partial proteins identified only by nucleotide BLAST.
Identifying point mutations.
Point mutations in three structural genes that confer resistance in C. coli and C. jejuni, namely, gyrA, 50S ribosomal protein L22, and 23S rRNA, were examined (12). We identified putative resistance mutations by blasting the protein or nucleotide sequences against the listed accessions and predicted resistance based on the presence of the listed known resistance alleles at any of the listed offsets. The gene gyrA was screened (GenBank accession numbers AJW58405.1 and YP_002344422.1) for the mutations T86I, T86K, T86V, D90N, D90Y, P104S, and C257T, which predict resistance to quinolones. For the 50S ribosomal protein L22 (GenBank accession numbers AJW59082.1 and YP_002345068.1), we predicted resistance to macrolides due to changes at positions A84D, G86E, G86V, A88E, and A103V. The 23S rRNA (GenBank accession number CP011015.1) was screened for those C. jejuni 23S mutations, A2074C, A2074G, A2074T, A2075G, and C2627A, which were expected to confer resistance to macrolides as defined either by CLSI or NARMS breakpoints in Table S2 (57–59). To assess if ciprofloxacin resistance in S. enterica could be attributed to point mutations, we screened gyrA (GenBank accession number WP_001281271.1; A67P, D72G, V73I, G81C/S/H/D, D82G/N, S83Y/F/A, D87N/G/Y/K, S97P, L98V, A119S/E/V, A131G, and E139A), gyrB (accession number WP_000072047.1; Y421C, R438L, S464Y/F, and E466D), parC (accession number WP_001281910.1; T66I, G78D, S80R/I, and E84K/G), and parE (accession number WP_000195318.1; M438I, E454G, S458P, V461G, H462Y, A499T, V514G, and V521F) for mutations expected to confer resistance (60–63).
Correlation of antimicrobial susceptibility phenotypes with resistance gene content.
After all resistance genes were identified, isolates exhibiting phenotypic resistance were correlated with the predicted phenotype based on presence or absence of resistance genes or point mutations for each antibiotic (see Table S4 for predictions). Predicted phenotypes were scored as either resistant (R) or susceptible (S), with the presence of one or more resistance-conferring genes yielding a prediction of R. These were compared to the gold-standard observed phenotypic results, with observed susceptibility results of intermediate (I) treated as S, with the exception of ciprofloxacin in S. enterica, for which I values were treated as resistant, since previous work has indicated that one or more resistance genes or point mutations are associated with an intermediate susceptibility phenotype (64, 65).
AMRFinder-ResFinder comparisons.
AMRFinder uses BLAST to search protein sequences derived from resistance genes, either against a set of annotated proteins or a nucleotide sequence, while ResFinder uses a nucleotide database, and uses BLAST to search that database against a nucleotide sequence (e.g., a bacterial genome). In addition, ResFinder reports the “highest-scoring” hit, even if the underlying sequence does not support such a precise claim (e.g., calling a novel OXA allele “OXA-61”), while the hierarchical gene structure of AMRFinder will attempt to identify an appropriate gene name that does not provide an incorrect or overly precise name. To compare the output of AMRFinder to that of ResFinder, we first determined if these two methods called AMR genes at nearly identical coordinates on the same genome (the absolute difference in lengths could be no more than 40 bp). We used ResFinder 2.0 installed locally and run on the same assemblies analyzed with AMRFinder, with the database downloaded on 15 November 2017, and compared it with AMRFinder with the database locked on 2 February 2017. For ResFinder, the default settings of 90% nucleotide similarity and a 60% minimum length were used. The particular version of the AMRFinder gene database used in this study can be found at ftp://ftp.ncbi.nlm.nih.gov/pathogen/Technical/AMRFinder_technical/feldgard_et_al_2018_amrdb.tar.gz. AMRFinder parameters used include a 90% nucleotide similarity and 50% minimum length for matching, and 40 disinfectant, bleomycin, and streptothricin resistance genes were included in AMRFinder that were not in ResFinder 2.0. This allowed us to identify instances when the same gene occurred multiple times in a genome in instances where one copy was missed or misidentified by either method. We then compared gene symbols produced by each method. Where gene symbols did not agree, we assigned them to one of four categories, as follows. (i) synonyms were cases where the identical protein was called by both methods, but the name differed [e.g., many aminoglycoside-modifying enzymes, such as strA and aph(3″)-Ib]. (ii) Underspecified calls occurred when the protein was 100% identical to a known, named protein, but one method did not describe it with sufficient resolution (e.g., blaTEM-1 was miscalled as blaTEM). (iii) Overspecified calls were cases where the correct name was a less specific gene symbol, when the method provided an overspecified symbol (e.g., a novel blaTEM family allele was miscalled as blaTEM-1). (iv) Incorrect calls occurred when an incorrect gene symbol was ascribed to a protein (e.g., blaOXA-193 was miscalled as blaOXA-61).
Antimicrobial susceptibility testing.
MICs were measured using the Sensititre system and susceptibility panels designed specifically for NARMS surveillance (66). E. coli and S. enterica isolates were tested for susceptibility to amoxicillin-clavulanic acid, ampicillin, azithromycin, cefoxitin, ceftriaxone, chloramphenicol, ciprofloxacin, trimethoprim-sulfamethoxazole, gentamicin, nalidixic acid, streptomycin, sulfisoxazole, and tetracycline; some Salmonella isolates were screened against amikacin, ceftiofur, kanamycin, and meropenem, depending on the composition of the NARMS panel at the time of testing. Campylobacter spp. were screened for susceptibility to azithromycin, ciprofloxacin, clindamycin, erythromycin, florfenicol, gentamicin, nalidixic acid, telithromycin, and tetracycline.
The breakpoints used for susceptibility testing were CLSI breakpoints. For antibiotics that lack CLSI breakpoints, breakpoints established by the NARMS Working Group were used (Tables S2 and S3).
Data availability.
Isolates described here are listed in Table S1 and are deposited in the Sequence Read Archive or were independently assembled and submitted to GenBank prior to the start of the analysis.
Supplementary Material
ACKNOWLEDGMENT
This work was supported by the Intramural Research Program of the National Institutes of Health, National Library of Medicine.
The views expressed in this article are those of the authors and do not necessarily reflect the official policy of the Department of Health and Human Services, the U.S. Food and Drug Administration, the Centers for Disease Control and Prevention, or the U.S. Government. Mention of trade names or commercial products in this publication is solely for the purpose of providing specific information and does not imply recommendation or endorsement by the Food and Drug Administration.
Footnotes
Supplemental material for this article may be found at https://doi.org/10.1128/AAC.00483-19.
REFERENCES
- 1.The White House. 2015. National action plan for combatting antibiotic-resistant bacteria. The White House, Washington, DC: https://www.cdc.gov/drugresistance/pdf/national_action_plan_for_combating_antibotic-resistant_bacteria.pdf. [Google Scholar]
- 2.Clinical and Laboratory Standards Institute. 2018. Performance standards for antimicrobial susceptibility testing, 28th ed. CLSI supplement M100 Clinical and Laboratory Standards Institute, Wayne, PA. [Google Scholar]
- 3.Nijhuis RH, van Maarseveen NM, van Hannen EJ, van Zwet AA, Mascini EM. 2014. A rapid and high-throughput screening approach for methicillin-resistant Staphylococcus aureus based on the combination of two different real-time PCR assays. J Clin Microbiol 52:2861–2867. doi: 10.1128/JCM.00808-14. [DOI] [PMC free article] [PubMed] [Google Scholar]
- 4.Becker K, Denis O, Roisin S, Mellmann A, Idelevich EA, Knaack D, van Alen S, Kriegeskorte A, Kock R, Schaumburg F, Peters G, Ballhausen B. 2016. Detection of mecA- and mecC-positive methicillin-resistant Staphylococcus aureus (MRSA) isolates by the new Xpert MRSA Gen 3 PCR assay. J Clin Microbiol 54:180–184. doi: 10.1128/JCM.02081-15. [DOI] [PMC free article] [PubMed] [Google Scholar]
- 5.Sparbier K, Schubert S, Weller U, Boogen C, Kostrzewa M. 2012. Matrix-assisted laser desorption ionization–time of flight mass spectrometry-based functional assay for rapid detection of resistance against beta-lactam antibiotics. J Clin Microbiol 50:927–937. doi: 10.1128/JCM.05737-11. [DOI] [PMC free article] [PubMed] [Google Scholar]
- 6.Jung JS, Popp C, Sparbier K, Lange C, Kostrzewa M, Schubert S. 2014. Evaluation of matrix-assisted laser desorption ionization-time of flight mass spectrometry for rapid detection of beta-lactam resistance in Enterobacteriaceae derived from blood cultures. J Clin Microbiol 52:924–930. doi: 10.1128/JCM.02691-13. [DOI] [PMC free article] [PubMed] [Google Scholar]
- 7.Oviano M, Fernandez B, Fernandez A, Barba MJ, Mourino C, Bou G. 2014. Rapid detection of enterobacteriaceae producing extended spectrum beta-lactamases directly from positive blood cultures by matrix-assisted laser desorption ionization-time of flight mass spectrometry. Clin Microbiol Infect 20:1146–1157. doi: 10.1111/1469-0691.12729. [DOI] [PubMed] [Google Scholar]
- 8.Jung JS, Hamacher C, Gross B, Sparbier K, Lange C, Kostrzewa M, Schubert S. 2016. Evaluation of a semiquantitative matrix-assisted laser desorption ionization–time of flight mass spectrometry method for rapid antimicrobial susceptibility testing of positive blood cultures. J Clin Microbiol 54:2820–2824. doi: 10.1128/JCM.01131-16. [DOI] [PMC free article] [PubMed] [Google Scholar]
- 9.Allard MW, Bell R, Ferreira CM, Gonzalez-Escalona N, Hoffmann M, Muruvanda T, Ottesen A, Ramachandran P, Reed E, Sharma S, Stevens E, Timme R, Zheng J, Brown EW. 2018. Genomics of foodborne pathogens for microbial food safety. Curr Opin Biotechnol 49:224–229. doi: 10.1016/j.copbio.2017.11.002. [DOI] [PubMed] [Google Scholar]
- 10.Dallman TJ, Chattaway MA, Mook P, Godbole G, Crook PD, Jenkins C. 2016. Use of whole-genome sequencing for the public health surveillance of Shigella sonnei in England and Wales, 2015. J Med Microbiol 65:882–884. doi: 10.1099/jmm.0.000296. [DOI] [PubMed] [Google Scholar]
- 11.Moran RA, Anantham S, Holt KE, Hall RM. 2017. Prediction of antibiotic resistance from antibiotic resistance genes detected in antibiotic-resistant commensal Escherichia coli using PCR or WGS. J Antimicrob Chemother 72:700–704. doi: 10.1093/jac/dkw511. [DOI] [PubMed] [Google Scholar]
- 12.Zhao S, Tyson GH, Chen Y, Li C, Mukherjee S, Young S, Lam C, Folster JP, Whichard JM, McDermott PF. 2016. Whole-genome sequencing analysis accurately predicts antimicrobial resistance phenotypes in Campylobacter spp. Appl Environ Microbiol 82:459–466. doi: 10.1128/AEM.02873-15. [DOI] [PMC free article] [PubMed] [Google Scholar]
- 13.Day MR, Doumith M, Do Nascimento V, Nair S, Ashton PM, Jenkins C, Dallman TJ, Stevens FJ, Freedman J, Hopkins KL, Woodford N, De Pinna EM, Godbole G. 2018. Comparison of phenotypic and WGS-derived antimicrobial resistance profiles of Salmonella enterica serovars Typhi and Paratyphi. J Antimicrob Chemother 73:365–372. doi: 10.1093/jac/dkx379. [DOI] [PubMed] [Google Scholar]
- 14.Lemon JK, Khil PP, Frank KM, Dekker JP. 2017. Rapid nanopore sequencing of plasmids and resistance gene detection in clinical isolates. J Clin Microbiol 55:3530–3543. doi: 10.1128/JCM.01069-17. [DOI] [PMC free article] [PubMed] [Google Scholar]
- 15.Do Nascimento V, Day MR, Doumith M, Hopkins KL, Woodford N, Godbole G, Jenkins C. 2017. Comparison of phenotypic and WGS-derived antimicrobial resistance profiles of enteroaggregative Escherichia coli isolated from cases of diarrhoeal disease in England, 2015–16. J Antimicrob Chemother 72:3288–3297. doi: 10.1093/jac/dkx301. [DOI] [PubMed] [Google Scholar]
- 16.Mellmann A, Bletz S, Boking T, Kipp F, Becker K, Schultes A, Prior K, Harmsen D. 2016. Real-time genome sequencing of resistant bacteria provides precision infection control in an institutional setting. J Clin Microbiol 54:2874–2881. doi: 10.1128/JCM.00790-16. [DOI] [PMC free article] [PubMed] [Google Scholar]
- 17.Tyson GH, McDermott PF, Li C, Chen Y, Tadesse DA, Mukherjee S, Bodeis-Jones S, Kabera C, Gaines SA, Loneragan GH, Edrington TS, Torrence M, Harhay DM, Zhao S. 2015. WGS accurately predicts antimicrobial resistance in Escherichia coli. J Antimicrob Chemother 70:2763–2769. doi: 10.1093/jac/dkv186. [DOI] [PMC free article] [PubMed] [Google Scholar]
- 18.Lesho EP, Clifford RJ. 2016. For rapid molecular detection, why not a whole genome approach? Clin Infect Dis 63:570–571. doi: 10.1093/cid/ciw332. [DOI] [PubMed] [Google Scholar]
- 19.Xavier BB, Das AJ, Cochrane G, De Ganck S, Kumar-Singh S, Aarestrup FM, Goossens H, Malhotra-Kumar S. 2016. Consolidating and exploring antibiotic resistance gene data resources. J Clin Microbiol 54:851–859. doi: 10.1128/JCM.02717-15. [DOI] [PMC free article] [PubMed] [Google Scholar]
- 20.Gupta SK, Padmanabhan BR, Diene SM, Lopez-Rojas R, Kempf M, Landraud L, Rolain JM. 2014. ARG-ANNOT, a new bioinformatic tool to discover antibiotic resistance genes in bacterial genomes. Antimicrob Agents Chemother 58:212–220. doi: 10.1128/AAC.01310-13. [DOI] [PMC free article] [PubMed] [Google Scholar]
- 21.Gibson MK, Forsberg KJ, Dantas G. 2015. Improved annotation of antibiotic resistance determinants reveals microbial resistomes cluster by ecology. ISME J 9:207–216. doi: 10.1038/ismej.2014.106. [DOI] [PMC free article] [PubMed] [Google Scholar]
- 22.Haft DH, DiCuccio M, Badretdin A, Brover V, Chetvernin V, O’Neill K, Li W, Chitsaz F, Derbyshire MK, Gonzales NR, Gwadz M, Lu F, Marchler GH, Song JS, Thanki N, Yamashita RA, Zheng C, Thibaud-Nissen F, Geer LY, Marchler-Bauer A, Pruitt KD. 2018. RefSeq: an update on prokaryotic genome annotation and curation. Nucleic Acids Res 46:D851–D860. doi: 10.1093/nar/gkx1068. [DOI] [PMC free article] [PubMed] [Google Scholar]
- 23.Zankari E, Hasman H, Cosentino S, Vestergaard M, Rasmussen S, Lund O, Aarestrup FM, Larsen MV. 2012. Identification of acquired antimicrobial resistance genes. J Antimicrob Chemother 67:2640–2644. doi: 10.1093/jac/dks261. [DOI] [PMC free article] [PubMed] [Google Scholar]
- 24.McArthur AG, Waglechner N, Nizam F, Yan A, Azad MA, Baylay AJ, Bhullar K, Canova MJ, De Pascale G, Ejim L, Kalan L, King AM, Koteva K, Morar M, Mulvey MR, O'Brien JS, Pawlowski AC, Piddock LJV, Spanogiannopoulos P, Sutherland AD, Tang I, Taylor PL, Thaker M, Wang W, Yan M, Yu T, Wright GD. 2013. The Comprehensive Antibiotic Resistance Database. Antimicrob Agents Chemother 57:3348–3357. doi: 10.1128/AAC.00419-13. [DOI] [PMC free article] [PubMed] [Google Scholar]
- 25.Jia B, Raphenya AR, Alcock B, Waglechner N, Guo P, Tsang KK, Lago BA, Dave BM, Pereira S, Sharma AN, Doshi S, Courtot M, Lo R, Williams LE, Frye JG, Elsayegh T, Sardar D, Westman EL, Pawlowski AC, Johnson TA, Brinkman FS, Wright GD, McArthur AG. 2017. CARD 2017: expansion and model-centric curation of the comprehensive antibiotic resistance database. Nucleic Acids Res 45:D566–D573. doi: 10.1093/nar/gkw1004. [DOI] [PMC free article] [PubMed] [Google Scholar]
- 26.Tyson GH, Zhao S, Li C, Ayers S, Sabo JL, Lam C, Miller RA, McDermott PF. 2017. Establishing genotypic cutoff values to measure antimicrobial resistance in Salmonella. Antimicrob Agents Chemother 61:e02140-16. doi: 10.1128/AAC.02140-16. [DOI] [PMC free article] [PubMed] [Google Scholar]
- 27.Gay K, Robicsek A, Strahilevitz J, Park CH, Jacoby G, Barrett TJ, Medalla F, Chiller TM, Hooper DC. 2006. Plasmid-mediated quinolone resistance in non-Typhi serotypes of Salmonella enterica. Clin Infect Dis 43:297–304. doi: 10.1086/505397. [DOI] [PubMed] [Google Scholar]
- 28.Tyson GH, Li C, Ayers S, McDermott PF, Zhao S. 2016. Using whole-genome sequencing to determine appropriate streptomycin epidemiological cutoffs for Salmonella and Escherichia coli. FEMS Microbiol Lett 363:fnw009. doi: 10.1093/femsle/fnw009. [DOI] [PMC free article] [PubMed] [Google Scholar]
- 29.Carroll LM, Wiedmann M, den Bakker H, Siler J, Warchocki S, Kent D, Lyalina S, Davis M, Sischo W, Besser T, Warnick LD, Pereira RV. 2017. Whole-genome sequencing of drug-resistant Salmonella enterica isolates from dairy cattle and humans in New York and Washington states reveals source and geographic associations. Appl Environ Microbiol 83:e00140-17. doi: 10.1128/AEM.00140-17. [DOI] [PMC free article] [PubMed] [Google Scholar]
- 30.Dortet L, Nordmann P, Poirel L. 2012. Association of the emerging carbapenemase NDM-1 with a bleomycin resistance protein in Enterobacteriaceae and Acinetobacter baumannii. Antimicrob Agents Chemother 56:1693–1697. doi: 10.1128/AAC.05583-11. [DOI] [PMC free article] [PubMed] [Google Scholar]
- 31.Ding Y, Zwe YH, Chin SF, Kohli GS, Drautz-Moses DI, Givskov M, Schlundt J, Schuster SC, Yuk HG, Yang L. 2018. Characterization of a novel multidrug resistance plasmid pSGB23 isolated from Salmonella enterica subspecies enterica serovar Saintpaul. Gut Pathog 10:20. doi: 10.1186/s13099-018-0249-6. [DOI] [PMC free article] [PubMed] [Google Scholar]
- 32.Allard MW, Strain E, Melka D, Bunning K, Musser SM, Brown EW, Timme R. 2016. Practical value of food pathogen traceability through building a whole-genome sequencing network and database. J Clin Microbiol 54:1975–1983. doi: 10.1128/JCM.00081-16. [DOI] [PMC free article] [PubMed] [Google Scholar]
- 33.Ribot EM, Hise KB. 2016. Future challenges for tracking foodborne diseases: PulseNet, a 20-year-old US surveillance system for foodborne diseases, is expanding both globally and technologically. EMBO Rep 17:1499–1505. doi: 10.15252/embr.201643128. [DOI] [PMC free article] [PubMed] [Google Scholar]
- 34.Di Conza JA, Badaracco A, Ayala J, Rodriguez C, Famiglietti A, Gutkind GO. 2014. beta-lactamases produced by amoxicillin-clavulanate-resistant enterobacteria isolated in Buenos Aires, Argentina. a New blaTEM Gene Rev Argent Microbiol 46:210–217. doi: 10.1016/S0325-7541(14)70075-6. [DOI] [PubMed] [Google Scholar]
- 35.Ramirez MS, Nikolaidis N, Tolmasky ME. 2013. Rise and dissemination of aminoglycoside resistance: the aac(6′)-Ib paradigm. Front Microbiol 4:121. doi: 10.3389/fmicb.2013.00121. [DOI] [PMC free article] [PubMed] [Google Scholar]
- 36.Shields RK, Chen L, Cheng S, Chavda KD, Press EG, Snyder A, Pandey R, Doi Y, Kreiswirth BN, Nguyen MH, Clancy CJ. 2017. Emergence of ceftazidime-avibactam resistance due to plasmid-borne blaKPC-3 mutations during treatment of carbapenem-resistant Klebsiella pneumoniae infections. Antimicrob Agents Chemother 61:e02097-16. doi: 10.1128/AAC.02097-16. [DOI] [PMC free article] [PubMed] [Google Scholar]
- 37.Clausen PT, Zankari E, Aarestrup FM, Lund O. 2016. Benchmarking of methods for identification of antimicrobial resistance genes in bacterial whole genome data. J Antimicrob Chemother 71:2484–2488. doi: 10.1093/jac/dkw184. [DOI] [PubMed] [Google Scholar]
- 38.Souvorov A, Agarwala R, Lipman DJ. 2018. SKESA: strategic k-mer extension for scrupulous assemblies. Genome Biol 19:153. doi: 10.1186/s13059-018-1540-z. [DOI] [PMC free article] [PubMed] [Google Scholar]
- 39.Naas T, Cuzon G, Truong HV, Nordmann P. 2012. Role of ISKpn7 and deletions in blaKPC gene expression. Antimicrob Agents Chemother 56:4753–4759. doi: 10.1128/AAC.00334-12. [DOI] [PMC free article] [PubMed] [Google Scholar]
- 40.Cheruvanky A, Stoesser N, Sheppard AE, Crook DW, Hoffman PS, Weddle E, Carroll J, Sifri CD, Chai W, Barry K, Ramakrishnan G, Mathers AJ. 2017. Enhanced Klebsiella pneumoniae carbapenemase expression from a novel Tn4401 deletion. Antimicrob Agents Chemother 61:e00025-17. doi: 10.1128/AAC.00025-17. [DOI] [PMC free article] [PubMed] [Google Scholar]
- 41.Rehman MA, Yin X, Persaud-Lachhman MG, Diarra MS. 2017. First detection of a fosfomycin resistance gene, fosA7, in Salmonella enterica serovar Heidelberg isolated from broiler chickens. Antimicrob Agents Chemother 61:e00410-17. doi: 10.1128/AAC.00410-17. [DOI] [PMC free article] [PubMed] [Google Scholar]
- 42.Bush K, Jacoby GA. 2010. Updated functional classification of beta-lactamases. Antimicrob Agents Chemother 54:969–976. doi: 10.1128/AAC.01009-09. [DOI] [PMC free article] [PubMed] [Google Scholar]
- 43.Chopra I, Roberts M. 2001. Tetracycline antibiotics: mode of action, applications, molecular biology, and epidemiology of bacterial resistance. Microbiol Mol Biol Rev 65:232–260. second page, table of contents. doi: 10.1128/MMBR.65.2.232-260.2001. [DOI] [PMC free article] [PubMed] [Google Scholar]
- 44.Tsafnat G, Copty J, Partridge SR. 2011. RAC: Repository of Antibiotic resistance Cassettes. Database (Oxford) 2011:bar054. doi: 10.1093/database/bar054. [DOI] [PMC free article] [PubMed] [Google Scholar]
- 45.Moura A, Soares M, Pereira C, Leitao N, Henriques I, Correia A. 2009. INTEGRALL: a database and search engine for integrons, integrases and gene cassettes. Bioinformatics 25:1096–1098. doi: 10.1093/bioinformatics/btp105. [DOI] [PubMed] [Google Scholar]
- 46.Edgar RC. 2004. MUSCLE: multiple sequence alignment with high accuracy and high throughput. Nucleic Acids Res 32:1792–1797. doi: 10.1093/nar/gkh340. [DOI] [PMC free article] [PubMed] [Google Scholar]
- 47.Larkin MA, Blackshields G, Brown NP, Chenna R, McGettigan PA, McWilliam H, Valentin F, Wallace IM, Wilm A, Lopez R, Thompson JD, Gibson TJ, Higgins DG. 2007. Clustal W and Clustal X version 2.0. Bioinformatics 23:2947–2948. doi: 10.1093/bioinformatics/btm404. [DOI] [PubMed] [Google Scholar]
- 48.Sonnhammer EL, Hollich V. 2005. Scoredist: a simple and robust protein sequence distance estimator. BMC Bioinformatics 6:108. doi: 10.1186/1471-2105-6-108. [DOI] [PMC free article] [PubMed] [Google Scholar]
- 49.Altschul SF, Gish W, Miller W, Myers EW, Lipman DJ. 1990. Basic local alignment search tool. J Mol Biol 215:403–410. doi: 10.1016/S0022-2836(05)80360-2. [DOI] [PubMed] [Google Scholar]
- 50.Camacho C, Coulouris G, Avagyan V, Ma N, Papadopoulos J, Bealer K, Madden TL. 2009. BLAST+: architecture and applications. BMC Bioinformatics 10:421. doi: 10.1186/1471-2105-10-421. [DOI] [PMC free article] [PubMed] [Google Scholar]
- 51.Karp BE, Tate H, Plumblee JR, Dessai U, Whichard JM, Thacker EL, Hale KR, Wilson W, Friedman CR, Griffin PM, McDermott PF. 2017. National Antimicrobial Resistance Monitoring System: two decades of advancing public health through integrated surveillance of antimicrobial resistance. Foodborne Pathog Dis 14:545–557. doi: 10.1089/fpd.2017.2283. [DOI] [PMC free article] [PubMed] [Google Scholar]
- 52.Bankevich A, Nurk S, Antipov D, Gurevich AA, Dvorkin M, Kulikov AS, Lesin VM, Nikolenko SI, Pham S, Prjibelski AD, Pyshkin AV, Sirotkin AV, Vyahhi N, Tesler G, Alekseyev MA, Pevzner PA. 2012. SPAdes: a new genome assembly algorithm and its applications to single-cell sequencing. J Comput Biol 19:455–477. doi: 10.1089/cmb.2012.0021. [DOI] [PMC free article] [PubMed] [Google Scholar]
- 53.Federhen S, Rossello-Mora R, Klenk H-P, Tindall BJ, Konstantinidis KT, Whitman WB, Brown D, Labeda D, Ussery D, Garrity GM, Colwell RR, Hasan N, Graf J, Parte A, Yarza P, Goldberg B, Sichtig H, Karsch-Mizrachi I, Clark K, McVeigh R, Pruitt KD, Tatusova T, Falk R, Turner S, Madden T, Kitts P, Kimchi A, Klimke W, Agarwala R, DiCuccio M, Ostell J. 2016. Meeting report: GenBank microbial genomic taxonomy workshop (12–13 May, 2015). Stand Genomic Sci 11:15. doi: 10.1186/s40793-016-0134-1. [DOI] [Google Scholar]
- 54.Li H, Durbin R. 2009. Fast and accurate short read alignment with Burrows-Wheeler transform. Bioinformatics 25:1754–1760. doi: 10.1093/bioinformatics/btp324. [DOI] [PMC free article] [PubMed] [Google Scholar]
- 55.Li H, Handsaker B, Wysoker A, Fennell T, Ruan J, Homer N, Marth G, Abecasis G, Durbin R. 2009. The Sequence Alignment/Map format and SAMtools. Bioinformatics 25:2078–2079. doi: 10.1093/bioinformatics/btp352. [DOI] [PMC free article] [PubMed] [Google Scholar]
- 56.Angiuoli SV, Gussman A, Klimke W, Cochrane G, Field D, Garrity G, Kodira CD, Kyrpides N, Madupu R, Markowitz V, Tatusova T, Thomson N, White O. 2008. Toward an online repository of standard operating procedures (SOPs) for (meta)genomic annotation. OMICS 12:137–141. doi: 10.1089/omi.2008.0017. [DOI] [PMC free article] [PubMed] [Google Scholar]
- 57.Payot S, Bolla JM, Corcoran D, Fanning S, Megraud F, Zhang Q. 2006. Mechanisms of fluoroquinolone and macrolide resistance in Campylobacter spp. Microbes Infect 8:1967–1971. doi: 10.1016/j.micinf.2005.12.032. [DOI] [PubMed] [Google Scholar]
- 58.Engberg J, Aarestrup FM, Taylor DE, Gerner-Smidt P, Nachamkin I. 2001. Quinolone and macrolide resistance in Campylobacter jejuni and C. coli: resistance mechanisms and trends in human isolates. Emerg Infect Dis 7:24–34. doi: 10.3201/eid0701.010104. [DOI] [PMC free article] [PubMed] [Google Scholar]
- 59.Hao H, Yuan Z, Shen Z, Han J, Sahin O, Liu P, Zhang Q. 2013. Mutational and transcriptomic changes involved in the development of macrolide resistance in Campylobacter jejuni. Antimicrob Agents Chemother 57:1369–1378. doi: 10.1128/AAC.01927-12. [DOI] [PMC free article] [PubMed] [Google Scholar]
- 60.Campioni F, Souza RA, Martins VV, Stehling EG, Bergamini AMM, Falcao JP. 2017. Prevalence of gyrA mutations in nalidixic acid-resistant strains of Salmonella Enteritidis isolated from humans, food, chickens, and the farm environment in Brazil. Microb Drug Resist 23:421–428. doi: 10.1089/mdr.2016.0024. [DOI] [PubMed] [Google Scholar]
- 61.Thong KL, Ngoi ST, Chai LC, Teh CS. 2016. Quinolone resistance mechanisms among Salmonella enterica in Malaysia. Microb Drug Resist 22:259–272. doi: 10.1089/mdr.2015.0158. [DOI] [PubMed] [Google Scholar]
- 62.O’Regan E, Quinn T, Pages JM, McCusker M, Piddock L, Fanning S. 2009. Multiple regulatory pathways associated with high-level ciprofloxacin and multidrug resistance in Salmonella enterica serovar enteritidis: involvement of RamA and other global regulators. Antimicrob Agents Chemother 53:1080–1087. doi: 10.1128/AAC.01005-08. [DOI] [PMC free article] [PubMed] [Google Scholar]
- 63.Hopkins KL, Davies RH, Threlfall EJ. 2005. Mechanisms of quinolone resistance in Escherichia coli and Salmonella: recent developments. Int J Antimicrob Agents 25:358–373. doi: 10.1016/j.ijantimicag.2005.02.006. [DOI] [PubMed] [Google Scholar]
- 64.Gutierrez B, Herrera-Leon S, Escudero JA, Hidalgo L, Gonzalez-Sanz R, Arroyo M, San Millan Á, Echeita MA, Gonzalez-Zorn B. 2009. Novel genetic environment of qnrB2associated with TEM-1 and SHV-12 on pB1004, an IncHI2 plasmid, in Salmonella Bredeney BB1047 from Spain. J Antimicrob Chemother 64:1334–1336. doi: 10.1093/jac/dkp340. [DOI] [PubMed] [Google Scholar]
- 65.Marti E, Balcázar JL. 2012. Multidrug resistance-encoding plasmid from Aeromonas sp. strain P2GI. Clin Microbiol Infect 18:E366–E368. doi: 10.1111/j.1469-0691.2012.03935.x. [DOI] [PubMed] [Google Scholar]
- 66.McDermott PF, Tyson GH, Kabera C, Chen Y, Li C, Folster JP, Ayers SL, Lam C, Tate HP, Zhao S. 2016. Whole-genome sequencing for detecting antimicrobial resistance in nontyphoidal Salmonella. Antimicrob Agents Chemother 60:5515–5520. doi: 10.1128/AAC.01030-16. [DOI] [PMC free article] [PubMed] [Google Scholar]
Associated Data
This section collects any data citations, data availability statements, or supplementary materials included in this article.
Supplementary Materials
Data Availability Statement
Isolates described here are listed in Table S1 and are deposited in the Sequence Read Archive or were independently assembled and submitted to GenBank prior to the start of the analysis.