

Abstract
In this study, the Maillard reaction (MR) of glucose was applied to improve the physicochemical and functional properties of walnut protein isolate (WNPI). The MR products (MRPs) were prepared with glucose at 0 h (MRP0), 1 h (MRP1), 2 h (MRP2) and 3 h (MRP3) heating at 95 °C. The Infra-Red spectrum showed reduction of amide and S–H functionalities in MRPs with complete intermixing of glucose in MRP3. Scanning electron microscopy indicated changes in the morphology of MRP3 which also exhibited promising antioxidant effect. Significant decrease (P < 0.05) in hydrophobicity values (Ho) and increase (P < 0.05) in emulsifying activity/emulsifying stability indexes values were observed for MRPs. Uniform droplet distribution was observed in microscopy of emulsions while an increase in the interfacial protein concentration (Г) was obtained for MRPs. These results suggest that MR is useful in improving the utilization of this protein in food product development.
Keywords: Walnut protein isolate, Maillard reaction, Physicochemical and functional properties, FT-IR, SEM, Antioxidant effect
Introduction
Plant proteins have been associated with imperative benefits towards human diet and nutrition, specifically in those parts of the world where average protein intake in food is comparatively lower than rest of the world (Qin et al., 2012). These proteins are often incorporated in food systems as one of the major ingredients and subsequently, impart special properties to the food (Lima et al., 2014). The applications of plant proteins in foods for gelling, foaming, stabilizing and as emulsifiers have been reported (Resendiz-Vazquez et al., 2017). Nuts and seeds are important sources of proteins and various studies on their functionalities have already been discussed (Mao and Hua, 2012).
MR is a common and important chemical reaction which can be used in the development of suitable ingredients for food application (Zhou et al., 2017). MR is the reaction between carbonyl groups of sugar and amine groups of amino acids which produces desirable changes in food properties. Many modification methods have been reported for plant proteins including physical, chemical and enzymatic methods, however, MR has been reported a safe way for modification of proteins functionalities (Huang et al., 2012).
Walnut oil is receiving interest in food industries because of the beneficial properties it imparts to human health. The huge consumption of oil from walnut results in production of by-products i.e. defatted walnut flour (DWF) (Khan et al., 2018). Furthermore, the world annual production of DWF in walnut oil industries is still uncertain. DWF is further utilized in development of bakery staff or used as feed for animals (Khan et al., 2018). DWF is also reported to be a rich source of proteins, containing about 24% proteins on a dry weight basis (Sze-Tao and Sathe, 2000). The extraction and processing of WNPI from DWF will provide opportunity for food industries to adopt new plant proteins in food development; which will lead to utilize the by-product generated in walnut oil industries. WNPI showed excellent functional properties in processing of meat, cake and ice cream products (Mao and Hua, 2012), however; little or no information has been reported on MRPs of WNPI. The current study was designed to extract WNPI from DWF, to evaluate MR effects on physicochemical and functional properties of WNPI which may possibly enhance the utilization of this protein in food or industry products.
Methods and materials
Preparation of DWF
Walnuts were purchased from Al Madina walnut traders, Dir upper, KPK, Pakistan. DWF was prepared according to (Sze-Tao and Sathe, 2000). Simply, walnuts were ground to paste, followed by mixing with n-hexane with ratio of 1:10 (w/v). The slurry was magnetically stirred for 3 h at ambient temperature followed by vacuum filtration. The filtrates were again dissolved in methanol with same ratio for complete removal of oil and were vacuum filtered. The resultant flour was dried in fume hood for 24 h at 45 °C and then was ground into fine powder.
Extraction of WNPI
WNPI was extracted from DWF according to method of Mao and Hua (2012) with slight modifications. Simply, DWF was mixed with de-ionized water (1:20 w/v). 1 N NaOH was used to adjust pH of the mixture to 11 and centrifuged at 20000 g for 20 min. The insoluble precipitate was dissolved in de-ionized water with same ratio as earlier and was centrifuged. The supernatants were collected and their pH was re-adjusted to 4.5 by addition of 1 N HCl, followed by centrifugation (20,000 g) for 20 min. The precipitate was afterwards dissolved in water where the pH was again retained to 7 using 1 N NaOH and then freeze dried. The WNPI was composed of 91.39% protein, 0.54% fat, 0.18% crude fiber, 2.59% ash and 5.3% moisture, using standard method (A.O.A.C, 1990).
MR
The MR model consisted of WNPI and glucose in a ratio of 2:2 (g) was dissolved in 100 ml of 50 Mm phosphate buffer (pH 8) and was then freeze dried. 1 g of these freeze dried samples was taken separately in glass tubes and heated for 1, 2 and 3 h in water bath at 95 °C. The samples were cooled to 4 °C and then stored at − 20 °C prior to further use. The different timings for MR were previously selected for ovalbumin protein (Tu et al., 2013).
FTIR
A “Thermo-Nicolet 6700 FTIR spectrometer with ATR mode” was used in obtaining FTIR spectra of WNPI and MRPs. The frequency range of 4000–650 cm−1 was selected using 256 scans at 8 (1/cm) resolution.
SEM
SEM was performed to observe the surface morphology of WNPI and MRPs under “SEM, Model VEGA TESCON” with variable pressure. Gold sputtering of samples was carried out and images were taken at 1, 2, 5, 20 and 50 µm magnifications (Khan et al., 2018).
Surface hydrophobicity (Ho)
The Ho of the samples was determined according to Hou and Chang (2004). 1% (w/v) solution of each sample was further diluted to different concentrations (0.2–0.004%) and then 25 µL of 1-anilino-8 naphtalene-sulfonate (ANS) were added to 5 mL of the sample. The excitation (380 nm) and emission (480 nm) wavelengths were selected at a fluorescence spectrophotometer. The slope of intensity versus protein concentration plot was used to calculate Ho.
Antioxidant assay
2, 2-Diphenyl-1-picrylhydrazyl (DPPH) free radical scavenging activity
DPPH free radical scavenging assay was performed for all the samples using the method proposed by Tu et al. (2013). Accordingly, the mixture of 1 mL of DPPH (0.1 mmol/L in ethanol) and 3 mL of each sample (1 mg/mL) was kept at 25 °C for 30 min in dark. The measurement of absorbance was taken at 517 nm using double beam spectrophotometer. The following formula was used to determine DPPH radical-scavenging activity
AS = Absorbance of sample; AC = absorbance of control
2-2′-azino-bis (3-ethylbenzothiazolin-6-sulphonic acid) (ABTS) scavenging activity
ABTS radical scavenging assay was carried out according to the protocol earlier described by Re et al. (1999). In this method, 3.92 µL of the radical solution was added into 80 µL (2.5 mg/mL) of each sample separately, followed by incubation at 37 °C for 10 min. The absorbance was measured at 734 nm while the ABTS activity was obtained using the following equation:
EAI and ESI
In 100 mL of distilled water, 1 g of each sample was dispersed, stirred for 1 h followed by mixing 6 mL of this solution with 2 mL corn oil. The final mixtures were separately homogenized using “homogenizer D-160 DLABT, China” for 1 min at 30, 000 rpm. EAI and ESI were measured using the procedures adopted by Pearce and Kinsella (1978). Immediately after homogenization, 20 µL of the emulsion was diluted with 5 mL of SDS solution (0.1% w/v). The solution was mixed rapidly with vortex and the absorbance was measured at 500 nm. The following equations were used for calculation of EAI and ESI
c = protein concentration (g/mL); l = optical path (0.01 m); φ = oil volume fraction (0.25); dilution factor (250); t = 10 min; A0 = absorbance at 0 min (emulsion storage); A10 = absorbance at 10 min (emulsion storage).
Microscopy of emulsion
After homogenization, 20 µL of emulsion was placed carefully at microscope slide. The oil droplet distribution and flocculation were observed using a microscope (10 × objective) connected with computer. To observe coalescence, same procedure was repeated for images after 2 h storage of emulsions.
Droplet size measurements
The droplet sizes of emulsions were measured using particle size analyzer. In this method, 1 mL of emulsion and 10 mL SDS solution (1% w/v) were mixed and the volume-weighted mean diameter (D4, 3) as well as the volume-surface mean diameter (D3, 2) were then determined. The specific surface area (m2/mL emulsion) was calculated by the following equation (Walstra, 1983).
φ = oil volume fraction; D3, 2 = volume-surface average diameter of the particles suspended in SDS solution.
Interfacial protein concentration (Г)
The adsorbed proteins concentration at the o/w interfaces of the emulsions was determined according to the method proposed by Patton and Huston (1986). In this method, 2 mL of each emulsion was separately mixed with equal amount of 50% (w/v) sucrose solution, poured into a test tube containing 7 mL of 5% (w/v) sucrose solution. All the tubes were centrifuged for 30 min at 5000 g and were kept frozen for 24 h at − 40 °C. Afterwards, the creamy layer was collected from the tubes, mixed with 20 mL SDS solution (1% w/v) and shaken for an hour. The adsorbed protein concentrations (Cad, in mg/ml emulsion) for all of the emulsions were determined according to Markwell et al. (1978). The following equation was used to calculate Г (mg/m2).
Sv = Emulsion droplet specific interfacial area (m2/mL emulsion).
Statistical analysis
All the experiments were carried out in triplicate while the data was analyzed through one-way ANOVA. SAS 8.1 software (SAS Institute Inc., NC, USA) was used in calculating Duncan multiple range test P < 0.05 to which the means were compared.
Results and discussion
FTIR
Infra-Red spectroscopy has been recognized as one of the most useful techniques to study the structural assignments in molecules especially, various functionalities in organic/bio molecules. The interactions amongst various protein-polysaccharide systems and the consequential changes in the absorptions for various functional groups after reaction have been well established using FTIR analysis (Martins et al., 2012). The FTIR spectrum of WNPI (Fig. 1) shows characteristic absorption for proteins which includes absorption in the range 3200–3600 (1/cm) for free and hydrogen bonded N–H/O–H vibrations. The C-H starching absorptions at 2960–2870 (1/cm), amide I band for C=O group at 1750 (1/cm), absorption for amide II band at 1540 (1/cm) due to N–H deformations and amide III band appeared at 1330 (1/cm) indicated the presence of C–N, C–O functionalities. The anti-symmetric starching vibration for COO− (carboxylate ion) appeared at 1660 (1/cm). Weak absorption for S–H group appeared at 2400 (1/cm) while the bends for C–S/C=S groups appeared at 780 (1/cm). Out of plant bending was observed at 630 (1/cm) for N–H deformation. No absorption for disulfide bonds was recorded since it was beyond the 600 (1/cm) limits of our spectra. The finger print region of FTIR spectrum (1600–600 1/cm) is of particular interest for amide bonds of proteins and the protein-glucose mixture since major changes in the intensity of absorptions bands are usually observed in this part. After the MR, as expected, differences in the IR of MRP0 appeared due to the rigorous glycation as the intensity of some of the amide absorption bands reduced in B (amide I and amide II) while amide III absorption does not appeared in MRP0. The S–H absorption remained the same while the C–S/C=S absorption at 730 (1/cm) also reduced. The IR spectrum of MRP0 revealed glucose absorptions intermixed with that of protein; the most characteristic peak appeared at 1050 (1/cm) resulted from C–O bending vibrations. Another peak appeared at 1090 (1/cm) which was assigned to ether/glycosidic linkages (C–O–C) (Kajiwara et al., 1993).
Fig. 1.
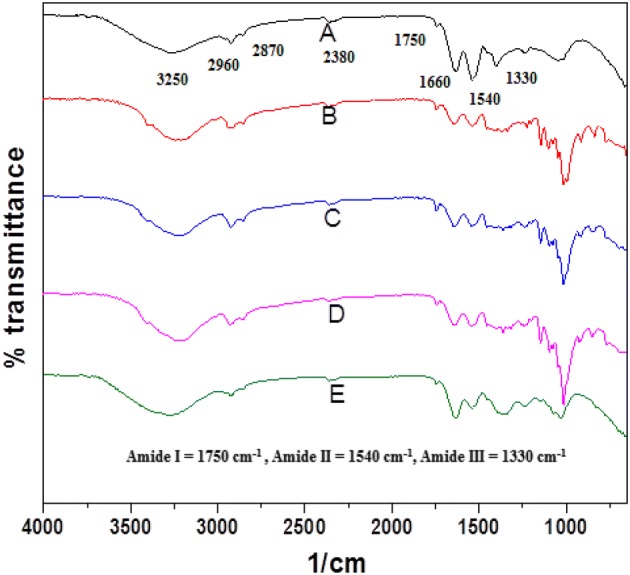
FTIR spectrums of WNPI (A), MRP0 (B), MRP1 (C), MRP2 (D) and MRP3 (E)
The heat treated samples (MPR1, MRP2, MRP3) showed that many of protein absorptions have been reduced while new absorption bends appeared due to formation of C=O (Amadori rearrangement), C=N (Schiff bases formation) as well as pyrazin type C–N bonds (Yaylayan et al., 1994). The absorption of O–H rearranged to 3200–3100 (1/cm) upon modification in MRP1, MRP2; however the absorption shifted towards 3300 (1/cm) in MRP3 (Pirestani et al., 2018). This change in the frequency shift could be attributed to the strong hydrogen bonding between the two substances or the complete integration of glucose in protein molecules (Nursten, 2005). The intensity of S–H group reduced in MRP1, MRP2 but enhanced again in MRP3. Similarly, the glucose characteristic peak at 1050 1/cm reduced while the N–H oop band at 650 (1/cm) increased in MRP3. In conclusion, MR somewhat changed the structures of MRP0, MRP1, MRP2 and MRP3 which have already been described in literature (Pirestani et al., 2018).
SEM
Information regarding the micro structures of isolated proteins and changes occurred in the structural features of protein-glucose conjugates obtained via MR was determined by the use of SEM (Fig. 2). The SEM image for WNPI showed that the dried protein appeared to form irregular shaped thin sheets, with a relatively low diameter as compared to the subsequent glycated conjugates. The glycated unheated MR sample MRP0 showed larger dimensions and diameter probably due to the solid mixing instead of using aqueous media (Chevalier et al., 2001). These particles show thicker globular structure where the protein sheets tend to unfold, hence, produced larger aggregates with stiff extended structures. The MRP1 and MRP2 showed flocculated structures with no well-defined particles observed while relatively smaller particles were observed in MRP3 as compared to MRP0 thus showing a complex conjugate which tend to acquire the original protein structure. The least intermixing of protein and glucose may be originated from the newly formed covalent interactions as well as MRPs. In Conclusion, Addition of glucose to protein sampled resulted in changing the overall morphology, size and structure of the material, followed by the formation of flocculated particles in heat treated MRPs and finally into smaller particles. The small particle size and production of MRPs could be responsible for the promising antioxidant effect of sample MRP3 (discussed later).
Fig. 2.

SEM images of WNPI (A), MRP0 (B), MRP1 (C), MRP2 (D) and MRP3 (E)
Surface hydrophobicity (Ho)
The Ho of WNPI and its subsequent glucose formulations (MRP0–MRP3) are shown in Table 1. As shown in the table significant decrease (P < 0.05) was observed in Ho with increase in heating time respectively. The decrease in Ho values probably is because of the blocking of hydrophobic sites of the surface protein or the protein joined to glucose is not more hydrophobic with or without heating (Galazka et al., 1999). Similar decrease in Ho after glycation has been reported for mung bean protein isolate (Zhou et al., 2017). Generally, glycation has been reported to reduce the hydrophobic groups of the protein as reported for sample MRP0 while further decrease in Ho values of samples MRP1–MRP3 with increase in heating time may possibly because of protein further aggregation (Wong et al., 2011).
Table 1.
Hydrophobicity and DPPH and ABTS free radical scavenging activities of the samples
| Conc (μg/mL) | Standard drugs | Concentration-dependent DPPH % scavenging | ||||
|---|---|---|---|---|---|---|
| Ascorbic acid | WNPI | MRP0 | MRP1 | MRP2 | MRP3 | |
| 50 | 38.2 ± 0.02 | 30.2 ± 0.2b | 21.2 ± 0.01c | 08.2 ± 0.2e | 15.1 ± 0.02d | 39.2 ± 0.1a |
| 100 | 88.3 ± 0.01 | 58.8 ± 0.01a | 39.6 ± 0.2c | 09.4 ± 0.1e | 30.5 ± 0.3d | 42.2 ± 0.01b |
| 250 | 100 ± 0.2 | 66.6 ± 0.11a | 55.4 ± 0.2c | 15.6 ± 0.01e | 45.01 ± 0.05d | 58.3 ± 0.83b |
| 500 | – | 80.1 ± 0.41b | 82.8 ± 0.03a | 20.3 ± 0.2e | 65.2 ± 0.08d | 75.2 ± 0.01c |
| (IC50, μg/mL) | 65.4 ± 0.01 | 87.4 ± 0.1d | 120.1 ± 0.8c | – | 300.01 ± 0.02a | 130.2 ± 0.1b |
| Trolox* | Concentration dependent ABTS % scavenging | ||||||
|---|---|---|---|---|---|---|---|
| 50 | – | 27.1 ± 0.15c | 37.2 ± 0.04a | 02.7 ± 0.1e | 05.3 ± 0.2d | 29.3 ± 0.03b | |
| 100 | – | 44.5 ± 0.54b | 43.3 ± 0.05a | 09.7 ± 0.3e | 12.2 ± 0.09d | 40.2 ± 0.08c | |
| 250 | – | 63.5 ± 0.12a | 59.1 ± 0.03b | 19.3 ± 0.04e | 32.3 ± 0.3d | 54.7 ± 0.13c | |
| 500 | – | 79.3 ± 0.31b | 82.2 ± 0.07a | 30.1 ± 0.7e | 47.4 ± 0.6d | 71.3 ± 0.06c | |
| IC50 (µg/mL) | 2.0 ± 0.03 | 120.04 ± 0.4c | 125.1 ± 0.3b | – | – | 158.7 ± 0.09a | |
| Hydrophobicity (Ho) | 208.1 ± 1.32a | 198.52 ± 2.1b | 185.77 ± 1.7c | 176.55 ± 1.4d | 162.27 ± 2.2e | ||
Values were mean ± SD of three determinations. Values of a–e indicate significant difference among each row (P < 0.05)
Antioxidant activities
The WNPI and its subsequent glucose formulations (MRP0–MRP3) were tested for their antioxidant effect using DPPH and ABTS free radical scavenging assays (Table 1).
In DPPH free radical scavenging assay, The most potent antioxidant effect was displayed by WNPI with IC50 value of 87.4 ± 0.1 μg/mL followed by protein + glucose mixture (unheated) MRP0 (IC50 = 120.1 ± 0.8 μg/mL). No increase in the antioxidant effect was observed in mixing of glucose with the protein however, very low DPPH activity was observed when the samples were submitted to heat (MRP1 and MRP2), whereas sample MRP1 was not even effective at a dose of 500 μg/mL. Various proteins or amino acid containing compounds including glycine, whey protein, chitosan have been reported to possess strong antioxidant effects (Yin et al., 2014). The same trend in the antioxidant activities has already been observed by (Qiang et al., 2017) since addition of glucose or heating could result in decrease of antioxidant activity. The decrease could also be attributed to the non-altered tertiary structure of protein in the initial Millard reaction, masking effect of glucose due to intermolecular hydrogen bond formation and blockade of active functional groups responsible for the antioxidant activity (Wang and Wang, 2015). Interestingly, MRP3 showed retained antioxidant effect with IC50 value of 130 ± 0.1 μg/mL. This could be attributed to the change in tertiary structure of protein with addition of glucose in 3 h heating which caused the glycosides part diffusing into the protein as well as formation of various aromatics, heterocyclic compounds, melanoidins or intermediate reductones (Yin et al., 2014), pyrazins or shiffs base products as discussed in the IR spectral analysis earlier. Analyzing the dose dependency, MRP3 was the most potent amongst all at dose of 50 μg/mL showing 39.2 ± 0.1% activity as compared to ascorbic acid which exhibited 38.2 ± 0.02% activity at the same dose, however, the rate of increase in percent antioxidant effect was variant throughout higher concentration.
All the samples were also assessed for their antioxidant effect in ABTS assay. The same pattern of effect was observed for WNPI which showed IC50 value of 120.04 ± 0.4, followed by MRP0 with IC50 125.1 ± 0.3 and MRP3 having IC50, 158.7 ± 0.09 µg/mL respectively. Due to low antioxidant profile of MRP1 and MRP2, no IC50 values were calculated. Sample WNPI and MRP0 were active in all the doses while MRP1 and MRP2 showed no antioxidant effect even in the highest dose of 500 µg/mL. Trolox was used as positive control.
EAI and ESI
The EAI and ESI values of WNPI and MRPs are shown in Fig. 3. In this study, the significant increase (P < 0.05) in EAI and ESI values have been observed for MRPs of WNPI. The EAI and ESI values have been increased by 52.14% and 54.31% respectively in MRP3 as compared to WNPI. These changes are possibly because of the formation of soluble fractions of protein with heating that can stabilize oil–water interface/or the change in surface chemistry of the protein as earlier observed in FTIR, SEM and Ho. Many other researchers also reported the similar increase in EAI and ESI with MR including mung been protein isolate (Zhou et al., 2017), and egg protein (Tu et al., 2013). The enhancements in both the indexes are attributed to changes in surface chemistry of WNPI with addition of glucose followed by heat.
Fig. 3.
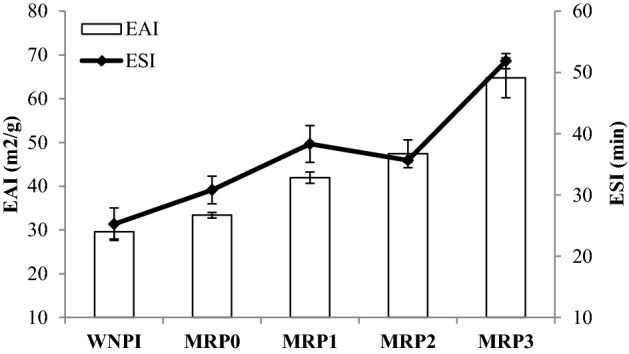
EAI and ESI values of WNPI and MRPs
Microscopy of emulsion
Microscopy of the emulsions produced with WNPI and MRPs were performed as shown in Fig. 4A, B. The photos were taken from emulsions in two phases, immediately (Fig. 4A; zero time) and after 2 h storage of emulsions (Fig. 4B). In Fig. 4A, the emulsion showed no flocculation and coalescence with uniform particle size distribution in WNPI as well as in MRPs. However, after 2 h storage of emulsion, slightly larger particle size distribution has been observed (Fig. 4B) in MRPs of WNPI. These results suggested that initially WNPI and MRPs are firmly attached to the oil droplets where the bulky hydrophobic parts of glucose oriented to water phase which results in steric stabilizing layer to stop or resist the flocculation and coalescence of the oil droplets (Sun et al., 2011). However, after the 2 h storage, the possible coalescence was happened which tend to increase the droplet sizes in WNPI and MRPs (Fig. 4B). Similar results have been reported for whey proteins isolate as well (Zhu et al., 2010).
Fig. 4.

Microscopy of emulsions. 4a represent emulsion photos at zero time while 4b represent emulsion photography after 2 h storage of emulsion. In both 4a and 4b (A–E) representing (A) WNPI, (B) MRP0, (C) MRP1, (D) MRP2 and (E) MRP3
Droplet sizes and interfacial protein concentration (Г)
Droplet sizes and interfacial protein concentration of WNPI and their MRPs are shown in Fig. 5. The results for volume-weighted mean diameter (D4, 3) show no significant difference (P < 0.05) among WNPI or its subsequent MRPs product. However, the results for volume-surface mean diameter (D3, 2) show significant increase (P < 0.05) with increase in heating time for MRPs (MRP1–MRP3). The bigger droplet sizes are attributed to protein aggregation during heating which alter and/or may lost hydrophobic groups these are responsible to contact with oil phase of the emulsion. The Ho results in this study also reveal the same phenomenon where the significant decrease in hydrophobic groups was observed with increasing the heating time. However, interesting results for Г were observed for WNPI and MRPs, where gradual increase in values was observed (Fig. 5). Generally, the protein concentration in oil water interface is the critical factor for stabilization of emulsion which results in preventing the oil droplet coalescence (McClements, 2004). Furthermore, the increase of the Г values in MRPs, may be, because of the association or attraction of protein in the aqueous phase and the aggregated protein. As earlier noted in ESI values (higher emulsions stabilities for MRPs; Fig. 3) and in emulsion microscopy (Fig. 4A, B) no visible flocculation and coalescence were observed. These changes are possibly because of the higher protein interfacial concentration.
Fig. 5.
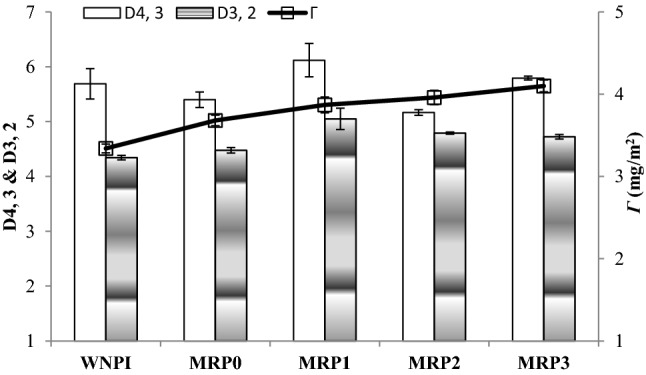
Droplet sizes diameters and interfacial protein concentration
The MR of walnut protein isolate with glucose improved significantly the physicochemical and functional properties of MR products. The IR technique was useful to monitor the changes in characteristic bonds within the MRPs due to rigorous glycation and heating. The changes in overall morphology, size and structure of the MRPs including flocculation and formation of relatively smaller particles in MRP3 were also observed in SEM images. All the MRPs showed promising antioxidant effect in both DPPH and ABTS free radical scavenging assays which may be due to the larger surface area provided by MRPs. The significant decrease in hydrophobicity values (Ho) of MRPs was attributed to protein aggregation and dissociation while the change in surface morphology in MRPs imparted significant increase (P < 0.05) in their EAI and ESI values. The increase in the oil droplets sizes (2 h storage) of emulsions were observed due to the slight coalescence incurred by the combination of the oil droplets as well as increase in the interfacial protein concentration was obtained for MRPs. These results suggest that MR with glucose in solid system impart modification of WNPI, enhances the antioxidant effect, surface properties and functional properties towards quality food protein.
Acknowledgements
No funding was received from any agencies (public and commercial) or not for profit sectors.
Compliance with ethical standards
Conflict of interest
The author declare that they are no conflict of interest
Footnotes
Publisher's Note
Springer Nature remains neutral with regard to jurisdictional claims in published maps and institutional affiliations.
Contributor Information
Sahibzada Fahim Ullah, Phone: 0092-333-0525988, Email: sahibzadafahimullah@gmail.com.
Nasir Mehmood Khan, Email: nasir@sbbu.edu.pk.
Farman Ali, Email: alinuml@gmail.com.
Shujaat Ahmad, Email: razmianbuterfly@yahoo.com.
Zia Ullah Khan, Email: ziakhujari@yahoo.com.
Noor Rehman, Email: noorrehman@sbbu.edu.pk.
Abdul Khaliq Jan, Email: abdukhaliq@gmail.com.
Nawshad Muhammad, Email: nawshadmuhammad@ciitlahore.edu.pk.
References
- A.O.A.C . Methods of Analysis. 15. Washington: Association 243 of Official Agricultural Chemistry; 1990. [Google Scholar]
- Chevalier F, Chobert J, Popineau Y, Nicolas M, Haertle T. Improvement of functional properties of b-lactoglobulin glycated through the Maillard reaction is related to the nature of the sugar. Int. Dairy J. 2001;11:145–152. doi: 10.1016/S0958-6946(01)00040-1. [DOI] [Google Scholar]
- Galazka VB, Dickinson E, Ledward DA. Emulsifying behavior of 11S globulin Viciafaba in mixtures with sulphated polysaccharides Comparison of thermal and high pressure treatments. Food Hydrocoll. 1999;13:425–435. doi: 10.1016/S0268-005X(99)00028-4. [DOI] [Google Scholar]
- Hou HD, Chang KC. Structural characteristics of purified glycinin from soy beans stored under various conditions. J. Agric. Food Chem. 2004;52:3792–3800. doi: 10.1021/jf035072z. [DOI] [PubMed] [Google Scholar]
- Huang X, Tu Z, Xiao H, Wang H, Zhang L, Hu Y, Zhang Q, Niu P. Characteristics and antioxidant activities of ovalbumin glycated with different saccharides under heat moisture treatment. Food Res. Int. 2012;48:866–872. doi: 10.1016/j.foodres.2012.06.036. [DOI] [Google Scholar]
- Kajiwara K, Uemura T, Kishikawa H, Nishida K, Hashiguchi Y, Uehara M, Shichiri M. Noninvasive measurement of blood glucose concentrations by analysing Fourier transform infra-red absorbance spectra through oral mucosa. Med. Biol. Eng. Comput. 1993;31(1):17–22. doi: 10.1007/BF02446645. [DOI] [PubMed] [Google Scholar]
- Khan GM, Khan NM, Khan ZU, Ali F, Jan AK, Muhammad N, Elahi R. Effect of extraction methods on structural, physiochemical and functional properties of dietary fiber from defatted walnut flour. Food Sci. Biotechnol. 2018;27(4):1015–1022. doi: 10.1007/s10068-018-0338-9. [DOI] [PMC free article] [PubMed] [Google Scholar]
- Lima BNB, Lima FF, Tavares MIB, Costa AMM, Pierucci APTR. Determination of the centesimal composition and characterization of flours from fruit seeds. Food Chem. 2014;15:293–299. doi: 10.1016/j.foodchem.2013.11.036. [DOI] [PubMed] [Google Scholar]
- Mao X, Hua Y. Composition, structure and functional properties of protein concentrates and isolates produced from walnut (Juglans regia L.) Int. J. Mol. Sci. 2012;13:1561–1581. doi: 10.3390/ijms13021561. [DOI] [PMC free article] [PubMed] [Google Scholar]
- Markwell MA, Haas SM, Bieber LL, Tolbert NE. A modification of the Lowry procedure to simplify protein determination in membrane and lipoprotein samples. Anal. Biochem. 1978;87(1):206–210. doi: 10.1016/0003-2697(78)90586-9. [DOI] [PubMed] [Google Scholar]
- Martins JT, Cerqueira MA, Bourbon AI, Pinheiro AC, Souza BWS, Vicente AA. Synergistic effects between k-carrageenan and locust bean gum on physicochemical properties of edible films made thereof. Food Hydrocoll. 2012;29:280–289. doi: 10.1016/j.foodhyd.2012.03.004. [DOI] [Google Scholar]
- McClements DJ. Protein stabilized emulsions. Curr. Opin. Colloid Interface Sci. 2004;9:305–313. doi: 10.1016/j.cocis.2004.09.003. [DOI] [Google Scholar]
- Nursten HE. The Maillard reaction: chemistry, biochemistry, and implications. London: Royal Society of Chemistry; 2005. [Google Scholar]
- Patton S, Huston GE. A method for isolation of milk fat globules. Lipids. 1986;21:170–174. doi: 10.1007/BF02534441. [DOI] [PubMed] [Google Scholar]
- Pearce KN, Kinsella JE. Emulsifying properties of protein: Evaluation of a turbidimetric technique. J. Agric. Food Chem. 1978;26:716–723. doi: 10.1021/jf60217a041. [DOI] [Google Scholar]
- Pirestani S, Nasirpour A, Keramat J, Desobry S, Jasniewski J. Structural properties of canola protein isolate-gum Arabic Maillard conjugate in an aqueous model system. Food Hydrocoll. 2018;79:228–234. doi: 10.1016/j.foodhyd.2018.01.001. [DOI] [Google Scholar]
- Qiang Z, Caie Wu, Fan G, Li T, Wen X. Characteristics and enhanced antioxidant activity of glycated Morchella esculenta protein isolate. Food Sci. Technol. 2017;38(1):126–133. doi: 10.1590/1678-457x.01917. [DOI] [Google Scholar]
- Qin Z, Guo X, Lin Y, Chen J, Liao X, Hu X, Wu J. Effects of high hydrostatic pressure on physicochemical and functional properties of walnut (Juglans regia L.) protein isolate. J. Sci. Food Agric. 2012;93(5):1105–1111. doi: 10.1002/jsfa.5857. [DOI] [PubMed] [Google Scholar]
- Re R, Pellegrini N, Proteggente A, Pannala A, Yang M, Rice-Evans C. Antioxidant activity applying an improved ABTS radical cation decolorization assay. Free Radic. Biol. Med. 1999;26(9):1231–1237. doi: 10.1016/S0891-5849(98)00315-3. [DOI] [PubMed] [Google Scholar]
- Resendiz-Vazquez JA, Ulloa JA, Urías-Silvas JE, Bautista-Rosales PU, Ramírez-Ramírez JC, Rosas-Ulloa P, González-Torres L. Effect of high-intensity ultrasound on the technofunctional properties and structure of jackfruit (Artocarpus heterophyllus) seed protein isolate. Ultrason. Sonochem. 2017;37:436–444. doi: 10.1016/j.ultsonch.2017.01.042. [DOI] [PubMed] [Google Scholar]
- Sun WW, Yu SJ, Yang XQ, Wang JM, Zhang JB, Zhang Y, Zheng EL. Study on the rheological properties of heat-induced whey protein isolate-dextran conjugate gel. Food Res. Int. 2011;44:3259–3263. doi: 10.1016/j.foodres.2011.09.019. [DOI] [Google Scholar]
- Sze-Tao KWC, Sathe SK. Walnuts (Juglans regia L): proximate composition, protein solubility, protein amino acid composition and protein in vitro digestibility. J. Sci. Food Agric. 2000;80:1393–1401. doi: 10.1002/1097-0010(200007)80:9<1393::AID-JSFA653>3.0.CO;2-F. [DOI] [Google Scholar]
- Tu Z-C, Hu Y-M, Wang H, Huang X-Q, Xia SQ, Niu P-P. Microwave heating enhances antioxidant and emulsifying activities of ovalbumin glycated with glucose in solid-state. J. Food Sci. Technol. 2013 doi: 10.1007/s13197-013-1120-x. [DOI] [PMC free article] [PubMed] [Google Scholar]
- Walstra P. Formation of emulsion. In: Becher P, editor. Encyclopedia of Emulsion Technology: Basic Theory. New York: Marcel Decker; 1983. pp. 57–127. [Google Scholar]
- Wang Y, Wang X. Binding, stability, and antioxidant activity of quercetin with soy protein isolate particles. Food Chem. 2015;188:24–29. doi: 10.1016/j.foodchem.2015.04.127. [DOI] [PubMed] [Google Scholar]
- Wong BT, Day L, Augustin MA. Deamidated wheat protein–dextran Maillard conjugates: Effect of size and location of polysaccharide conjugatedon steric stabilization of emulsions at acidic pH. Food Hydrocoll. 2011;25(6):1424–1432. doi: 10.1016/j.foodhyd.2011.01.017. [DOI] [Google Scholar]
- Yaylayan VA, Huyghues-Despointes A, Feather MS. Chemistry of Amadori rearrangement products: analysis, synthesis, kinetics, reactions, and spectroscopic properties. Crit. Rev. Food Sci. Nutr. 1994;34(4):321–369. doi: 10.1080/10408399409527667. [DOI] [PubMed] [Google Scholar]
- Yin Z, Sun Q, Zhang X, Jing H. Optimised formation of blue Maillard reaction products of xylose and glycine model systems and associated antioxidant activity. J. Sci. Food Agric. 2014;94(7):1332–1339. doi: 10.1002/jsfa.6415. [DOI] [PubMed] [Google Scholar]
- Zhou L, Wu F, Zhang X, Wang Z. Structural and functional properties of Maillard reaction products of protein isolate (mung bean, Vigna radiate L.) with dextran. Int. J. Food Proper. 2017;20:1246–1258. [Google Scholar]
- Zhu D, Damodaran S, Lucey JA. Physicochemical and emulsifying properties of whey protein isolate (WPI)-dextran conjugates produced in aqueous solution. J. Agric. Food Chem. 2010;58:2988–2994. doi: 10.1021/jf903643p. [DOI] [PubMed] [Google Scholar]