Abstract
Air pollution has aroused significant public concern in China, therefore, long-term air-quality data with high temporal and spatial resolution are needed to understand the variations of air pollution in China. However, the yearly variations with high spatial resolution of air quality and six air pollutants are still unknown for China until now. Therefore, in this paper, we analyze the spatial and temporal variations of air quality and six air pollutants in 366 cities across mainland China during 2015–2017 for the first time to the best of our knowledge. The results indicate that the annual mean mass concentrations of PM2.5, PM10, SO2, and CO all decreased year by year during 2015–2017. However, the annual mean NO2 concentrations were almost unchanged, while the annual mean O3 concentrations increased year by year. Anthropogenic factors were mainly responsible for the variations of air quality. Further analysis suggested that PM2.5 and PM10 were the main factors influencing air quality, while NO2 played an important role in the formation of PM2.5 and O3. These findings can provide a theoretical basis for the formulation of future air-pollution control policy in China.
Subject terms: Environmental impact, Environmental economics
Introduction
Air pollution has become a serious global threat to human health and welfare1,2. With the rapid development of China’s economy, more fossil fuels are burned and vehicles are in use, resulting in increased particulate matter (PM2.5 and PM10), carbon dioxide (CO2), nitrogen dioxide (NO2), sulfur dioxide (SO2), and ozone (O3) concentrations in the atmosphere3. Air pollution has already aroused significant public concern in China, especially in recent years4–6. Air-pollution data with high spatial and temporal resolution are needed to accurately evaluate the health risks associated with air-pollutant exposure7. Fortunately, hourly concentrations of PM2.5, PM10, SO2, NO2, CO, and O3 have been published online by the Ministry of Environmental Protection (MEP) since January 2013.
Spatial and temporal variability of air pollutants are key parameters in the assessment of associations between exposure and human health8. A number of studies have reported temporal and spatial variations of gaseous and particulate matter pollutants in China9–11, but most of them were limited only to a single city or air pollutant12. For example, Zhang and Cao13 revealed the spatial and temporal variability of PM2.5 concentrations in 190 cities from April 2014 to April 2015. Cheng et al.14 indicated that the annual mean NO2 concentrations decreased significantly from 71.0 µg/m3 in 2000 to 49.0 µg/m3 in 2008.
Spatial and temporal variations of multiple pollutants have also been reported15,16. Wang et al.7 indicated that PM2.5, PM10, CO, and SO2 concentrations were higher in cities located in the North region than those in the West and Southeast regions in 31 capital cities from March 2013 to February 2014. Yan et al.17 pointed out that PM2.5 was the most serious pollutant, followed by O3 in Beijing in 2013. Although the previous studies provided valuable insights, none covered long-time air quality and data of the six air pollutants to reveal the yearly variations, and the cities in the aforementioned studies were too few to represent the characteristic of air quality and the six air pollutants in China.
The monitoring sites of air pollutants have been stable in 366 cities in China since January 2015. Therefore, the purpose of this study is to understand the temporal and spatial variations of PM2.5, PM10, SO2, NO2, CO, and O3 in 366 cities from 2015 to 2017. We analyzed the variations of air quality index (AQI) and six air pollutants during 2005–2017, and revealed the correlations among air pollutants under different AQI ranges using Pearson’s correlation coefficient.
Results
Overview of AQI and six air pollutants
The annual mean AQI has decreased year by year over mainland China (Fig. 1a). Compared with 2015, it decreased by 10.0% in 2017. Further analysis indicated that the air quality improved in 298 cities, and the number of cities with excellent air quality (see Supplementary Material, Table S1) increased from 46 in 2015 to 64 in 2017, while that with slight pollution decreased from 49 in 2015 to 26 in 2017 (Fig. 1b). The annual mean mass concentrations of PM2.5, PM10, SO2, and CO all decreased year by year. Compared with 2015, they decreased by 14.5%, 13.6%, 30.5%, and 14.5% in 2017, respectively. Different from the four air pollutants, the annual mean NO2 concentrations were almost unchanged. However, the annual mean O3 concentrations increased year by year, e.g., by 10.7% in 2017 compared with that in 2015.
Figure 1.
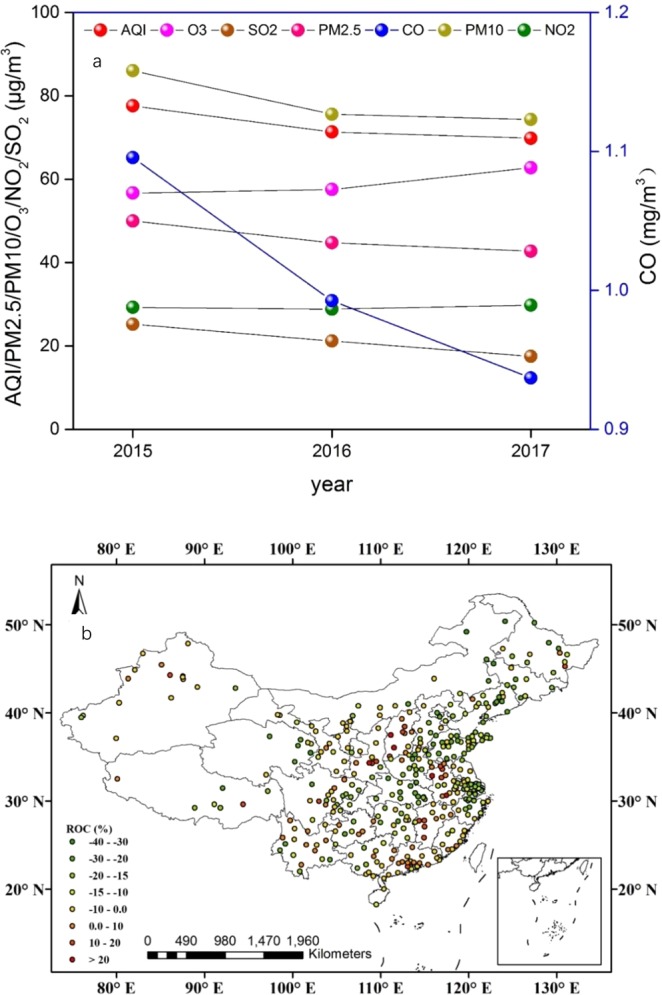
(a) Overview of variations of AQI and six pollutants over mainland China during 2015–2017; (b) Regional differences in annual mean AQI over mainland China between 2017 and 2015.
Spatial and temporal variations of six air pollutants
Variations of PM2.5 concentration
Figure 2a shows the number of cities with annual mean PM2.5 concentrations that met various World Health Organization (WHO) guideline thresholds during 2015–2017. As the figure shows, one can find that the number of cities that met WHO air-quality guidelines (AQG, 0–10 μg/m3) increased from zero in 2015 to one in 2017, and those that met WHO interim target-1 (IT-1, 25–35 μg/m3) increased from 57 in 2015 to 77 in 2017. Furthermore, compared with 2015, there were 309 cities with annual mean PM2.5 concentrations that had decreased in 2017 (Fig. 2b).
Figure 2.
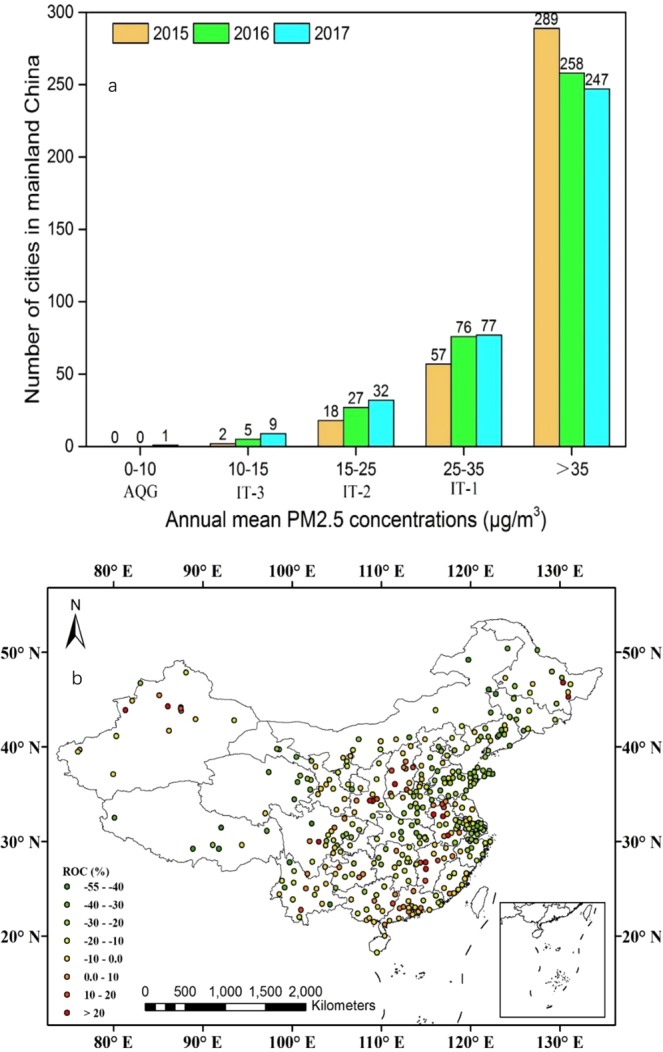
(a) Number of cities with annual mean PM2.5 concentrations (μg/m3) that met various WHO guideline thresholds during 2015–2017. (b) Regional differences in annual mean PM2.5 concentrations (μg/m3) over mainland China between 2017 and 2015.
Variations of PM10 concentration
As Fig. 3a shows, the number of cities with annual mean PM10 concentrations that met the WHO IT-3 limit of 30 μg/m3 increased from three in 2015 to eight in 2017, and that with a value smaller than 70 μg/m3 increased from 123 in 2015 to 182 in 2017. Additionally, compared with 2015, there were 309 cities with annual mean PM10 concentrations that had decreased in 2017.
Figure 3.
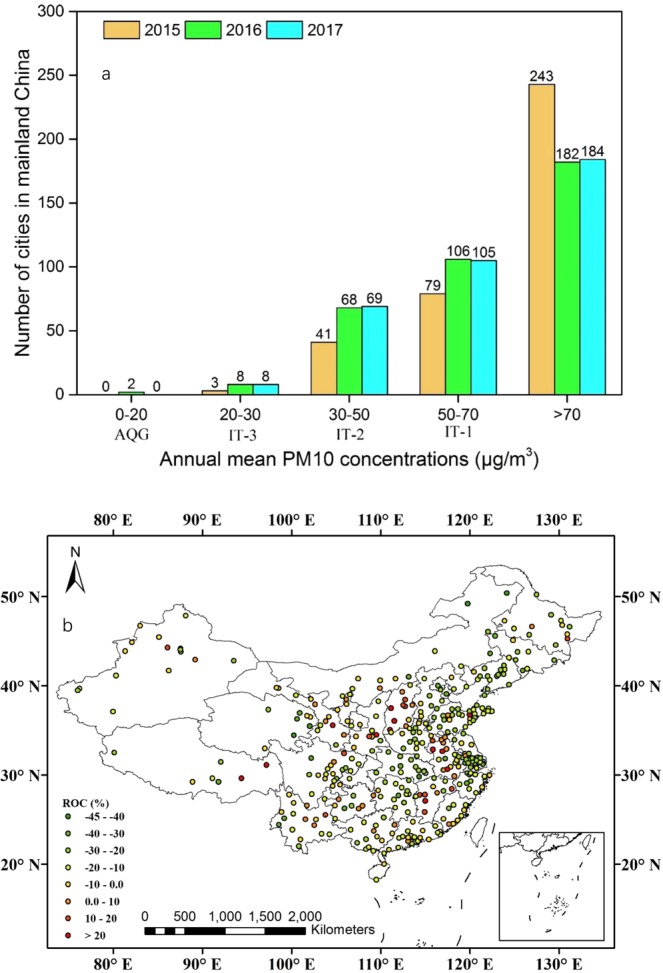
(a) Number of cities with annual mean PM10 concentrations (μg/m3) that met various WHO guideline thresholds during 2015–2017. (b) Regional differences in annual mean PM10 concentrations (μg/m3) over mainland China between 2017 and 2015.
Variations of SO2 concentration
As Fig. 4a shows, the number of cities that met the first-level concentration limit of 20 μg/m3 (GB 3095-2012) increased from 153 in 2015 to 268 in 2017, while that exceeding the second-level concentration limit of 60 μg/m3 (GB 3095-2012) decreased from 11 in 2015 to two in 2017. Additionally, compared with 2015, there were 325 cities with a decrease in annual mean SO2 concentrations in 2017 (Fig. 4b).
Figure 4.
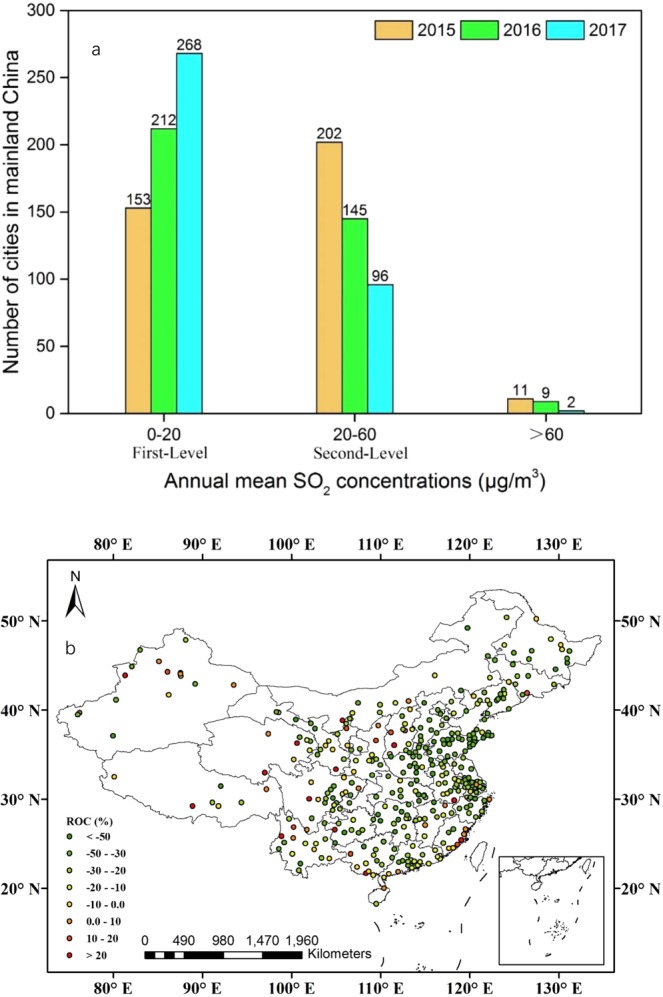
(a) Number of cities with annual mean SO2 concentrations (μg/m3) that met various guideline thresholds of GB 3095–2012 during 2015–2017. (b) Regional differences in annual mean SO2 concentrations (μg/m3) over mainland China between 2017 and 2015.
Variations of NO2 concentration
The variations of annual mean NO2 concentrations remained relatively stable during 2015–2017, with 2016 (28.8 μg/m3) decreasing by 1.6% from 2015 (29.3 μg/m3), while increasing by 3.4% in 2017 (29.8 μg/m3) compared with 2016 (Fig. 1a). Further analysis indicated that the number of cities that met the first-level concentration limit of 40 μg/m3 (GB 3095-2012) increased from 299 in 2015 to 301 in 2017 (Fig. 5).
Figure 5.
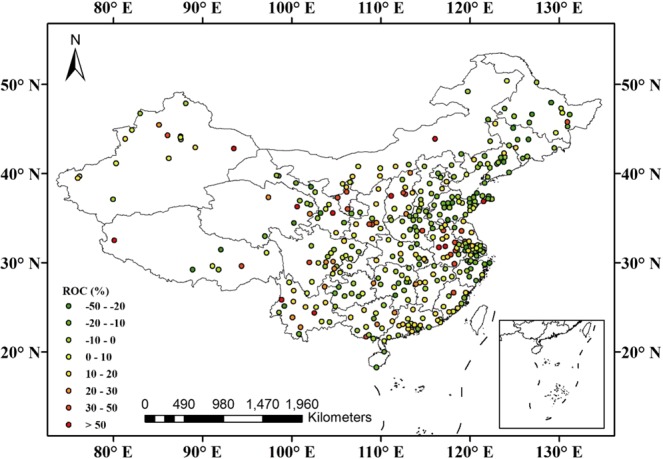
Regional differences in annual mean NO2 concentrations (μg/m3) over mainland China between 2017 and 2015.
Variations of CO concentration
From Fig. 1a, one can find that the annual mean CO concentration decreased year by year, dropping from 1.10 mg/m3 in 2015 to 0.99 mg/m3 in 2016 and 0.94 mg/m3 in 2017. Figure 6 shows that the number of cities with annual mean mass concentrations of less than 1.0 mg/m3 increased from 181 in 2015 to 241 in 2017. Compared with annual mean CO concentration in 2015, there were 285 cities with a value that had decreased in 2017.
Figure 6.
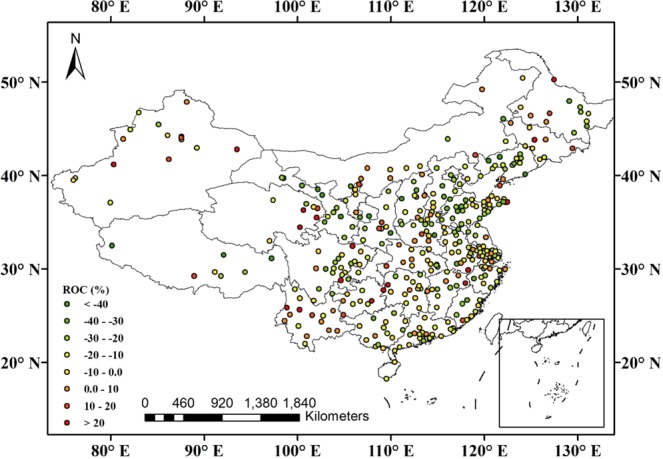
Regional differences in annual mean CO concentration (mg/m3) over mainland China between 2017 and 2015.
Variations of O3 concentration
O3 is a secondary pollutant, formed in the atmosphere through the photochemical reactions of NOx and volatile organic compounds (VOCs) affected by precursor emissions, solar radiation, and other meteorological factors18,19. Figure 7 shows that the number of cities with annual mean O3 concentration less than 40.0 μg/m3 decreased from 24 in 2015 to 7 in 2017, and those with a concentration greater than 60.0 μg/m3 increased from 133 in 2015 to 222 in 2017. In addition, compared with the annual mean O3 concentrations in 2015, the number of cities with a decrease in 2017 reached 83, while there were 283 cities with an increase (Fig. 7), suggesting that O3 should become the new focus of air-pollution prevention and treatment.
Figure 7.
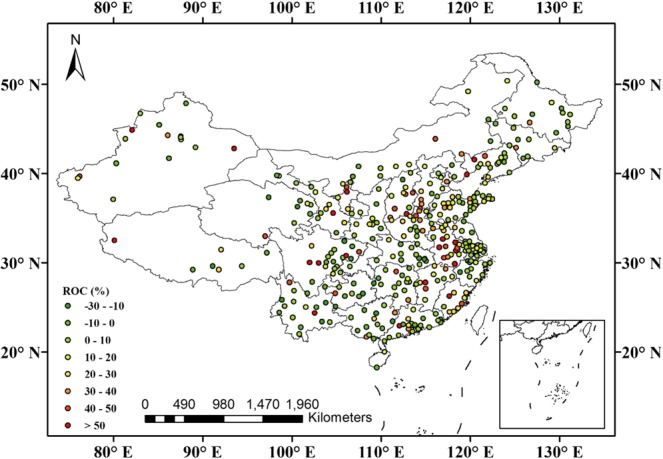
Regional differences in annual mean O3 concentration (μg/m3) over mainland China between 2017 and 2015.
Natural reasons for variations in air quality
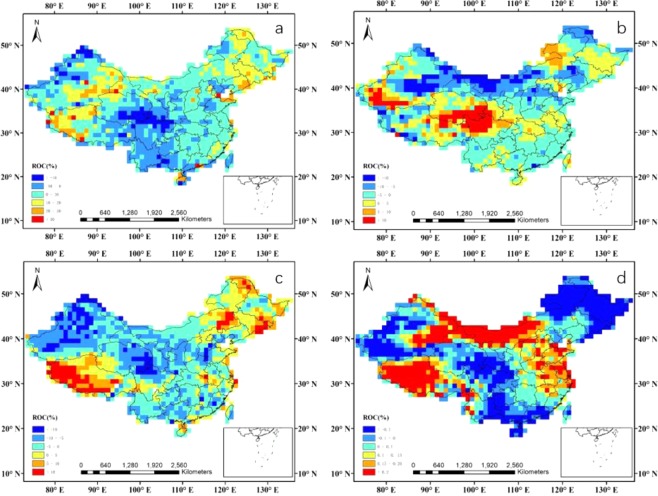
The variations in air quality are due to both natural and anthropogenic reasons. The planetary boundary layer (HPBL), relative humidity (RH), wind speed (WS), and air temperature (AT) are the most important meteorological factors influencing air quality. From Fig. 8, one can find that the variations of annual mean value for HPBL were small, while the rate of change (ROC) values were mainly between −10% and 10%, and the annual mean values for HPBL were 494.4, 495.8, and 519.0 m for 2015, 2016, and 2017, respectively. This means that the variations of HPBL may be not have a significant impact on the variations in air quality. The ROC values of RH and WS were also mainly between −10% and 10%, and there were large percentages of areas over mainland China with ROC values between −5% and 5%. In addition, the annual mean values for RH were 57.2%, 57.7%, and 56.5% for 2015, 2016, and 2017, respectively, while that for WS was 4.8 m/s during 2015–2017. Little change in AT was found during 2015–2017, while the ROC values ranged mainly between −0.1% and 0.2% and the annual mean value for AT was 280.5 K during 2015–2017.However, there are differences of HPBL, RH, WS, and AT in different seasons during 2015–2017. More favorable meteorological conditions in winter 2017 than that in 2015, such as higher HPBL values, lower RH values, and faster WS (Figs S1–S5). Thus, for the annual variations of the six air pollutants, based on the above analysis, we can infer that meteorological factors have small influence on the changes of air quality, so what were the main causes of the changes in air quality?
Figure 8.
Regional differences over mainland China between 2017 and 2015. (a) Planetary boundary layer height. (b) Relative humidity. (c) Wind speed. (d) Air temperature.
Anthropogenic reasons for variations in air quality
The variations in annual mean PM10 concentrations were similar to that of PM2.5 in most cities over China during 2015–2017. The results indicated that PM2.5 accounted for a large fraction of PM10 in most cities (>50%), leading to similar trends between PM2.5 and PM10, in agreement with the findings of Wang et al.7 and Zhang et al.13. The maximums of both the annual mean PM2.5 and PM10 concentrations were found in Xinjiang Province, and were determined to primarily be the result of mineral dust from the Taklimakan Desert20–22. Interestingly, the increased annual mean PM2.5/PM10 concentrations were mainly in Anhui, Shanxi, Jiangxi, and Guangdong Provinces, consistent with the variations of AQI. It can be inferred that PM2.5 and PM10 may be the major pollutants contributing the most to air quality. To effectively control atmospheric environmental pollution, new stricter environmental protection laws were put into place and enforced in China since 1 January 2015 23,24. The Statistical Communique of the People’s Republic of China (SCPRC) indicated that the total emissions of particulate matter decreased year by year, from 1538.0 ten thousand tons in 2015 to 796.3 ten thousand tons in 201725–27. Compared with 2015, it fell by 48.2% in 2017, which was the main reason for the downward trend of annual mean PM2.5/PM10 concentration (Fig. 9a).
Figure 9.
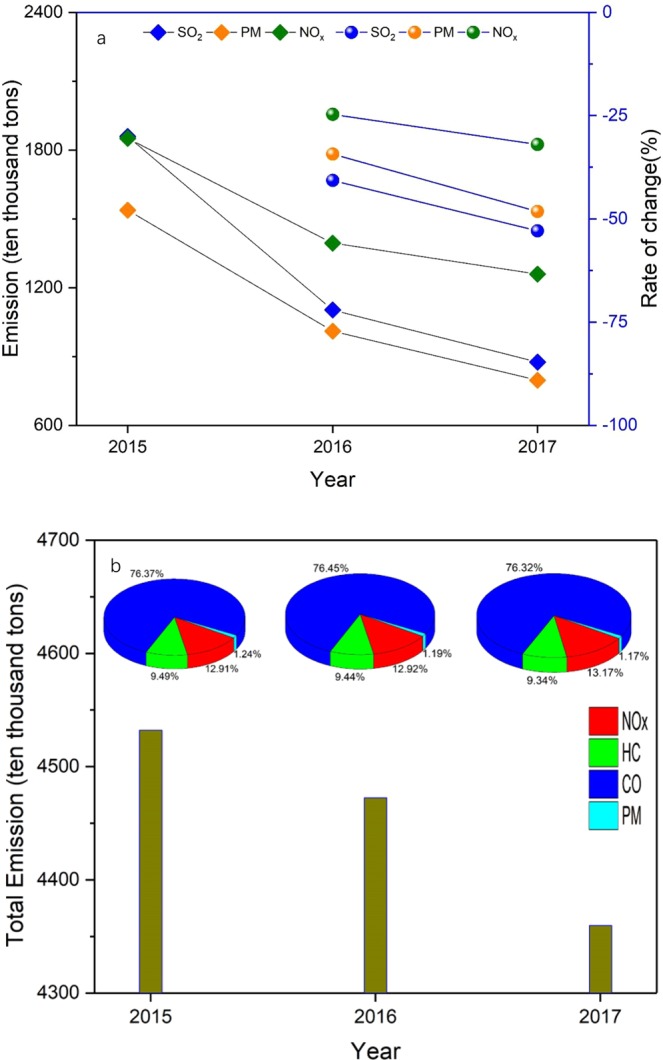
(a) Total emissions of air pollutants over mainland China during 2015–2017. (b) Total amount of air pollutants discharged by motor vehicles over mainland China during 2015–2017.
The sources of SO2 pollution are classified as both natural and anthropogenic sources, with the latter estimated to account for more than 70% of SO2 global emissions28. Statistics indicated that total emissions of SO2 decreased year by year, from 1859.1 ten thousand tons in 2015 to 1102.9 ten thousand tons in 2016, and then to 875.4 ten thousand tons in 2017. Compared with 2015, SO2 emissions fell by 52.9% in 2017 (Fig. 9a)25–27. Coal burning was the main anthropogenic source of SO2. Therefore, the downward trend of SO2 pollution in China was mainly due to government efforts to restrain emissions from coal consumption and the effectiveness of flue-gas desulfurization devices in reducing SO2 emissions29,30.
Fossil fuel combustion, agricultural production, and motor vehicle emissions are the main sources of NOx emissions31,32. Emission-reduction measures, especially of reduced vehicle NOx emissions, could decrease NO2 concentrations significantly33. NOx emissions accounted for ~13% of total emissions from motor vehicles over mainland China during 2015–2017, with values of 584.9, 577.8, 574.3 ten thousand tons for 2015, 2016, and 2017, respectively (Fig. 9b)34–36, which may be related to the variations of annual mean NO2 concentration over mainland China.
Motor vehicle emissions are one of the main sources of CO emissions, which account for ~76% of total motor vehicle emissions. Statistics indicated that CO emissions from motor vehicles decreased year by year, from 3461.1 ten thousand tons in 2015 to 3419.3 ten thousand tons in 2016, and then to 3327.3 ten thousand tons in 2017. Compared with 2015, CO emissions fell by 3.9% in 2017 (Fig. 9b)34–36, which may mainly account for the downward trend of annual mean CO concentration. O3 formation rate mainly depends on the photochemical reactions of NOx and VOCs. Although NOx concentrations have decreased year by year from 2015 to 2017, O3 formation was also affected by the intensity of solar radiation5,7.
Correlations between six air pollutants under different AQI ranges
Based on three years’ daily mean concentrations during 2015–2017, the Pearson’s correlation coefficients (R) were calculated, and the correlations between AQI and six air pollutants under different AQI ranges were obtained (Tables 1 and S2). When the air quality was excellent or pollution severe (Table S1), the correlations between AQI and PM10 were the best (R = 0.85 and 0.48, respectively), followed by PM2.5. Additionally, when the air quality was categorized as good, slight pollution, moderate pollution, heavy pollution (Table S1), the correlations between AQI and PM2.5 were the best (R = 0.81, 0.65, 0.44, and 0.46), followed by PM10. This further suggested that PM2.5 and PM10 were the main factors influencing air quality. The results are different from Yan et al.17, which indicated that PM2.5 was the major pollutant in China and in Beijing.
Table 1.
Correlations between six air pollutants under different AQI values.
| 0–50 | 51–100 | |||||||||||
|---|---|---|---|---|---|---|---|---|---|---|---|---|
| PM2.5 | PM10 | SO2 | NO2 | CO | O3 | PM2.5 | PM10 | SO2 | NO2 | CO | O3 | |
| AQI | 0.76 | 0.85 | 0.21 | 0.34 | 0.16 | 0.30 | 0.81 | 0.80 | 0.23 | 0.34 | 0.22 | 0.02 |
| PM2.5 | 1 | 0.59 | 0.18 | 0.33 | 0.24 | 0.01 | 1 | 0.49 | 0.19 | 0.32 | 0.25 | −0.15 |
| PM10 | 1 | 0.20 | 0.30 | 0.11 | 0.13 | 1 | 0.25 | 0.34 | 0.17 | −0.01 | ||
| SO2 | 1 | 0.20 | 0.18 | −0.03 | 1 | 0.27 | 0.26 | −0.17 | ||||
| NO2 | 1 | 0.19 | −0.19 | 1 | 0.24 | −0.32 | ||||||
| CO | 1 | −0.16 | 1 | −0.23 | ||||||||
| O3 | 1 | 1 | ||||||||||
| 101–150 | 151–200 | |||||||||||
| AQI | 0.65 | 0.33 | 0.12 | 0.15 | 0.10 | −0.12 | 0.44 | 0.17 | 0.06 | 0.10 | 0.06 | −0.09 |
| PM2.5 | 1 | −0.08 | 0.14 | 0.31 | 0.11 | −0.27 | 1 | −0.21 | 0.16 | 0.41 | 0.09 | −0.33 |
| PM10 | 1 | 0.10 | 0.06 | 0.01 | 0.03 | 1 | 0.02 | −0.06 | −0.04 | 0.11 | ||
| SO2 | 1 | 0.30 | 0.20 | −0.21 | 1 | 0.33 | 0.19 | −0.21 | ||||
| NO2 | 1 | 0.15 | −0.36 | 1 | 0.15 | −0.41 | ||||||
| CO | 1 | −0.16 | 1 | −0.18 | ||||||||
| O3 | 1 | 1 | ||||||||||
| 201–300 | >300 | |||||||||||
| AQI | 0.46 | 0.39 | 0.05 | 0.11 | 0.11 | −0.07 | 0.37 | 0.48 | −0.07 | −0.12 | −0.03 | 0.11 |
| PM2.5 | 1 | −0.13 | 0.21 | 0.52 | 0.25 | −0.45 | 1 | 0.47 | 0.14 | 0.36 | 0.33 | −0.32 |
| PM10 | 1 | −0.05 | −0.22 | −0.11 | 0.26 | 1 | −0.17 | −0.32 | −0.25 | 0.25 | ||
| SO2 | 1 | 0.36 | 0.27 | −0.23 | 1 | 0.42 | 0.50 | −0.34 | ||||
| NO2 | 1 | 0.35 | −0.54 | 1 | 0.81 | −0.70 | ||||||
| CO | 1 | −0.32 | 1 | −0.65 | ||||||||
| O3 | 1 | 1 | ||||||||||
Significance at the 0.01 level (P < 0.01).
When the air quality was excellent, good, or severe pollution, the correlations between PM2.5 and PM10 were the best (R = 0.59, 0.49, and 0.47, respectively), suggesting that PM2.5 accounted for a large fraction of PM1012. When the air quality was slight, moderate, or heavy pollution, the correlations between PM2.5 and NO2 were the best (R = 0.31, 0.41, and 0.52, respectively), which indicated that NO2 played an important role in the formation of PM2.523,32. Furthermore, at different AQI ranges, the relationship between O3 and SO2, NO2, CO, PM2.5, and PM10 was mainly negative. Among the five air pollutants, the strongest relationship was between O3 and NO2 (−0.70 ≤ R ≤ −0.19), indicating that NO2 was the most important factor among the five air pollutants in the formation of O312,18, allowing us to further infer that NO2 played an important role in the formation of PM2.5 and O3.
Discussion
In this paper, we analyzed the spatial and temporal variations of air quality and six air pollutants in 366 cities over mainland China during 2015–2017 for the first time to the best of our knowledge. Since new stricter environmental protection laws were put into place and enforced in China beginning on January 1, 2015, the air quality has been greatly improved based on an AQI decrease of 10.0% in 2017 compared with that in 2015, and the annual mean mass concentrations of PM2.5, PM10, SO2, and CO all decreased year by year during 2015–2017. Compared with 2015, they decreased by 14.5%, 13.6%, 30.5%, and 14.5% in 2017, respectively. However, the annual mean NO2 concentrations were almost unchanged, and the annual mean O3 concentrations increased year by year. These results indicate that it was the anthropogenic reasons that were mainly responsible for the variations in air quality. Further analysis suggested that PM2.5 and PM10 were the main factors influencing air quality, while NO2 played an important role in the formation of PM2.5 and O3. This paper provides a new view for a comprehensive understanding of the current state of air pollution in China, and the findings will provide a theoretical basis for the formulation of future air-pollution control policy in China.
Methods
AQI and six air pollutants
Automated monitoring systems were installed to measure the concentrations of PM2.5, PM10, SO2, NO2, CO, and O3 at each site in China by MEP. Instrument operation, maintenance, data assurance, and quality control were conducted in strict adherence to recent versions of the China Environmental Protection Standards, e.g., HJ 653-2013, HJ 654-2013, GB 3095-2012, HJ 633-2012, and HJ 664-201337–39. MEP has published hourly concentrations of PM2.5, PM10, SO2, NO2, CO, and O3 at 74 cities since January 2013 (http://106.37.208.233:20035/). After 2013, the number of cities that released air-quality data gradually increased, numbering 189 cities in 2014. Since then, 366 cities have regularly released air-quality data since 2015. Since far more data was released in 2015 than in 2014 and 2013, those data can better reflect the atmospheric environment over mainland China, therefore, hourly mean concentrations of PM2.5, PM10, SO2, NO2, CO, and O3 from January 2015 to December 2017 were collected from MEP. We selected the stations with fixed locations and in continuous operation from 2015 to 2017. Finally, a total of ~1500 stations in 366 cities were used to assess the variations of AQI and six air pollutants throughout China.
Meteorological data
Meteorological data, including HPBL (units of m), RH (units of %), WS (units of m/s), and AT (units of K) were obtained from the U.S. National Centers for Environmental Prediction (NCEP) Final (FNL) Operational Model Global Tropospheric Analyses (https://rda.ucar.edu/datasets/ds083.2/). These NCEP FNL Operational Global Analysis data are on 1° × 1° grids prepared operationally every 6 hours. RH is measured at 2 m above ground and WS and air temperature at a specified pressure difference from ground to 30 hPa.
Analysis methods
AQI is an index representing the status of air quality devised by MEP, which is calculated based on six air pollutants, namely PM2.5, PM10, SO2, NO2, CO, and O340. AQI ranges from 0 to 500, with larger values indicating worse air quality. Furthermore, AQI is divided into six levels based on different scores, i.e., excellent, good, slight pollution, moderate pollution, heavy pollution, and severe pollution17 (see Table S1). The citywide mean concentrations of AQI and six air pollutants were calculated by averaging the concentrations at all sites in each city, which is the same method used by the government to report daily concentrations of air pollutants to the public17. Finally, the daily and annual mean mass concentrations of AQI and six air pollutants, and the annual mean meteorological factors at national scale, were calculated on the basis of the arithmetic average method. Additionally, we used the Pearson correlation coefficient (IBM SPSS 21) to test the correlations between AQI and the six air pollutants, each dataset comprising simultaneous daily mean concentrations of PM2.5, PM10, SO2, NO2, CO, and O3 during 2015–2017. Furthermore, ROC was used to compare the variance in annual mean values of AQI, PM2.5, PM10, SO2, NO2, CO, O3, HPBL, RH, WS, and AT between 2015 and 2017 throughout China. ROC is defined as:
| 1 |
where x and y represent the annual mean values of AQI, PM2.5, PM10, SO2, NO2, CO, O3, HPBL, RH, WS, and AT in 2017 and 2015, respectively.
Supplementary information
Acknowledgements
This work was supported in part by the Beijing Natural Science Foundation (Grant No. 8184087), the National Key R&D Program of China (Grant No. 2017YFB0502800), and the Open Fund of State Key Laboratory of Remote Sensing Science (Grant No. OFSLRSS201715). The authors thank MEP for providing the hourly air-quality data, SCPRC and MEE for providing the total emissions of air pollutants, and NCEP for providing the meteorological data.
Author contributions
Hong Guo proposed the ideas and wrote the manuscript, Xingfa Gu revised the manuscript critically, Guoxia Ma provide a deeper insight into the manuscript revision, Shuaiyi Shi performed the statistical analysis, Wannan Wang interpreted the data, XinZuo drew the figures, and Xiaochuan Zhang retrieved the ground-based data.
Competing interests
The authors declare no competing interests.
Footnotes
Publisher’s note Springer Nature remains neutral with regard to jurisdictional claims in published maps and institutional affiliations.
Supplementary information
is available for this paper at 10.1038/s41598-019-50655-6.
References
- 1.Chudnovsky A, et al. A critical assessment of high-resolution aerosol optical depth retrievals for fine particulate matter predictions. Atmospheric Chemistry and Physics. 2013;13:10907–10917. doi: 10.5194/acp-13-10907-2013. [DOI] [Google Scholar]
- 2.Hansen AB, et al. Long-term exposure to fine particulate matter and incidence of diabetes in the Danish Nurse Cohort. Environment international. 2016;91:243–250. doi: 10.1016/j.envint.2016.02.036. [DOI] [PubMed] [Google Scholar]
- 3.Boys BL, et al. Fifteen-year global time series of satellite-derived fine particulate matter. Environ Sci Technol. 2014;48:11109–11118. doi: 10.1021/es502113p. [DOI] [PubMed] [Google Scholar]
- 4.van Donkelaar A, Martin RV, Brauer M, Boys BL. Use of satellite observations for long-term exposure assessment of global concentrations of fine particulate matter. Environmental health perspectives. 2015;123:135–143. doi: 10.1289/ehp.1408646. [DOI] [PMC free article] [PubMed] [Google Scholar]
- 5.Xue LK, et al. Ground-level ozone in four Chinese cities: precursors, regional transport and heterogeneous processes. Atmospheric Chemistry and Physics. 2014;14:13175–13188. doi: 10.5194/acp-14-13175-2014. [DOI] [Google Scholar]
- 6.Guo Hong, Cheng Tianhai, Gu Xingfa, Chen Hao, Wang Ying, Zheng Fengjie, Xiang Kunshen. Comparison of Four Ground-Level PM2.5 Estimation Models Using PARASOL Aerosol Optical Depth Data from China. International Journal of Environmental Research and Public Health. 2016;13(2):180. doi: 10.3390/ijerph13020180. [DOI] [PMC free article] [PubMed] [Google Scholar]
- 7.Wang Y, Ying Q, Hu J, Zhang H. Spatial and temporal variations of six criteria air pollutants in 31 provincial capital cities in China during 2013-2014. Environment international. 2014;73:413–422. doi: 10.1016/j.envint.2014.08.016. [DOI] [PubMed] [Google Scholar]
- 8.Strickland MJ, et al. Pediatric Emergency Visits and Short-Term Changes in PM2.5 Concentrations in the U.S. State of Georgia. Environmental health perspectives. 2016;124:690–696. doi: 10.1289/ehp.1509856. [DOI] [PMC free article] [PubMed] [Google Scholar]
- 9.Zhou Y, et al. Temporal and Spatial Characteristics of Ambient Air Quality in Beijing, China. Aerosol and Air Quality Research. 2015;15:1868–1880. doi: 10.4209/aaqr.2014.11.0306. [DOI] [Google Scholar]
- 10.Guo H, et al. Assessment of PM2.5 concentrations and exposure throughout China using ground observations. The Science of the total environment. 2017;601-602:1024–1030. doi: 10.1016/j.scitotenv.2017.05.263. [DOI] [PubMed] [Google Scholar]
- 11.Chen Tao, He Jun, Lu Xiaowei, She Jiangfeng, Guan Zhongqing. Spatial and Temporal Variations of PM2.5 and Its Relation to Meteorological Factors in the Urban Area of Nanjing, China. International Journal of Environmental Research and Public Health. 2016;13(9):921. doi: 10.3390/ijerph13090921. [DOI] [PMC free article] [PubMed] [Google Scholar]
- 12.Wang WN, et al. Assessing Spatial and Temporal Patterns of Observed Ground-level Ozone in China. Scientific reports. 2017;7:3651. doi: 10.1038/s41598-017-03929-w. [DOI] [PMC free article] [PubMed] [Google Scholar]
- 13.Zhang YL, Cao F. Fine particulate matter (PM2.5) in China at a city level. Scientific reports. 2015;5:14884. doi: 10.1038/srep14884. [DOI] [PMC free article] [PubMed] [Google Scholar]
- 14.Cheng N, et al. Ground-Level NO2 in Urban Beijing: Trends, Distribution, and Effects of Emission Reduction Measures. Aerosol and Air Quality Research. 2018;18:343–356. doi: 10.4209/aaqr.2017.02.0092. [DOI] [Google Scholar]
- 15.Xie Y, Zhao B, Zhang L, Luo R. Spatiotemporal variations of PM2.5 and PM10 concentrations between 31 Chinese cities and their relationships with SO2, NO2, CO and O3. Particuology. 2015;20:141–149. doi: 10.1016/j.partic.2015.01.003. [DOI] [Google Scholar]
- 16.Zhao S, et al. Annual and diurnal variations of gaseous and particulate pollutants in 31 provincial capital cities based on in situ air quality monitoring data from China National Environmental Monitoring Center. Environment international. 2016;86:92–106. doi: 10.1016/j.envint.2015.11.003. [DOI] [PubMed] [Google Scholar]
- 17.Yan S, et al. Spatial and temporal characteristics of air quality and air pollutants in 2013 in Beijing. Environmental science and pollution research international. 2016;23:13996–14007. doi: 10.1007/s11356-016-6518-3. [DOI] [PubMed] [Google Scholar]
- 18.Zhang Q, et al. Variations of ground-level O3 and its precursors in Beijing in summertime between 2005 and 2011. Atmospheric Chemistry and Physics. 2014;14:6089–6101. doi: 10.5194/acp-14-6089-2014. [DOI] [Google Scholar]
- 19.Ma Zhiqiang, Xu Jing, Quan Weijun, Zhang Ziyin, Lin Weili, Xu Xiaobin. Significant increase of surface ozone at a rural site, north of eastern China. Atmospheric Chemistry and Physics. 2016;16(6):3969–3977. doi: 10.5194/acp-16-3969-2016. [DOI] [Google Scholar]
- 20.Geng G, et al. Estimating long-term PM2.5 concentrations in China using satellite-based aerosol optical depth and a chemical transport model. Remote Sensing of Environment. 2015;166:262–270. doi: 10.1016/j.rse.2015.05.016. [DOI] [Google Scholar]
- 21.Krasnov H, Kloog I, Friger M, Katra I. The Spatio-Temporal Distribution of Particulate Matter during Natural Dust Episodes at an Urban Scale. PloS one. 2016;11:e0160800. doi: 10.1371/journal.pone.0160800. [DOI] [PMC free article] [PubMed] [Google Scholar]
- 22.Xu P, et al. Evaluating the Effects of Springtime Dust Storms over Beijing and the Associated Characteristics of Sub-Micron Aerosol. Aerosol and Air Quality Research. 2017;17:680–692. doi: 10.4209/aaqr.2016.05.0195. [DOI] [Google Scholar]
- 23.Zhao B, et al. Impact of national NOx and SO2 control policies on particulate matter pollution in China. Atmospheric Environment. 2013;77:453–463. doi: 10.1016/j.atmosenv.2013.05.012. [DOI] [Google Scholar]
- 24.Wang S, Xing J, Zhao B, Jang C, Hao J. Effectiveness of national air pollution control policies on the air quality in metropolitan areas of China. Journal of Environmental Sciences. 2014;26:13–22. doi: 10.1016/s1001-0742(13)60381-2. [DOI] [PubMed] [Google Scholar]
- 25.The Statistical Communique of the People’s Republic of China (SCPRC). Available at http://data.stats.gov.cn/easyquery.htm?cn=C01&zb=A0C05&sj=2015.
- 26.The Statistical Communique of the People’s Republic of China (SCPRC). Available at http://data.stats.gov.cn/easyquery.htm?cn=C01&zb=A0C05&sj=2016.
- 27.The Statistical Communique of the People’s Republic of China (SCPRC). Available at http://data.stats.gov.cn/easyquery.htm?cn=C01&zb=A0C05&sj=2017.
- 28.Lu Z, et al. Sulfur dioxide emissions in China and sulfur trends in East Asia since 2000. Atmospheric Chemistry and Physics. 2010;10:6311–6331. doi: 10.5194/acp-10-6311-2010. [DOI] [Google Scholar]
- 29.Li, C. et al. Recent large reduction in sulfur dioxide emissions from Chinese power plants observed by the Ozone Monitoring Instrument. Geophysical Research Letters 37, 10.1029/2010gl042594 (2010).
- 30.Zhao S, et al. Temporal dynamics of SO2 and NOX pollution and contributions of driving forces in urban areas in China. Environmental pollution. 2018;242:239–248. doi: 10.1016/j.envpol.2018.06.085. [DOI] [PubMed] [Google Scholar]
- 31.Krotkov NA, et al. Aura OMI observations of regional SO2 and NO2 pollution changes from 2005 to 2015. Atmospheric Chemistry and Physics. 2016;16:4605–4629. doi: 10.5194/acp-16-4605-2016. [DOI] [Google Scholar]
- 32.Yao YAO, et al. Spatiotemporal variation in NO2 concentrations and socioeconomic driving forces in Chinese cities. Resour. Sci. 2017;39:1383–1393. doi: 10.18402/resci.2017.07.15. [DOI] [Google Scholar]
- 33.Cheng N, et al. Ground-Level NO2 in Urban Beijing: Trends, Distribution, and Effects of Emission Reduction Measures. Aerosol and Air Quality. Research. 2018;18:343–356. doi: 10.4209/aaqr.2017.02.0092. [DOI] [Google Scholar]
- 34.The Ministry of Ecology and Environment of the People’s Republic of China (MEE). China Vehicle Environmental Management Annual Report (2018). Available at, http://www.mee.gov.cn/gkml/sthjbgw/qt/201806/t20180601_442293.htm. Accessed: 1th June 2018.
- 35.The Ministry of Ecology and Environment of the People’s Republic of China (MEE). China Vehicle Environmental Management Annual Report (2017). Available at, http://www.mee.gov.cn/gkml/sthjbgw/qt/201706/t20170603_415265.htm. Accessed: 3th June 2017.
- 36.The Ministry of Ecology and Environment of the People’s Republic of China (MEE). China Vehicle Environmental Management Annual Report (2016). Available at, http://www.mee.gov.cn/home/jrtt_1/201606/t20160602_353154.shtml. Accessed: 2th June 2016.
- 37.The Ministry of Environmental Protection (MEP). Ambient air quality standards. GB 3095-2012. The Ministry of Environmental Protection of People’s Republic of China. (2012a).
- 38.The Ministry of Environmental Protection (MEP). Technical Regulation on Ambient Air Quality Index (on trial). HJ 633-2012. The Ministry of Environmental Protection of People’s Republic of China. (2012b).
- 39.The Ministry of Environmental Protection (MEP). Technical regulation for selection of ambient air quality monitoring stations (on trial). HJ 664-2013. The Ministry of Environmental Protection of People’s Republic of China (2013).
- 40.Hu J, Ying Q, Wang Y, Zhang H. Characterizing multi-pollutant air pollution in China: Comparison of three air quality indices. Environment international. 2015;84:17–25. doi: 10.1016/j.envint.2015.06.014. [DOI] [PubMed] [Google Scholar]
Associated Data
This section collects any data citations, data availability statements, or supplementary materials included in this article.


