Abstract
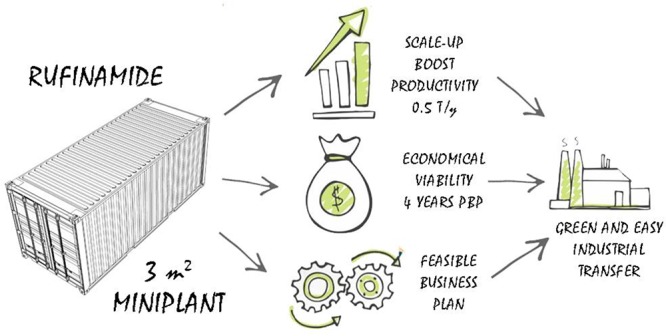
The development of a pilot-scale synthesis of the rufinamide precursor in flow chemistry is reported. Complex steps such as Taylor-flow, segmented flow, and high-temperature processing at high pressure (high-p,T) are successfully combined, overcoming the mixing and heat transfer issues of the scale-up. The cascaded multistep process operates essentially solvent-free in just 3 m2 giving a productivity of 47 g/h (>400 kg/year), which increases by a factor of 7 the lab-scale productivity previously reported as a scale-up proof-of-concept. This publication also includes an economic study of the feasible implementation of this technology for a possible manufacturer, as well as an outline on business development strategies of how to implement such a disruptive technology.
Keywords: Scale-up, Solvent-free, Intensification, Multiphase, Rufinamide
Short abstract
The development of a pilot-scale synthesis of the rufinamide precursor in flow chemistry is reported.
Introduction
Continuous Manufacturing
Before the past few decades, organic chemistry was traditionally conceived in batch, performing nonconnected or discontinuous operations followed each one by the subsequent purification steps.1 These multiple isolations, performed according to current good manufacturing practices (cGMP), usually break the production chain, since the next step is not followed until enough of the isolated intermediates have been produced. Only one unit, usually long duration operation, is conducted at a time in batch.2,3
In the recent years, a step change in this tendency has brought advances in the so-called continuous manufacturing (CM) methodology, which has brought innovations in flow processes in terms of higher production, and less space, energy, and materials, from individual unit operations to end-to-end manufacturing.4 That is because CM has become commonly considered a sustainable process technology compared to batch. On a laboratory scale and using microreactors, the reaction can be carried out in a small-diameter device where conditions can be drastically controlled in such an efficient heat and mass transfer setup. Such new facilities have allowed bringing reactions into harsh p,T conditions,5 which have sped up the reaction rate achieving process intensification in the so-called Novel Process Windows.6 This way has proved to be very attractive to the pharmaceutical industry, which is focused on the manufacture of small molecule active pharmaceutical ingredients (APIs). Actually, in May 2015, the Food and Drug Administration (FDA) encouraged pharma manufacturers and Contract Manufacturing Organizations to switch processes from batch to continuous production, with the development of an ICH guideline for continuous manufacturing of medical products, the completion of which is expected by 2021.7−9 Beyond this legislative authority push, the ACS Green Chemistry Pharmaceutical Roundtable, and by extension the pharmaceutical industry, declared CM as the top-1 priority. As a consequence, several important pharmaceutical companies have made significant investments into small molecule CM, principally driven by technical (e.g., in reactions that require zero headspace or are gas sensitive), quality (e.g., by eliminating cross-contamination concerns with respect to product changeover), safety (the smaller reactor sizes limit the amount of dangerous material), and economic benefits (as discussed below). Therefore, the implementation of these fundamental improvements is being developed as answers to the pharmaceutical market demands as well. The FDA has already expressed its support of CM and recently mentioned the requirements for this implementation, referring to among others process dynamics, batch definition, control materials of the process, equipment qualification, data management, and validation.10,11
The chemical markets in Europe, the U.S., and Japan are experiencing strong difficulty, as production capacity is rapidly increasing in (low-cost) emerging countries, raw materials become more expensive, energy costs rise, demands on product quality increase, and society demands an ever-smaller environmental footprint and increased industrial safety. This exposes a key inefficiency in API manufacturing: batch production, which leads to variable quality due to (i) batch differences, (ii) high drug waste (due to bad batches and wasted inventory), (iii) operational hazards, and (iv) high costs of reagents required for the isolation and purification of intermediate chemical compounds (when moving from one step to the next in the batch production process). It is estimated that pharmaceutical companies could free up €25 billion if they would reduce inventory levels to a realistic target, indicating the potential economic impact of introducing production on-demand. Coupled to this, there is an estimated 75% overcapacity in solid dose manufacturing with the subsequent costs and risk of product deterioration; theoretically, pharma could shut down three out of four manufacturing plants today and still meet demand.12 Despite Europe traditionally being based on batch, growing plant investment in Asia opens an opportunity for CM because of the advantages in front of batch processing. With CM, the manufacturing costs for pharmaceutically relevant compounds could be reduced by an estimated 15% to 50%.13 CM would allow manufacturers to use the increased process understanding for online process control, yielding consistently high-quality products, a better ability for on-demand production, and less material wasted as off-spec products.14 Moreover, flow manufacturing can be coupled to automated production and quality assurance control, which will lead to increased productivity, as the multistep organic synthesis will be reduced from weeks to hours. As such, it is necessary to establish a competitive pricing model that incorporates the cost savings related to drug waste, isolation, and purification processes with the increase in productivity.
Scaling up in Flow Chemistry
In the way the pharmaceutical industry has decided to undergo an industrial transformation from batch to continuous processing, all major pharmaceutical companies have tested the implementation of continuous-flow technology, and several have brought it to pilot- and production-scale, even setting in some cases detailed step-by-step instructions for setting up such platforms.15,16 Following this strategy, nowadays some companies offer and provide pilot- and production-scale micro- and milli-flow apparatus. For example, Chemtrix, Corning, and Ehrfeld Mikrotechnik offer silicon carbide or glass-made plate reactors, the first using 3M Technical Ceramics technology, suitable to achieving tonne-scale productions operating in extreme conditions with corrosive chemicals. In parallel, Syrris offers a complete reactor for laboratory flow chemistry systems. Furthermore, besides a simple smart scale-out in inner and outer dimensions, Ehrfeld Mikrotechnik offers a static mixer-inlay-based Miprowa reactor on a large scale, and Thales-Nano Company is not behind offering scaled versions of lab systems: The H-Cube Midi suitable for flow hydrogenation scale up using H-Cube technology up to a productivity of 500 g/day.
The most common strategy to increase productivity in continuous-flow is parallel numbering-up by suitable dimension enlarging and a modular concept of various channels or reactors operating in parallel. Yet, with this way, despite keeping hydrodynamics and mass/heat transfer features, this option has some drawbacks: (i) it demands a complex and accurate distribution of the flow, especially when operating in Taylor-flow or segmented flow in the splitter step, since usually the flow distribution pattern results in unbalanced channeling,17 and (ii) in order to achieve high scale productivities, this option is basically inviable. For example, to achieve comparable productivity in an experimental biodiesel plant, it would need 3.4 × 10⁶ microreactor units.18
Another strategy to increase productivity is scale-out by increasing the microchannel size. Indeed, an increase of the diameter of the microchannel increases also the reactor volume and subsequently reduces the number of required parallel reactors to achieve the desired productivity. In addition, the clogging risk and the pressure drop are also reduced. Nevertheless, the hydrodynamics, meaning the mixing capacity and the mass and heat transfer, are seriously affected in terms of decreasing chemical reaction efficiency.19−21 In order to overcome this issue, strategies like the use of micromixers inside the channels22 or the use of internal static mixers23,24 have been used in reactors provided, e.g., by Corning or Himile ChemTech. Nevertheless, such strategies are difficult to use in multiphasic systems because of the heterogeneous distribution of the phases.
Multistep Scaling-up Flow Processes
While scaling-up single chemical processes in continuous-flow is becoming routine, the operation of multistep chemical processes on a larger scale is still a challenge. This is so essential for the pharmaceutical industry, which needs on average about eight steps to their final product, the drug, or API. Problems start with simple issues such as starting up the plant, which needs much more than just feeding the solutions into the system. Also, scaling-up transfer is not linear, since many properties change at the same time when geometry does so: e.g., the Reynolds number, which affects kinetics (mixing), fluid mechanics, and thermodynamics (including the time to achieve an equilibrium state). Therefore, doubling the reactor size does not mean the doubling of chemicals, energy, etc. Especially concerning the latter, the new energy requirements can set up the type of materials for the reactor.
Some previous approaches to complete end-to-end synthesis using microflow reactors have been described. One example is the one developed by Trout et al. in collaboration with Novartis International AG, for the synthesis of 45 g/h aliskiren hemifumarate, used as an antihypertension drug.25 Such a miniplant occupies a 7.3 m2 area. Another example is the miniplant developed by Seeberger et al. for the synthesis of 200 g/day artemisinin,26,27 the key API for the treatment of malaria. Besides these examples, Jamison and Snead reduced the total synthesis of ibuprofen down to 3 min with 72% overall yield and initial productivity of 8.1 g/h.28 Finally, Borukhova et al. brought the synthesis of rufinamide, an antiepileptic used in the treatment of Lennox-Gastaut syndrome, on the lab-scale to a productivity of 9 g/h.29
Rufinamide Case
Nearly 80% of people in low- and medium-income countries are affected by a kind of epilepsy, a neurological brain disorder.30 In this context, especially the youngest and the oldest people are more sensitive.31 This illness is treated with cost-effective anticonvulsants.32−34 One of the most relevant drugs in this connection is rufinamide, developed in its first instance by Novartis,35,36 which regulates the activity of sodium channels. Such a five-membered ring heterocyclic drug brought $43.3 million in sales in 2012.37 The synthesis methodology has been revisited and improved in past decades, using different solvents such as toluene and dimethyl sulfoxide (DMSO)38,39 and different catalysts such as Cu(I),40 achieving an overall 36% yield in the multistep synthesis sequence with low selectivity. Rufinamide is a particularly costly drug because of the need for expensive dipolarophiles, but in recent years, the synthesis sequence has been improved with the use of inexpensive methyl 3-methoxyacrylate (MOA).41 This achievement together with the lower E-factor of the process, the amount of waste generated per kilo of product, has given a chance for effective scaleup.42,43
In 2013, our research group at Eindhoven University of Technology (Department of Chemical Engineering and Chemistry) developed a methodology for solvent-free and catalyst-free 1,3-dipolar cycloaddition from 2,6-difluorobenzyl azide using MOA as a diplolarophile. This research made it possible to obtain the rufinamide precursor in continuous flow in high yields and with the sustainability argument of throughout solvent processing.44,45 Here, the use of continuous flow has brought the possibility to operate under safe conditions at high-p,T (p refers to pressure and T to temperature). With manufacturing-related cost savings of 15% to 50%, rufinamide production costs can be lowered by an estimated $1.4 million to $4.5 million (based on COGS—cost of goods sold—of 30% and a 30% profit margin).46 Our protocol has proven to work well on the laboratory scale and should now be confirmed on an industrial scale. A basic flowchart is shown in Scheme 1, where every step is plotted with one different color. This is essential in a broader perspective to move the whole field of flow chemistry forward, as this “missing link” marks a bottleneck in current up-scaling to the desired continuous processing on the industrial scale, especially concerning the developed green solvent-free processing with highest productivities. Therefore, in this paper, a transfer of the respective engineering from smart solvent-free microcapillaries to suitable commercially and industrially robust continuous equipment is described, giving an additional economic study of the viability and the investments needed to build such a miniplant. This research was supported by a User Club for commercial and practical guidance, which involved companies in the field such as HNP Mikrosysteme GmbH; GlaxoSmithKline, GSK; Chemtrix BV; Patheon, part of Thermo Fisher Scientific; Kobelco, Kobe Steel Ltd; and Corning SAS.
Scheme 1. Flowchart for Solvent and Catalyst-Free Synthesis of Rufinamide Precursor.
Materials and Methods
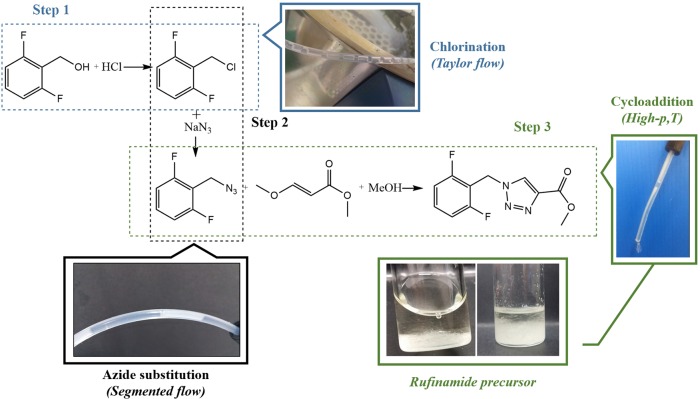
Regarding the chemistry of the process, Scheme 2 describes the paths including pictures of the new miniplant. The three-step process includes (1) a chlorination of 2,6-difluorobenzyl alcohol, followed by (2) an azide substitution giving 2,6-difluorobenzyl azide, finally ending with (3) Huisgen cycloaddition to give the rufinamide precursor, which is obtained by crystallization at room temperature as observed in Scheme 2.
Scheme 2. Chemical Pathway for the Synthesis of Rufinamide Precursor.
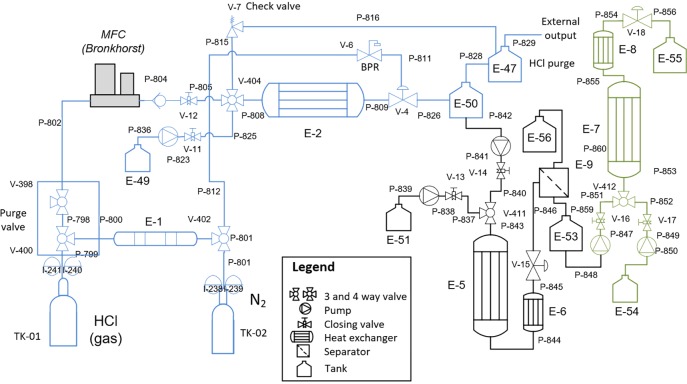
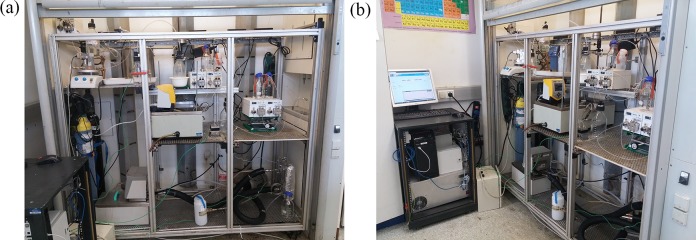
The flowchart of the process in Scheme 1 regarding the chemistry shown in Scheme 2 gave the piping and instrumentation diagram (P&ID) for the miniplant shown in Scheme 3, which was assembled at MicroInnova GmbH (MIC) in Austria in a 3 m2 area (Figure 1a). All pumps, El-Flow, and thermocouples were telescopically commanded from a computer next to the plant (Figure 1b) in order to keep safe during the operation. The whole process in all schemes is divided into three main reaction steps: chlorination (in blue), substitution (in black), and cycloaddition (in green). Between them, some secondary separations are included. The process works fully solvent free with the exception of the water needed to dissolve the sodium azide in the second step. Anyway, the amount of water has been proven to be very low, since we work in the solubility limits of the azide salt.42
Scheme 3. Scale-up Multistep Solvent-Free and Catalyst-Free Synthesis of Rufinamide Precursor.
In blue, the initial chlorination; in black, the azide substitution; and in green, the final cycloaddition.
Figure 1.
Scale-up multistep solvent-free and catalyst-free synthesis of rufinamide precursor. (a) The three-step rufinamide miniplant. (b) The way it was telescopically commanded.
Alcohol Chlorination
In the first step, HCl feeding is performed using a cross purged gas reducer (Linde), using dry nitrogen as an external purging gas. Nitrogen is double dried using a column with calcium chloride and 3A molecular sieves. Polyfluoroalkyl (PFA) tubing of 1/8 in. OD (3.2 mm) and 1.56 mm ID (IDEX) is used to bring the HCl gas to the calibrated El-Flow HCl (Bronkhorst), which is kept at 40 °C only during the previous purging with nitrogen. A t-valve (IDEX) is used to mix the HCl gas with 2,6-difluorobenzyl alcohol giving a Taylor gas–liquid (G/L) flow. The alcohol is pumped using an HPLC pump (Knauer Azura P4.1S) with a pressure sensor. The tubing is then submerged in an oil bath (IKA HBR4) using silicon oil (M100 Carl Roth GmbH). The pressure is regulated using a back pressure regulator (BPR; Equilibar) made of polyether ether ketone (PEEK) with an internal Teflon membrane and nitrogen as a counter gas regulator. Once the reaction is performed, the outlet is coupled to a glass container using Bola GmbH connections. The excess of HCl gas is purged and bubbled into a NaOH 30% solution, from where the remaining gas goes to the external output. The 2,6-difluorobenzyl chlorine is then retained above 40 °C in order to be pumped to the next step.
Azide Substitution
2,6-Difluorobenzyl chlorine obtained in the first step is pumped without any purification using an HPLC pump (Knauer Azura P4.1S) with a pressure sensor and preheated headers, to a t-valve where it is mixed with an aqueous solution of sodium azide. This is the only moment in all of the process where the solvent (water) cannot be skipped. The mixture gives a liquid–liquid biphasic segmented flow. The tubing is then changed to steel 1/8 in. (3.2 mm) OD and 1.56 mm ID (Swagelock) before being submerged in an oil bath (Lauda ECO gold). This time polydimethylphenilsiloxan oil (Lauda Therm 240) is used to achieve high temperatures. Once the reaction is performed, a cooler decreases the temperature before the BPR (IDEX). Once the pressure is dropped, the biphasic mixture is conducted to an inline liquid–liquid separator, where the aqueous and the organic phases are separated using a TF-450 PTFE membrane of 0.45 μm × 47 mm (PALL Corp.). The aqueous phase contains a solution of sodium azide and sodium chloride, and the organic phase contains mainly 2,6-difluorobenzyl azide.
Cycloaddition
For this step, a stacked microchannel reactor (SMCR, Kolbe Steel Ltd.) is used as a compact way to achieve high-p,T in a small space. Here, the reaction mixture is homogeneous, which allows for the internal splitting flow rates (internal numbering-up). The SMCR is isolated using glass wool. 2,6-Difluorobenzyl azide is pumped using an HPLC pump (Knauer Azura P4.1S) with a pressure sensor with any purification after the liquid–liquid separator. A second identical HPLC pump is used to pump MOA directly. In this step, all tubing is made of stainless steel of 1/8 in. (3.2 mm) OD and 1.56 mm ID (Swagelock). Silicon oil (M100 Carl Roth GmbH) is used to heat the reactor. The oil is pumped with an external pump which connects the bath (Julabo HE-4) to the reactor (Figure 2). A very short cooler is coupled in order to avoid solids before the BPR (IDEX).
Figure 2.
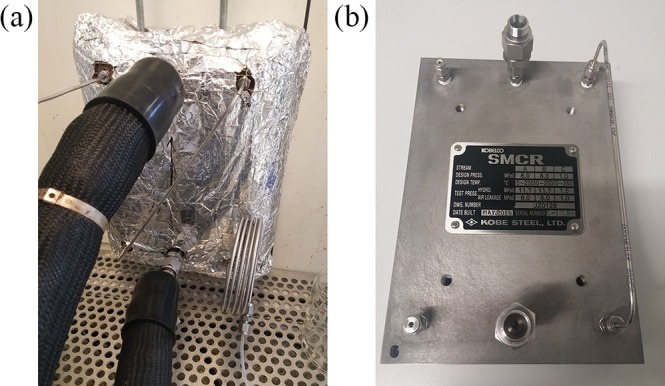
Detailed SMCR reactor. (a) Installed with glass wood isolation. (b) Steel SMCR reactor with connections.
Sequential Startup of the Miniplant
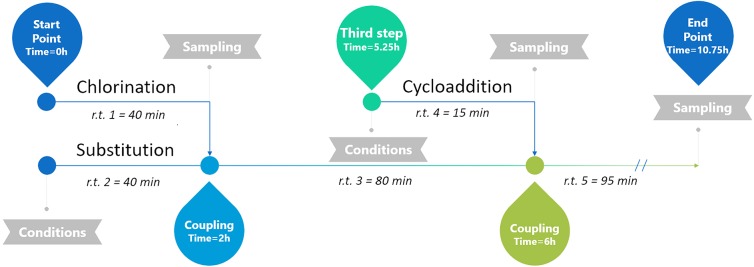
One of the main issues in multistep continuous manufacturing is the long startup timing. Here, the residence times were taken with reference from Borukhova et al.,44 and they were 40 min for the first (chlorination) and second (substitution) reactions and 15 min (cycloaddition) for the third reaction. Then, working in multistep and considering the criteria of three residence times in order to put the plant in production, the timing path is given in Figure 3. Yet, increasing the productivity cannot skip the startup times, because the optimal conditions were already tested on the lab scale, and it is difficult to improve them on a higher scale because of the issues described above. In this case, the time to set the miniplant into production is around 11 h.
Figure 3.
Timeline of starting up the miniplant.
Chemicals and Analytical Procedures
2,6-Difluorobenzyl alcohol (>99%) and 2,6-difluorobenzyl azide (>98%) were delivered by Ajinomoto OmniChem (Wetteren, Belgium) as industrial samples of production. Sodium azide (>99%) was purchased at VWR Netherlands, and MOA was purchased at Sigma-Aldrich. All chemicals were used as received. HCl and N2 gas were delivered by Linde.
For the chlorination step, the gas line was previously purged with dry nitrogen, setting the El-flow controller at 40 °C in order to remove all the moisture over 30 min. Later, HCl gas was pumped, setting the El-flow at room temperature. Then 2,6-difluorobenzyl alcohol was pumped (1 mL/min; 9 mmol/min) using the HPLC pump. Once the pressure was set to 2 bar and the G/L segmented flow was established, sampling operation (see Figure 3) was performed after three residence times along the oil bath set to the corresponding temperature using Supelco 7 mL Clear Vials with screw caps and PTFE liners. Each experiment was repeated at least three times for each set of conditions. For the second and third reaction steps, both sampling and analytical procedures were set accordingly.
The analysis was performed using GC-FID (Shimadzu 2010 Ultra) with a Shimadsu SH-Rtx-1 100% dimethyl polysiloxane column (30 m × 0.32 mm ID, 0.25 μm df, temp. range 330–350 °C) and benzyl chloride (Alfa Aesar) as an internal standard (IS). The ramp of temperatures was set starting at 80 °C for 2 min previous to an increase of 5 °C/min until 100 °C and later 25 °C/min until 185 °C, finishing with 5 °C/min until 200 °C and holding it for 2.6 min. The gas carrier was He at 289 kPa. The total flow was 55.5 mL/min, in the column being 2.5 mL/min due to a split ratio of 20. The injector was set to 250 °C (injection volume of 2 μL) and the detector at 260 °C.
Results and Discussion
Alcohol Chlorination
Experiments were performed keeping constant the optimal residence time stated in previous experiments on a lab scale.44 Therefore, a 40 min residence time was considered in all experiments and calculations for this step. All other reaction conditions were needed to be readjusted in order to counterbalance the losses in heat and mass transfer derived from the scaleup, e.g., an increase of the diameter by a factor of 3 brought the subsequent decrease of the internal forced convection within the liquid segments in the Taylor flow, and therefore the gas–liquid mass transfer interface was also reduced. In this connection, the temperature needed to be increased to enhance reactivity compared to the one used on the lab scale, because the flow-rate needed to be kept in order to synchronize all process steps according to the target productivity. The maximum temperature was set to 116 °C because of incompatibilities with the materials. The flow rate of both the HPLC pump for 2,6-difluorobenzyl alcohol (solvent free) and the El-Flow for the HCl gas were calculated accordingly. Under these conditions, the Reynolds number was kept laminar (Re = 35) with a Dean number of 3, in order to keep stable the gas–liquid segmented flow. The molar ratio between 2,6-difluorobenzyl alcohol and HCl was increased in order to enhance the mass transfer. The pressure was softly set to 2.5 bar since the pressure drop of the reactor was high enough to keep the segments stable, and the operation temperature was below the boiling point (bp = 188 °C). Figure 4 shows the yields of 2,6-difluorobenzyl chloride obtained with different excess ratios of HCl at different temperatures. It is observed that at 116 °C, an 86% yield of 2,6-difluorobenzyl chloride is obtained operating with a 1:2 molar ratio, the optimal (90%) being achieved with a 1:4 ratio. Then, it can be concluded that a ×3 tube diameter increase required ×1.67 of higher ratio excess and 5% higher temperature in order to achieve comparable yields on the lab scale. Nevertheless, under these scaled-up new conditions, the productivity was increased to 70.2 g/h, in front of the previous productivity of 9 g/h on the lab scale, which means an approximate increase factor of ×8. In can be concluded that the slight increase in energy and chemical demands in the scaleup operation is highly compensated by the increase in the productivity.
Figure 4.
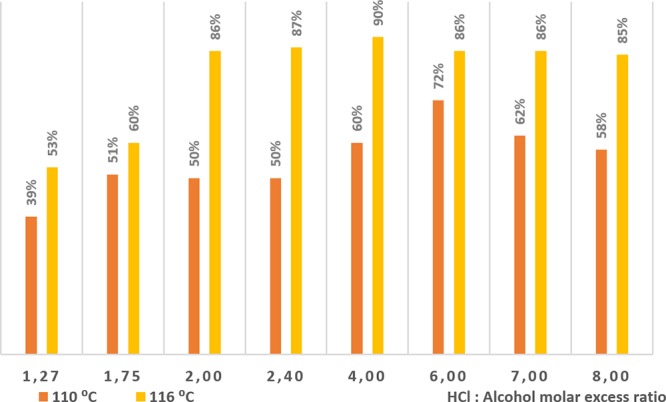
Yield of 2,6-difluorobenzyl chloride scaled-up in continuous flow.
Azide Substitution
For this step, the residence time conditions previously reported44 on the lab scale were also taken into account. Hence, a 40 min residence time was also considered, and all other conditions were tuned accordingly. In the way this step was performed in a liquid–liquid segmented flow, the strategy to approach the scale-up mass transfer issues was to use a stainless-steel made flow inverter (Figure 5). This approach already performed relevant mixing improvements in previous studies.47,48
Figure 5.
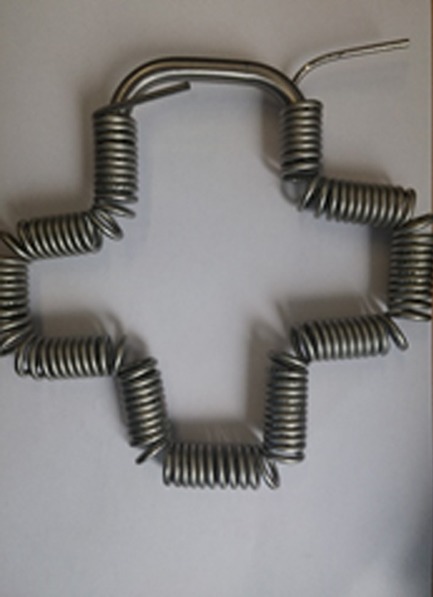
Example of steel inverter.
The setup was therefore tuned with the option to use the conventional coil, or the inverter. For both cases, the Re number resulted to be 89, and consequently there was a laminar flow. Nevertheless, the Dean number was different because the curls in the inverter had a smaller diameter, being 7 for the conventional coiled reactor and 14 for the inverter. In order to counterbalance the energy losses in the scale-up operation, three temperatures were tested, 160, 180, and 200 °C, and four excess ratios of NaN3 in front of 2,6-difluorobenzyl azide were also considered. Such high temperatures required operation above the boiling point of the chemicals, and therefore the pressure was set to 20 bar in order to ensure the avoidance of boiling. The maximum temperature was therefore set close to the decomposition limit of NaN3, which starts at 240 °C according to Pai-Verkener et al.49
Figure 6a shows the yield of 2,6-difluorobenzyl azide (RN3) at different temperatures at 20 bar using the conventional coiled reactor. Under these conditions, yields above 90% could only be obtained at high temperatures (200 °C) and high excess ratios (at least 1:2 RN3:NaN3). Nevertheless, the use of the inverter (Figure 6b) apparently improved the mass transfer, since at 200 °C, yields of 2,6-difluorobenzyl azide above 95% were obtained already operating with 1:1.2 RN3:NaN3 molar excess ratio. Also, using the inverter and a 1:1.6 RN3:NaN3 molar excess ratio, the yield of 2,6-difluorobenzyl azide resulted to be above 99%. The optimal (>90%) is achieved with a 1:2 ratio in a conventional coiled reactor, and with a 1:1.6 ratio by operating with the inverter. Under similar conditions, the use of the inverter brought the possibility to achieve an average of 10% extra yield in the measurements. Therefore, the inverter increased the mass transfer even in the scale-up operation, achieving the optimal excess ratio in the same range as on the lab scale. From an energetic point of view, the ×3 diameter scale-up brought the need to increase the temperature up to 200 °C to achieve comparable results comared to lab-scale results, but with higher productivity, which was in this case 78 g/h, in front of the productivity on the lab scale of 8.4 g/h, meaning for this step ×9 higher productivity. The cumulative yield obtained by coupling both steps was therefore around 90% with a productivity of 70 g/h, equivalent to approximately 8.5 times higher than the productivity on the lab scale.
Figure 6.
Yield of 2,6-difluorobenzyl azide with liquid–liquid continuous segmented flow. (a) Using a conventional coiled steel reactor. (b) Using a stainless-steel flow inverter.
Cycloaddition
This step is the only one performed in just one phase, since the 2,6-difluorobenzyl azide (RN3) was used as obtained in the previous step with fully miscible methyl trans-3-methoxyacrylate (MOA) as a dipolarophile. That is because in this step the scale-up challenge was approached by an internal numbering-up. The target therefore was to split the flow into six subchannels and make the reactor shorter for the same residence time. With this strategy, a reduction of energy and mass transfer losses was expected. For this purpose, a stacked multichannel reactor (SMCR) provided by Kobe Steel Ltd. was specially designed and used. Since the reaction needed to be carried out at 54 bar pressure, stainless steel was used from HPLC pumps to the back-pressure regulator.
In this study, three variables were taken into account: residence time considering five levels (5, 10, 15, 20, 40 min), reaction temperature with three levels (130, 160, 175 °C), and the molar excess ratio RN3:MOA (1:1.5, 1:1.75, and 1:2). Figure 7a shows the kinetics of the Huisgen cycloaddition operating with a 1.5 MOA molar excess ratio. This comparison shows the logarithmic tendency of the reaction yield of the rufinamide precursor (methyl 1-(2,6-difluorobenzyl)-1H-1,2,3-triazole-4-carboxylate). This tendency is confirmed in Figure 7b, which shows all comparative results operating at 160 and 175 °C. This suggests a first order kinetic reaction. In addition, in both plots the expected yield increase with both temperature and MOA molar excess ratio can be observed.
Figure 7.
Yield of rufinamide precursor in scale-up kinetic study of Huisgen cycloaddition: (a) Operating with 1.5 molar excess ratio of MOA. (b) Comparative results with different molar excess ratios at 160 and 175 °C.
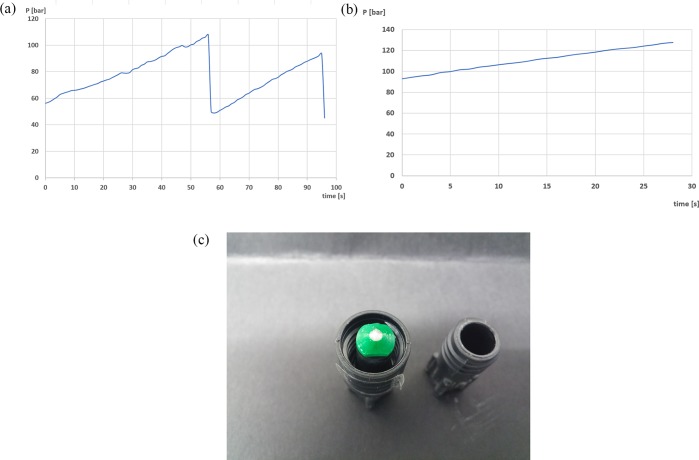
Nevertheless two technological issues were detected especially because of operating solvent free. The first: Particularly when operating with compounds which keep solid at high temperature, the clogging risk is very high, especially in the cooler after the reactor and before the BPR. That is because a supplementary study of the clogging dynamics on the microchannel level was performed. In this case, the critical part was the constriction in the BPR, which brought the section from 1.56 mm ID to 0.75 mm ID. This can result in the formation of an arch of particles across the width of the constriction in the first instance, and later around the channel where the high particle concentrations generate structures which can span over the full section.50 It is described in the literature that this kind of bridging blockage is often intermittent and can generate flow fluctuations.51 In this context, in order to confirm the type of clogging, the pressure of the reactor was monitored obtaining sequential profiles, as shown in Figure 8a. The sequential change in the pressure led as well to a local unstable flow rate, depending on the particle concentration. Once the full clogging was achieved, the pressure increased linearly up to the safety upper pressure limit of the setup, as shown in Figure 8b. As observed in Figure 8a, the pressure cycles were approximately 1 min long, which can be explained due to the intermittent jamming, and the final clogging was generated in half of a minute. This type of clogging occurred because of the large number of particles in the system which could not pass the bottleneck. Such a type of intermittent clogs could be avoided by including perturbations in the flow or by the addition of other exerted forces in other directions in order to unjam the fragile arch structures in this stage. According to Dressaire and Sauret, this could develop self-lubricating flow geometries, avoiding clogging (Figure 8c).52
Figure 8.
(a) Example of the fluctuations of the pressure obtained in the cycloaddition step. (b) Pressure evolution during clogging. (c) Final result of clogging of rufinamide precursor at the end of the BPR.
In this scenario, only experiments with process stability were evaluated as feasible. Therefore, a decrease in the final yield was assumed, since higher yields were correlated with more solids and with the subsequent instability of the reaction module, and by extension of the miniplant. In this connection, Figure 9 shows the same results obtained in Figure 7, but with the clogging limit line in red. This line means a limit of stability of the miniplant in this step, referring to the experiments where it was possible to keep the plant under production. Above the red line, the slow accumulation of solids with time brought general clogging of the reactor after less than an hour of production. Another alternative to overcome this issue would be a reduction of the cooler in order to increase the temperature in the BPR or directly submerge the BPR in a 210 °C bath. Nevertheless, this would require another kind of high temperature resistant BPR.
Figure 9.
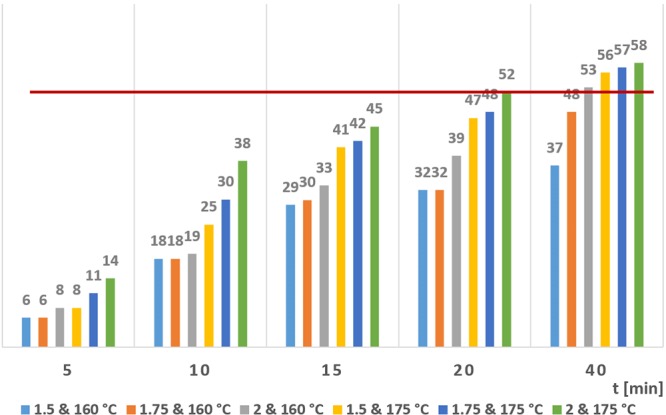
Huisgen cycloaddition reaction yield (%) with the stability limit detected (red line). The values above this limit showed stability issues with time. Experiments performed at 160 and 175 °C using 1.5, 1.75, and 2 molar excess ratios of MOA.
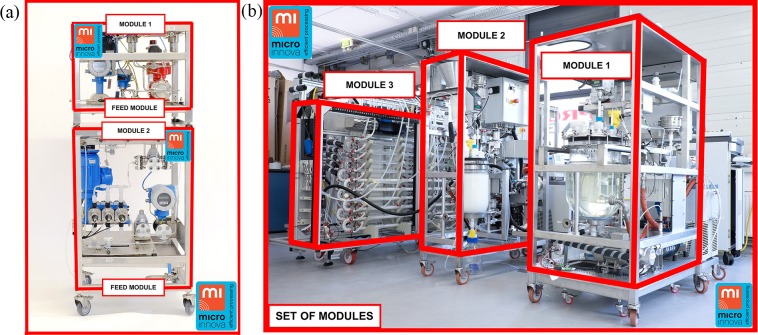
The second issue was the extreme heat losses of the steel reactor. On one hand, steel was needed in order to operate at high pressure and high temperature, but on the other hand, the steel reactor had very high heat losses, even with a glass-wool isolation like the one shown in Figure 2. This could be improved by using expensive ceramic isolation. Therefore, we conclude that when operating with steel reactors, either they should be fully submerged in order to keep constant the temperature and control the heat losses (with the subsequent volume bath/oven issue) or the flow of the heating oil should be high enough to counterbalance the heat losses. For the latter, an expensive external high-T and high-speed pump should be coupled. In this context, operating with pilot scale miniplants with shortened (smaller) reactors (internal numbering-up) can contribute to make this much simpler, less energy demanding, and more safe.
In summary, the scale-up operation of this step reported the difficulty of keeping high temperatures in steel reactors (up to 175 °C) and the clogging risks when operating solvent free with compounds with high melting points. These matters limited the optimal conditions. Therefore, under production, the pilot scale miniplant gave a reaction yield of 52% of the rufinamide precursor in this last step, using a 1:2.00 MOA excess ratio with a residence time of 20 min operating at 175 °C. In terms of productivity, this step reached 40.5 g/h, in front of the productivity in the lab scale of 8 g/h, which means ×5 the productivity of the lab scale.
Economic Study and Business View of the Solvent-Less Plant
Profit margins and competitiveness are crucial to any business. Flow processes would compete against batch processes and potentially fully devaluated equipment units. In other words, flow processes would represent a new capital investment as opposed to already on-site equipment units. The profitability of a project can be determined by different methods. The payback period (PBP) was selected as a preliminary analysis for this case study due to its simplicity.
Therefore, PBP was determined using eq 1.53
| 1 |
where ANCI was the net annual cash income and CTC was the initial capital investment. In this study, ANCI was equal to the cost savings generated by shifting to continuous manufacturing. ANCI was determined using eq 2,53 where ACS was the annual cost savings, t was the tax rate, and ABD was the balance sheet depreciation. PBP could also be determined by looking at the cumulative net cash flow.
| 2 |
The cost savings generated by implementing flow processes could come from different sources as seen in Figure 10.
Figure 10.
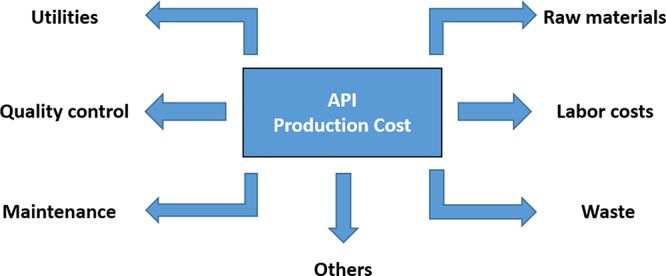
API: production costs.54
PBP Determination
Some estimations were needed to be assumed in order to estimate the PBP, taking the worst-case scenario in a first stage. Hence, it was assumed that cost savings for the production of rufinamide come only from raw materials (RM) and all other costs remain invariable. As mentioned before, the flow process hereby described is solvent-less (solvent recovery is not needed, henceforth energy requirements are lower), and it reduces the amount of waste produced. In addition, some of the benefits of working in-flow are increased automation and monitoring capabilities, which reduce labor costs. Additionally, automation reduces human intervention and therefore human error during production.55,56 This type of analogy focuses on the main cost contributor in the pharma industry.55 Moreover, in a different scenario, the potential savings due to labor costs were estimated. The impact of having additional operators, where the yearly cost of each was assumed to be equal to $60 000, was also evaluated. In addition, access to commercial scale prices of bulk raw materials requires discussions with suppliers, which might not be possible at early stages of a project or for academic purposes. Therefore, bulk raw materials costs were determined with the equation developed by Hart, as seen in eq 3,57 where PB is the price of the bulk product, Pl is the price on the lab scale converted to kilograms, Ql represents the amount of grams on the lab scale, and QB is a constant equal to 60 lb.
| 3 |
This equation is not recommended for large-volume products such as sodium hydroxide. Henceforth, in some cases, prices from Alibaba were used. Even though eq 3 was developed 22 years ago, it represents a more appropriate approximation than the usual rule of thumb of dividing the lab process by a factor of 10. Additionally, this equation has been recently used in the literature.58
In this context, the dimension of the continuous and modular plant was assumed to be of a total capacity of 10 ton/year of rufinamide with a useful life of 10 years. Similar types of plants have been built at MIC in the past (see Figure 11 as an example). These types of plants are capable of working in GMP and ATEX environments. The plant would consist of different modules or sections such as feed and reaction modules. Therefore, several scenarios were evaluated considering the uncertainty of the cost savings and the cost of the plant at early stages. The scenarios which were evaluated are CAPEX (capital expenditure) equal to $500 000, $1 000 000, $1 500 000 and $2 000 000. Other details were also considered, such as the straight-line depreciation and a salvage cost equal to $0, a tax rate equal to 32%, and the interest rate for this analysis, which was considered equal to 0%.
Figure 11.
(a) Feed modules.60 (b) Crystallization modules: installed at CMAC.60
Considering the synthetic route which was used as a “benchmark,” this was the one-single vessel reaction using methyl propiolate. This scenario is closer to the first assumption regarding labor costs (although, the starting point of the reaction is different). Then even if the benchmark is modified, the business driver will most likely come from the cost savings generated from the raw materials.44 In other cases, alternative raw materials (cheaper than methyl propiolate) have been reported in batch but with several isolation steps of the intermediates. These additional isolation steps require extra chemicals and storage capacity.
Shortcomings in the Cost Analysis and Correction for That
Making cost assumptions based on pilot plant trials with a disruptive technology, which has hardly been assessed before, inevitably has shortcomings, and there is a need for proper correction of that.
Cleaning/Start-up/Regulatory/Labor Models
The PBP is a first estimation to assess the potential benefits of the continuous plant. There are shortcomings in the economic analysis we have made. Making cost analyses for disruptive industrial scenarios (rather than optimized conventional ones) is a delicate issue and has limitations in the precision of the absolute data. The goal needs to be to give an approximate, honest order-of-magnitude answer. One shortcoming concerns the consideration of cleaning and product losses during start-up. Those would likely be relevant for a modular plant that works 5 days per week (changing campaigns). Our flow plant approach rather is based to run in uninterrupted production at much longer periods, approaching the concept of a dedicated plant. As an alternative start-up procedure, only cheap, “placebo” materials might be used, such as common solvents and nitrogen/air as a gas.
Another shortcoming concerns market/regulatory approval. It is practically impossible to judge on those costs based on the pilot plants results. In a preliminary analysis with our industrial partner MicroInnova Engineering GmbH, solid arguments were identified for lower ATEX/GMP/UL/CE requirements, which finally are relevant for the regulatory approval. These points might lower the regulatory costs. A third and last shortcoming refers to changing labor models. We assume that automation will reduce the cost and need of additional operators.
Being unable to judge those costs individually, and precisely, we assumed these to be 10% of our total costs (including cleaning, regulatory, and labor), and they were added to the total cost bill.
Recycling to Achieve Higher Yield
It is assumed that the overall yield of the process can be raised toward ∼80%, once the third step is optimized. Yet, with the current equipment units, the overall yield is around 50%, mainly because of the third step. It has to be pointed out that all selectivities are very high. Thus, the point to consider for the third-step optimization is (the low) conversion, and recycling is one prime option to solve it. The final reaction solution essentially contains only 2,6-difluorobenzyl azide, methyl 3-methoxyacrylate, and the rufinamide precursor. Crystallization of the latter yields a very pure product, which also means that a relatively pure reactant (“waste”) stream can be recycled.
It is difficult to find a proper industrial reference for such costs. As an example, Evonik recycles a homogeneous catalyst for a 35t/h specialty chemistry plant through membrane operation with assorted costs about 500 000 Euro per year (assuming 10 years operation).59 Yet in our paper, much less throughput and a smaller scale equipment plant is given. In view of that difference, a $70 000/year investment was assumed as the proper entry for ROI calculation (including energy and maintenance costs; $700 000 total costs; 10 year use). Yet, unreacted material is utilized that way, and that benefit has to be taken into account. Considering 80% yield as stated above, the amount of RM to be recycled is 20% of the whole reactant feed. That amounts to a $13 000/year contribution so that $57 000/year was fed into the ROI calculation as additional cost.
Bulk-Scale Provision of Raw Materials
It also has to be considered that yearly raw material requirements of the batch process were based on data reported on patents. These patents in most cases only provide small scale experiments and little is said about yields at larger scales.
On the basis of the previous assumptions, the bulk price of the raw materials was estimated, where applicable. Lab scale prices were taken from Sigma-Aldrich, and eq 3 was applied. The results can be seen in Table 1.
Table 1. Bulk Price Determination Based on Lab Prices.
| compound | cost laba | quantity (g) | lab price (EUR/kg) | bulk price (EUR/kg) |
|---|---|---|---|---|
| 2,6 difluorobenzyl alcohol | 104 | 5 | 20 800 | 33 |
| hydrogen chloride (gas) | 2500 | 25 000 | 100 | 94 |
| sodium azide | 498 | 25 000 | 20 | 19 |
| methyl trans 3 methoxyacryate | 76.5 | 108 | 708 | 11 |
| methyl propiolate | 270 | 50 | 5400 | 48 |
| 2,6-difluorobenzyl bromide | 257 | 25 | 10 280 | 54 |
Sigma-Aldrich.
Results of the Cost Analysis
Afterward, the mass balances of the continuous/flow plant and batch plant were determined, and the yearly costs were estimated. These values are seen in Tables 2 and 3. The mass balance for the continuous plant used the following factors and yields: the ratio of HCl:2,6-difluorobenzyl alcohol was 2 and the yield 90%; the ratio of NaN3:2,6-difluorobenzyl chloride was 1.6 and yield 99.4%; and the ratio of methyl trans-3-methoxyacryate:2,6-difluorobenzyl azide was 1.5 and yield 90%.
Table 2. Yearly Raw Materials Costs: Flow Plant.
| compound | lab scale (g/h) | mass (ton/y) | cost (EUR/kg) | EUR to $ | cost (k$/ton) | cost (k$/year)a |
|---|---|---|---|---|---|---|
| 2,6-difluobenzyl alcohol | 78 | 7.5 | 33 | 1.14 | 38 | 280 |
| HCl (gas) | 24 | 4.0 | 94 | 1.14 | 107 | 427 |
| methyl trans-3-methoxyacryate | 87 | 8.0 | 11 | 1.14 | 13 | 102 |
| methanol | 28 | 2.5 | 1.3a | 8 | ||
| sodium hydroxide | 6 | 0.1 | 1a | 1 | ||
| NaN3 | 56 | 5.0 | 19 | 1.14 | 21 | 106 |
Alibaba.
Table 3. Yearly Raw Materials Costs: Batch Plant (One Reaction Vessel).
| compound | mass (ton/y) | cost (kEUR/ton) | EUR to $ | cost ($/ton) | cost (k$/y) |
|---|---|---|---|---|---|
| 2,6-difluorobenzyl chloride | 16 | 54 | 1.14 | 62 | 992 |
| sodium azide | 5 | 19 | 1.14 | 22 | 110 |
| methyl propiolate | 6 | 48 | 1.14 | 55 | 330 |
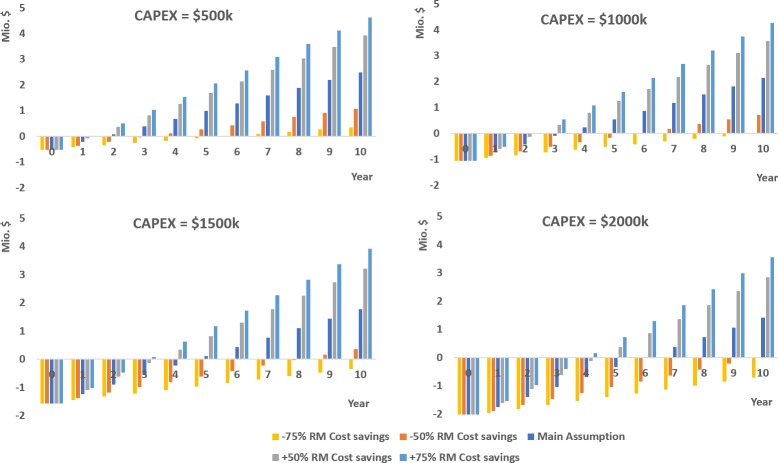
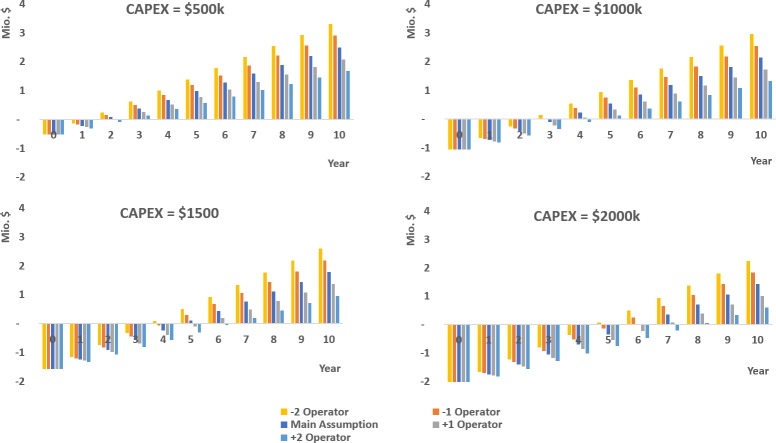
On the basis of the previous information, the cumulative cash flow was determined for the different case scenarios. In Figure 12, the effect of the cost savings and the different investment scenarios on the cumulative cash flow were estimated. As seen in Figure 12, the cost savings from the raw materials have the biggest impact on the cumulative cash flow and therefore on the profitability of the project. In Figure 13, the effect of additional and less manpower was evaluated. In these scenarios, manpower can have an additional effect on the profitability of the project, but it is not as critical as the cost savings from raw materials.
Figure 12.
Cumulative cash flow: Different CAPEX and cost savings from raw materials (RM), the latter as defined in the legend.
Figure 13.
Cumulative cash flow: Different CAPEX with different operator scenarios, the latter as defined in the legend.
Additionally, the PBP was determined for the cases under evaluation as seen in Figures 14 and 15. Under the main assumption, the PBP was below 3 years in the best scenario (CAPEX = $500 000). It is worth it to see that according to the results the cumulated cash flow in 10 years could be slightly above $4.6 million with an investment (CAPEX) of $500 000 (+75% RM cost savings) in the most optimistic scenario (lowest investment maximum cash flow), and above −$716 000 losses with an investment of $2 000 000 (−75% RM cost savings) in the most pessimistic (highest investment, minimum cash flow). In the main assumption, all cases would be positive with cash flow between $2.49 million and $1.42 million in 10 years. By including the recycling operation, the most realistic scenarios would be the most favorable.
Figure 14.
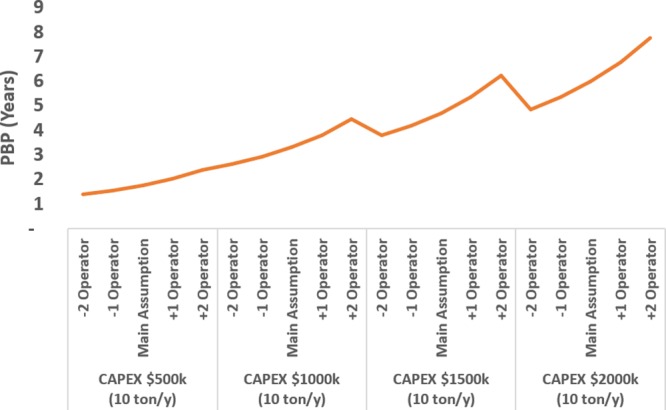
PBP determination under the main assumption.
Figure 15.
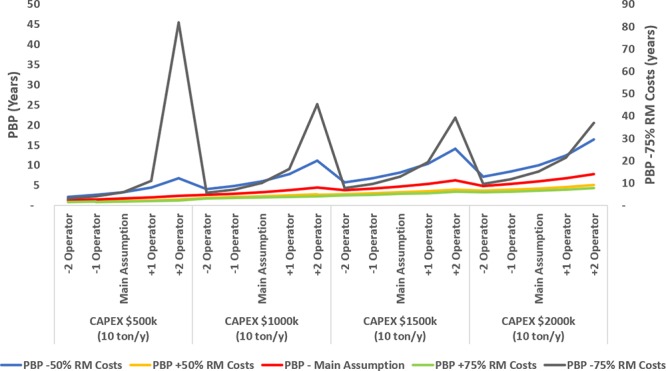
PBP determination varying cost savings from raw materials.
As seen in Figure 15, if cost savings from raw materials are reduced by 50%, the number of operators and CAPEX become critical. If CAPEX is higher than 2 000 000, it would increase the PBP above 7.5 years. If cost savings are below 75%, the impact on the profitability of the project is more significant, and in most cases the project would not be profitable.
On the basis of the previous analysis, it is clear that the key factor is the price of the raw materials. Also, the pilot requires >99% less water, which contributes to the sustainability of the process. Assuming $20/m3 for the cost of the wastewater treatment, the cost savings of the plant would be above $35 000/year if performed on-site, $43/year if performed off-site. No other additional costs in this context would be expected since the pilot operates basically solvent-free.
In contrast, the impact of the uncertainty of the capital costs is much lower. The variation of the number of operators does not drastically impact the PBP. A good estimation of the PBP for the construction of the pilot would be below 3 years depending on the CAPEX, with a cash flow higher than $2 million, under the main assumption.
Furthermore, each manufacturing site could have a different implemented process for the synthesis of rufinamide; the business driver might be different. For instance, in a batch multistep process, with several isolation steps, the impact of the labor costs will be more significant. The isolation steps could also lead to high inventory costs of the intermediate products. As an illustration, a batch campaign can take up to one year in the pharma industry.61
Outlook: A Possible Business Strategy
In this paper, a transfer of the engineering perspective from smart solvent-free microcapillaries to suitable, commercially and pilot robust continuous equipment is proposed. Here, besides a fundamental identification of competitors and a possible intellectual protection, a development of an optimal strategy for selecting potential business partners and setting up commercial agreements is very relevant. Figure 16 shows the relation between the existing and the proposed business solutions for a business plan. In this case, in a first stage, it consisted of the User Club that promoted innovation in flow chemistry, by bringing together representatives of different stakeholders (e.g., reactor manufacturers and pharmaceutical industries). Key to the user club was its extensive array of information, tools, and resources that could help to develop new skills and new technology and thereby realize the full potential of flow chemistry.
Figure 16.
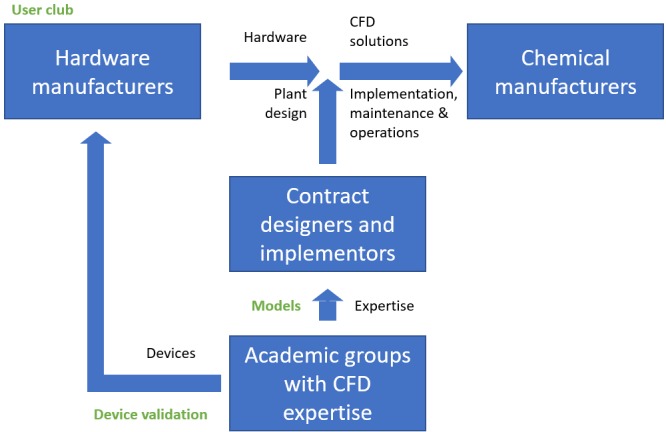
Overview of existing (black) and new (green) business propositions (CFD refers to Contracts for Difference).
In a second stage, the business plan would include, once the User Club is fully scaled up, a setup of a company that would help other companies introduce or optimize flow chemistry processes. In this business case, the newly developed company would take a center role in driving the adoption and implementation of flow chemistry. In parallel (third case), a not-for-profit organization would validate the standardized implementation of flow chemistry in industry. As a fourth step, the new company should cover the identified need in the flow chemistry market, of novel proof windows, including solvent-free processing. Such technology has several advantages over the state-of-the-art: lower volumes needed, leading to smaller (therefore cheaper) equipment that must be used, energy savings, and faster switching times. The pilot here described represents a disruptive improvement which holds tremendous potential for commercialization. Market insights revealed that the total attainable market (TAM) for our platform is estimated at 300 platforms worldwide. This estimation is based on the number of companies that are active in drug and specialty chemical manufacturing, assuming two platforms per company. In addition to the equipment, revenue could be boosted through the commercialization of consumables or services. The summary of the business scenarios studied for the commercialization of the pilot described in this paper is given in Table 4.
Table 4. Summary of the Business Opportunities of the Pilot (SLA, Service-Level Agreement; USP, Unique Selling Proposition).
| business opportunity | proposition | target group(s) | earnings model | USPs |
|---|---|---|---|---|
| user club | connecting all stakeholders for precommercial collaboration, inspiration and education on CFD scale up | all relevant stakeholders | subscription fee | world-leading know-how, multistakeholder network, neutral position |
| implementation service | model-driven design and implementation of CFD solutions for complex chemical reactions | chemical manufacturers | consultancy services, complemented with optional maintenance and troubleshooting SLAs | world-leading know-how on complex reactions in flow chemistry |
| validation service (quality label) | third-party validation of CFD hardware in terms of robustness, scalability. | hardware manufactures | validation fees, audit fees, (annual) labeling fee | world-leading know-how, neutral position |
| computational models | the most advanced computational (and fully standardized) models for CFD design (with focus on complex reactions) | designers and implementors | license fee | world-leading know-how, fully standardized, readily applicable in any situation |
Conclusions
A pilot-scale 3 m2 multistep solvent-free miniplant was built and tested for the synthesis of the rufinamide precursor. Three steps were considered, all of them operating with a different pattern such as G/L Taylor-flow, L/L segmented flow, and homogeneous high-p,T. Different strategies were checked in order to counterbalance the mass and heat transfer losses derived from the scale-out of the diameter by a factor of 3. In the case of the first chlorination step, the higher expenses in both energy (5% higher) and chemicals (a factor of ×1.67%) was highly compensated by a productivity of 70.2 g/h (×8 higher) achieving a 90% yield of 2,6-difluorobenzyl chloride. Concerning the second step, the use of the inverter gave 10% extra yield, which allowed the reaction to deliver yields above 90% with the same chemical expenses, and just increasing the temperature 25%. Under these conditions, 78 g/h productivity was achieved, which means a factor ×8.5 improvement with respect of the previous lab-scale. For the third step, internal numbering-up was used as a scaling-up strategy using a Kobe steel Ltd. SMCR reactor. In this step, some scaling-up issues were found derived of the solvent-free operation: (i) high heat losses derived from the use of steel reactors, which would require them to be fully submerged in an oil bath, making more relevant the need to reduce the volume of the whole reactor, and (ii) the clogging risk when operating solvent-free with chemicals with a high melting point. Under stable conditions, this cycloaddition step gave 52% rufinamide precursor with a factor of 2 of excess of MOA but with a 17% lower temperature, equivalent to a productivity of 40.5 g/h, 5 times higher than in the lab-scale. This third step was shown as the bottleneck of the whole process because of the technological issues. In overall, the miniplant productivity brought a cumulative three cascaded reactions yield of 47% of the rufinamide precursor with a productivity of 47 g/h, which means a factor of 7, the increase referring to the lab scale. The productivity could be increased, also increasing the flow rate in all systems, which would require an extension of the reactor tubing accordingly.
As an outlook, the paper includes an economic feasibility study of the miniplant. The major cost share is raw materials, while the cost of the plant has lower contribution. An estimative payback period for the construction of the pilot miniplant is below 3 years. Furthermore, in the most favorable scenario studied (CAPEX = $500 000 with +75% raw materials cost savings), the cumulated cash flow in 10 years could be slightly above $4.6 million. In this context, four business development scenarios were sketched to pave the way of such disruptive technology toward commercialization.
Acknowledgments
This project was funded by an ERC-Proof-of-Concept grant awarded under grant agreement no. 780765. This research was carried out at Eindhoven University of Technology, Micro Flow Chemistry and Process Technology, Department of Chemical Engineering and Chemistry, P.O. Box 513, 5600 MB Eindhoven, The Netherlands. The authors gratefully acknowledge the facilities provided by MicroInnova GmbH, Dr. Bert Metten (Ajinomoto Omnichem), and Mr. Jasper Levink (ttopstart consulting) as well as Kolbe Steel Ltd. for borrowing their SMCR reactor. MicroInnova acknowledges support for the economic study through funding from the European Union’s Horizon 2020 Research and Innovation program by the Marie Sklodowska-Curie grant agreement no. 721290. The authors also acknowledge companies and members of the User Club of this project for the commercial guidance. Besides the above-mentioned, Dr. Carsten Damerau (HNP Mikrosysteme GmbH), Dr. Conchita Jimenez Gonzalez (GlaxoSmithKline - GSK), Dr. Charlotte Wiles (Chemtrix BV), Dr. Peter Poechlauer (Patheon, part of Thermo Fisher Scientific), Dr. Noishiki Koji (Kobelco - Kobe Steel LTD), and Mrs. Alessandra Vizza (Corning SAS) are thanked.
The authors declare no competing financial interest.
References
- ASTM E2968, Standard Guide for Application of Continuous Processing in the Pharmaceutical Industry; American Society for Testing and Materials: West Conshohocken, PA, 2015. [Google Scholar]
- Jimenez-Gonzalez C.; Poechlauer P.; Broxterman Q. B.; Yang B.-S.; am Ende D.; Baird J.; Bertsch C.; Hannah R. E.; Dell’Orco P.; Noorman H.; Yee S.; Reintjens R.; Wells A.; Massonneau V.; Manley J. Key Green Engineering Research Areas for Sustainable Manufacturing: A Perspective from Pharmaceutical and Fine Chemicals Manufacturers. Org. Process Res. Dev. 2011, 15, 900–911. 10.1021/op100327d. [DOI] [Google Scholar]
- Rogers L.; Jensen K. F. Continuous manufacturing – the Green Chemistry promise?. Green Chem. 2019, 21, 3481–3498. 10.1039/C9GC00773C. [DOI] [Google Scholar]
- DiMasi J. A.; Hansen R. W.; Grabowski H. G. The price of innovation: new estimates of drug development costs. J. Health Econ. 2003, 22, 151–185. 10.1016/S0167-6296(02)00126-1. [DOI] [PubMed] [Google Scholar]
- Escribà M.; Hessel V.; Rothstock S.; Eras J.; Canela R.; Löb P. Applying a continuous capillary-based process to the synthesis of 3-chloro-2-hydroxypropyl pivaloate. Green Chem. 2011, 13, 1799–1805. 10.1039/c0gc00655f. [DOI] [Google Scholar]
- Hessel V.; Kralisch D.; Kockmann N.. Novel Process Windows: Innovative Gates to Intensified and Sustainable Chemical Processes; Wiley-VCH Verlag GmbH & Co. KgaA: Weinheim, Germany, 2015. [Google Scholar]
- Modernising the supply chain using continuous manufacturing. https://www.europeanpharmaceuticalreview.com/article/69358/modernising-continuous-manufacturing/ (access August 2019).
- New FDA Guideline: Quality Aspects for Continuous Manufacturing. https://www.gmp-compliance.org/gmp-news/new-fda-guideline-quality-aspects-for-continuous-manufacturing (accessed August 2019).
- Quality Considerations for Continuous Manufacturing, Guidance for Industry. https://www.fda.gov/media/121314/download (accessed August 2019).
- Quality Considerations for Continuous Manufacturing. https://www.fda.gov/regulatory-information/search-fda-guidance-documents/quality-considerations-continuous-manufacturing (accessed August 2019).
- Continuous manufacturing in pharmaceuticals: Economic and policy issues. https://www.bateswhite.com/media/publication/171_Continuous%20Manufacturing.pdf (accessed August 2019).
- Outlook on pharma operations. https://www.mckinsey.com/~/media/mckinsey/dotcom/client_service/operations/pdfs/outlook_on_pharma_operations.ashx (accessed May 2019).
- Continuous drug manufacturing offers speed, lower costs. http://newsoffice.mit.edu/2012/manufacturing-pharmaceuticals-0312 (accessed May 2019).
- Roberge D. M.; Zimmermann B.; Rainone F.; Gottsponer M.; Eyholzer M.; Kockmann N. Microreactor Technology and Continuous Processes in the Fine Chemical and Pharmaceutical Industry: Is the Revolution Underway?. Org. Process Res. Dev. 2008, 12 (5), 905–910. 10.1021/op8001273. [DOI] [Google Scholar]
- Britton J.; Jamison T. F. The assembly and use of continuous flow systems for chemical synthesis. Nat. Protoc. 2017, 12, 2423–2446. 10.1038/nprot.2017.102. [DOI] [PubMed] [Google Scholar]
- Poechlauer P.; Manley J.; Broxterman R.; Gregertsen B.; Ridemark M. Continuous processing in the manufacture of active pharmaceutical ingredients and finished dosage forms: An industry perspective. Org. Process Res. Dev. 2012, 16, 1586–1590. 10.1021/op300159y. [DOI] [Google Scholar]
- Al-Rawashdeh M.; Yu F.; Nijhuis T. A.; Rebrov E. V.; Hessel V.; Schouten J. C. Numbered--up gas--liquid micro-/milli channels reactor with modular flow distributor. Chem. Eng. J. 2012, 207-208, 645–655. 10.1016/j.cej.2012.07.028. [DOI] [Google Scholar]
- Santana H. S.; Tortola D. S.; Silva J. L.; Taranto O. P. Biodiesel synthesis in micromixer with static elements. Energy Convers. Manage. 2017, 141b, 28–39. 10.1016/j.enconman.2016.03.089. [DOI] [Google Scholar]
- Su Y.; Straathof N. J. W.; Hessel V.; Noël T. Photochemical Transformations Accelerated in Continuous-Flow Reactors: Basic Concepts and Applications. Chem. - Eur. J. 2014, 20, 10562–10589. 10.1002/chem.201400283. [DOI] [PubMed] [Google Scholar]
- Guan G.; Teshima M.; Sato C.; Mo Son S.; Faisal Irfan M.; Kusakabe K.; Ikeda N.; Lin T.-J. Two-phase flow behavior in microtube reactors during biodiesel production from waste cooking oil. AIChE J. 2009, 56 (5), 1383–1390. 10.1002/aic.12042. [DOI] [Google Scholar]
- Sun J.; Ju J.; Ji L.; Zhang L.; Xu N. Synthesis of Biodiesel in Capillary Microreactors. Ind. Eng. Chem. Res. 2008, 47, 1398–1403. 10.1021/ie070295q. [DOI] [Google Scholar]
- Elvira K. S.; i Solvas X. C.; Wootton R. C. R.; deMello A. J. The past, present and potential for microfluidic reactor technology in chemical synthesis. Nat. Chem. 2013, 5, 905–915. 10.1038/nchem.1753. [DOI] [PubMed] [Google Scholar]
- Kopach M. E.; Singh U. K.; Kobierski M. E.; Trankle W. G.; Murray M. M.; Pietz M. A.; Forst M. B.; Stephenson G. A.; Mancuso V.; Giard T.; Vanmarsenille M.; DeFrance T. Practical Synthesis of Chiral 2-Morpholine: (4-Benzylmorpholin-2-(S)-yl)-(tetrahydropyran-4-yl)methanone Mesylate, a Useful Pharmaceutical Intermediate. Org. Process Res. Dev. 2009, 13 (2), 209–224. 10.1021/op800247w. [DOI] [Google Scholar]
- Brechtelsbauer C.; Ricard F. Reaction Engineering Evaluation and Utilization of Static Mixer Technology for the Synthesis of Pharmaceuticals. Org. Process Res. Dev. 2001, 5 (6), 646–651. 10.1021/op010056t. [DOI] [Google Scholar]
- Mascia S.; Heider P. L.; Zhang H.; Lakerveld R.; Benyahia B.; Barton P. I.; Braatz R. D.; Cooney C. L.; Evans J. M. B.; Jamison T. F.; Jensen K. F.; Myerson A. S.; Trout B. L. End--to--end continuous manufacturing of pharmaceuticals: integrated synthesis, purification, and final dosage formation. Angew. Chem., Int. Ed. 2013, 52 (47), 12359–12363. 10.1002/anie.201305429. [DOI] [PubMed] [Google Scholar]
- Lévesque F.; Seeberger P. H. Continuous--flow synthesis of the anti--malaria drug artemisinin. Angew. Chem., Int. Ed. 2012, 51 (7), 1706–1709. 10.1002/anie.201107446. [DOI] [PubMed] [Google Scholar]
- Kopetzki D.; Lévesque F.; Seeberger P. H. A Continuous-Flow Process for the Synthesis of Artemisinin. Chem. - Eur. J. 2013, 19 (17), 5450–5456. 10.1002/chem.201204558. [DOI] [PubMed] [Google Scholar]
- Snead D. R.; Jamison T. F. A. Three-Minute Synthesis and Purification of Ibuprofen: Pushing the Limits of Continuous-Flow Processing. Angew. Chem., Int. Ed. 2015, 54 (3), 983–987. 10.1002/anie.201409093. [DOI] [PubMed] [Google Scholar]
- Borukhova S.; Noël T.; Metten B.; de Vos E.; Hessel V. From alcohol to 1,-2,-3--triazole via a multi--step continuous--flow synthesis of a rufinamide precursor. Green Chem. 2016, 18, 4947–4953. 10.1039/C6GC01133K. [DOI] [Google Scholar]
- Neurological Disorders: Public Health Challenges; World Health Organization: Geneva, 2006. [Google Scholar]
- Newton C. R.; Garcia H. H. Epilepsy in poor regions of the world. Lancet 2012, 380, 1193–1201. 10.1016/S0140-6736(12)61381-6. [DOI] [PubMed] [Google Scholar]
- Cowen P. J.; Green A. R.; Nutt D. J.; Martin I. L. Ethyl β-carboline carboxylate lowers seizure threshold and antagonizes flurazepam-induced sedation in rats. Nature 1981, 290, 54–55. 10.1038/290054a0. [DOI] [PubMed] [Google Scholar]
- Rogawski M. A.; Löscher W. The neurobiology of antiepileptic drugs. Nat. Rev. Neurosci. 2004, 5, 553–564. 10.1038/nrn1430. [DOI] [PubMed] [Google Scholar]
- Gureje O.; Chisholm D.; Kola L. Cost-effectiveness of an essential mental health intervention package in Nigeria. World Psychiatry 2007, 6, 42–48. [PMC free article] [PubMed] [Google Scholar]
- Hakimian S.; Cheng-Hakimian A.; Anderson G. D.; Miller J. W. Rufinamide: a new anti-epileptic medication. Expert Opin. Pharmacother. 2007, 8, 1931–1940. 10.1517/14656566.8.12.1931. [DOI] [PubMed] [Google Scholar]
- Wheless J. W.; Vazquez B. Rufinamide: A Novel Broad-Spectrum Antiepileptic Drug. Epilepsy Curr. 2010, 10, 1–6. 10.1111/j.1535-7511.2009.01336.x. [DOI] [PMC free article] [PubMed] [Google Scholar]
- Banzel / Inovelon (Epilepsy) – Forecast and Market Analysis to 2022. http://www.marketresearch.com/product/sample-7406653.pdf (accessed on May 2019).
- Meier R.US4789680A, 1988.
- Padmaja R. D.; Chanda K. A short review on synthetic advances toward the synthesis of rufinamide, an antiepileptic drug. Org. Process Res. Dev. 2018, 22, 457–466. 10.1021/acs.oprd.7b00373. [DOI] [Google Scholar]
- Huisgen R.; Szeimies G.; Möbius L. 1.3-Dipolare Cycloadditionen, XXXII. Kinetik der Additionen organischer Azide an CC-Mehrfachbindungen. Chem. Ber. 1967, 100, 2494–2507. 10.1002/cber.19671000806. [DOI] [Google Scholar]
- Mudd W. H.; Stevens E. P. An efficient synthesis of rufinamide, an antiepileptic drug. Tetrahedron Lett. 2010, 51, 3229–3231. 10.1016/j.tetlet.2010.04.060. [DOI] [Google Scholar]
- Ott D.; Borukhova S.; Hessel V. Life cycle assessment of multi-step rufinamide synthesis – from isolated reactions in batch to continuous microreactor networks. Green Chem. 2016, 18, 1096–1116. 10.1039/C5GC01932J. [DOI] [Google Scholar]
- Diab S.; Gerogiorgis D. I. Process modelling, simulation and technoeconomic evaluation of crystallisation antisolvents for the continuous pharmaceutical manufacturing of rufinamide. Comput. Chem. Eng. 2018, 111, 102–114. 10.1016/j.compchemeng.2017.12.014. [DOI] [Google Scholar]
- Borukhova S.; Noël T.; Metten B.; de Vos E.; Hessel V. Solvent- and Catalyst-Free Huisgen Cycloaddition to Rufinamide in Flow with a Greener, Less Expensive Dipolarophile. ChemSusChem 2013, 6, 2220–2225. 10.1002/cssc.201300684. [DOI] [PubMed] [Google Scholar]
- Ott D.; Borukhova S.; Hessel V. Life cycle assessment of multi-step rufinamide synthesis – from isolated reactions in batch to continuous microreactor networks. Green Chem. 2016, 18, 1096–1116. 10.1039/C5GC01932J. [DOI] [Google Scholar]
- Clements K. M.; Skornicki M.; O’Sullivan A. K. Cost-effectiveness analysis of antiepileptic drugs in the treatment of Lennox–Gastaut syndrome. Epilepsy behav 2013, 29 (1), 184–189. 10.1016/j.yebeh.2013.07.011. [DOI] [PubMed] [Google Scholar]
- Vural Gursel I.; Kurt S. K.; Aalders J.; Wang Q.; Noël T.; Nigam K. D. P.; Kockmann N.; Hessel V. Utilization of milli--scale coiled flow inverter in combination with phase separator for continuous flow liquid--liquid extraction processes. Chem. Eng. J. 2016, 283, 855–868. 10.1016/j.cej.2015.08.028. [DOI] [Google Scholar]
- Kurt S. K.; Vural Gursel I.; Hessel V.; Nigam K. D. P.; Kockmann N. Liquid--liquid extraction system with microstructured coiled flow inverter and other capillary setups for single--stage extraction applications. Chem. Eng. J. 2016, 284, 764–777. 10.1016/j.cej.2015.08.099. [DOI] [Google Scholar]
- Pai-Verneker V. R.; Krishna-Mohan V. Thermal decomposition of sodium azide. Thermochim. Acta 1977, 21, 375–380. 10.1016/0040-6031(77)85005-3. [DOI] [Google Scholar]
- Sharp K. V.; Adrian R. J. On flow-blocking particle structures in microtubes. Microfluid. Nanofluid. 2005, 1, 376–380. 10.1007/s10404-005-0043-x. [DOI] [Google Scholar]
- Campbell A. I.; Haw M. D. Jamming and unjamming of concentrated colloidal dispersions in channel flows. Soft Matter 2010, 6, 4688. 10.1039/c0sm00110d. [DOI] [Google Scholar]
- Dressaire E.; Sauret A. Clogging of microfluidic systems. Soft Matter 2017, 13, 37–48. 10.1039/C6SM01879C. [DOI] [PubMed] [Google Scholar]
- Perry R. H.; Green D. W.. Perry’s Chemical Engineers’ Handbook, 7th ed.; McGraw-Hill: New York, 1997; Chapter 9: Process Economics. [Google Scholar]
- Zhang T. Y. Process Chemistry: The Science, Business, Logic, and Logistics. Chem. Rev. 2006, 106, 2583–2595. 10.1021/cr040677v. [DOI] [PubMed] [Google Scholar]
- Bennett B.; Cole G.. Pharmaceutical Production: An Engineering Guide; Institution of Chemical Engineers: Rugby, UK, 2003. [Google Scholar]
- Hill A. M.; Barber M. J.; Gotham D. Estimated costs of production and potential prices for the WHO Essential Medicines. List. BMJ. Glob Health. 2018, 3 (1), e000571. 10.1136/bmjgh-2017-000571. [DOI] [PMC free article] [PubMed] [Google Scholar]
- Hart P.; Sommerfeld T. Cost estimation of specialty chemicals from laboratory-scale prices. Cost Eng. 1997, 39 (3), 31–35. [Google Scholar]
- Larragoiti-Kuri J.; Rivera-Toledo M.; Cocho-Roldan J.; Maldonado-Ruiz Esparza K.; Le Borgne S.; Pedraza-Segura L. Convenient Product Distribution for a Lignocellulosic Biorefinery: Optimization through Sustainable Indexes. Ind. Eng. Chem. Res. 2017, 56, 11388–11397. 10.1021/acs.iecr.7b02101. [DOI] [Google Scholar]
- Balster J.; Boam A.. Organic Solvent Nanofiltration (OSN), Evonik Presentation at the EMS Summer School, July 12, 2012, Nancy, France. [Google Scholar]
- de Leon Izeppi G. A.; Drexler C.; Kirschneck D. Preliminary economic assessment of a polymer production plant in batch and continuous manufacturing. Chim. Oggi 2018, 36, 36–39. 10.5281/zenodo.1584964. [DOI] [Google Scholar]
- Khinast J.; Rantanen J. The Future of Pharmaceutical Manufacturing Sciences. J. Pharm. Sci. 2015, 104 (11), 3612–3638. 10.1002/jps.24594. [DOI] [PMC free article] [PubMed] [Google Scholar]


