

Abstract
The epigenetic remodeling of chromatin histone proteins by acetylation has been the subject of recent investigations searching for biomarkers indicative of late onset cognitive loss. Histone acetylations affect the regulation of gene transcription and the loss of learning induced deacetylation at specific histone sites may represent biomarkers for memory loss and Alzheimer’s disease (AD). Selected-reaction-monitoring (SRM) has recently been advanced to quantitate peptides and proteins in complex biological systems. In this report we provide evidence that SRM-based targeted proteomics can reliably quantify specific histone acetylations in both AD and control brain by identifying the patterns of H3 K18/K23 acetylations. Results of targeted proteomics assays have been validated by Western-blot (WB) analysis. As compared with LC-MS/MS-TMT (tandem-mass-tag) and WB methods, the targeted proteomics method has shown higher throughput, therefore, promised to be more suitable for clinical applications. With this methodology we find that histone acetylation is significantly lower in AD temporal lobe than found in aged controls. Targeted proteomics warrants increased application for studying epigenetics of neurodegenerative diseases.
Keywords: Alzheimer’s disease, Epigenetics, Histone acetylation, PTMs, Targeted proteomics
Introduction
“Targeted proteomics,” an extension of LC-MS/MS selected-reaction-monitoring (SRM) spectrometry, enables quantification of multiply selected peptide molecules with unparalleled sensitivity and specificity [1–7]. Just as Western-blot analysis enables the specific identifications of peptide sequences by antibodies, targeted proteomics detects the many transitions of precursor ions derived from specific peptides with signal intensities that have a linear correspondence to peptide concentrations. In contrast to the antibody imposed restrictions of Western-blot analysis for specific protein epitopes, targeted proteomics can monitor up to 2000 peptide transitions with one LC-MS/MS run [1–7]. Though the technology is not yet fully optimized for quantitating protein expressions in complex biological systems, it has matured to the point that it is useful to validate data obtained by other quantitative proteomics methods [8–10], especially when antibodies are unavailable or of questionable quality.
Epigenetic regulation by histone acetylation is an important determinant of cell replication, differentiation, and death. A number of recent studies have shown in animal models that both aging and Alzheimer’s disease pathology are associated with loss of histone acetylation [11–12]. One recent study demonstrated that histone deacetylase inhibitors reversed the loss of spines on dendrites [13]. Finally, histone acetylation is being studied in the design of therapeutic strategies for memory loss since histone deacetylase inhibitors reverse learning deficits in a murine model of AD. A mouse with an acetyltransferase gene knock-out was shown to be resistant to the toxic effects of a beta-amyloid peptide [12, 14]. Though animal data is promising, there is little data available from human tissue to determine if the findings are relevant to Alzheimer’s disease.
Several mass spectrometry methods have previously been developed to quantify histone modifications in cultured cells or tissues using deuterated acetyl or propionylated anhydride derivatization and stable-isotope labeling [15–17]. Previous applications were developed to compare histone modification changes between two samples, for example, one for control (healthy) and the other for study (disease). Methods in current use to quantify tissue histone modifications are cumbersome and not readily applicable to large sample size analysis. Thus the critical need for a method that enables the expeditious assay of histone modification patterns in a sufficient number of samples to attain statistical significance can be met by targeted proteomics.
Our laboratory has previously demonstrated the capability of targeted proteomics to quantitate histone methylation and ubiquitination [18]. We applied the novel techniques of targeted proteomics to evaluate the degree of histone acetylation in human brain tissue with advanced Alzheimer’s disease with various degrees of vascular amyloid deposition as compared to neurologic controls. Our results have been validated by Western-blot analysis and LC-MS/MS-TMT quantitative proteomics. Results from the three different methods are in good agreement and establish that histone H3 K18/K23 acetylation is significantly reduced in the AD temporal lobe as compared to controls.
Materials and Methods
Samples and reagents
All tissue collection was performed with the consent of patients or their surrogates as part of the UCLA brain bank and approved by the institutional review board at Loma Linda University. Tissue from the temporal lobe was flash frozen over liquid nitrogen and stored at −80 ºC until the time of the experiments. As listed in Table 1 and S1, the three age-matched groups were: neurological controls (Ctl, n=4), Alzheimer’s disease subject with minimal cerebral amyloid angiopathy (CAA−, n= 5) and Alzheimer’s disease subjects with severe cerebral amyloid angiopathy (CAA+, n=6).
Table 1.
Information on samples and quantification methods used.
| Samples # | 1 | 11 | 31 | 36 | 43 | 68 | 84 | 104 | 105 | 122 | 145 | 166 | 172 | 175 | 197 |
|---|---|---|---|---|---|---|---|---|---|---|---|---|---|---|---|
| Definition | AD CAA + |
AD CAA − |
AD CAA − |
Ctl | Ctl | Ctl | Ctl | AD CAA + |
AD CAA + |
AD CAA + |
AD CAA − |
AD CAA − |
AD CAA + |
AD CAA − |
AD CAA + |
| Targeted | x | x | x | x | x | x | x | x | x | x | x | x | x | x | |
| TMT | x | x | x | x | x | x | |||||||||
| WB | x | x | x | x | x | x |
Note: AD: Alzheime’s Disease, CAA +: positive cerebral amyloid angiopathy, CAA −: negative cerebral amyloid angiopathy, Ctl: Control, and x: it has been analyzed by targeted proteomics (Targeted), LC-MS/MS-TMT (TMT), or western-bold (WB)
Internal peptide standards were synthesized as previously reported [18]. Chemicals and solvents were purchased from Sigma and Fisher Scientific and TMT-6 reagents from Thermo Scientific.
Histone isolation
Frozen temporal lobe tissue was rinsed with 2 mL ice-cold PBS and homogenized in 1 mL PBS using a glass homogenizer. After centrifugation at 2000 rpm for 5 minutes, the pellet was submerged in TEB buffer (Triton Extraction Buffer: PBS containing 0.5% (v/v)Triton x-100, 2 mM phenymethylsulfonyl fluoride (PMSF), 0.02% (v/v) NaN3 and protease inhibitor cocktail) and placed on ice for 45 minutes. After centrifugation at 2000 rpm for 7 minutes, the pellet was submerged in 400 μl of 0.4 N H2SO4 and placed on a shaker in the cold room to extract histones overnight. After centrifugation at 15000 rpm for 10 minutes, TCA was added in the supernatant to the final concentration 33% and the supernatant was incubated on ice for 30 minutes. Histones were pelleted by centrifugation at 15000 rpm for 10 minutes and rinsed with ice-cold acetone. Air-dried histones were re-dissolved in 200 μl of water and stored at −20 ºC.
Histone digestion and TMT labeling
In an aliquot of histones (~20 μg), equal volume of 50 mM NH4HCO3 was added and histones digested with 0.5 μg of trypsin for 8 hr at 37 ºC. Digests were speed-vacuum dried and then re-dissolved in 200 μl of 0.2% formic acid with 50 μl of peptide internal standards added to the solution. The peptide internal standards used in this experiment were YRPGTV*ALR (10 μM) and KQLATKprA*A*R (Kpr: propionylated lysine, 0.5 µM) where A* and V* were labeled with 13C to make the masses of peptides increased by 8 Daltons. Mixtures were subjected to targeted proteomics analysis.
Another aliquot of histones was mixed with equal volume of 50 mM triethylammonium bicarbonate buffer (TEBB) and digested with 0.5 μg of trypsin for 8 hr. After digestion, 10 μl of TMT-6 reagents (0.8 mg dissolved in 50 μl of 99.9% acetonitrile) was added to the solution and the labeling (derivatization) reaction continued for 1.5 hr before termination by 5 μl of 5% hydroxylamine. The solution was neutralized to be acidic by adding 2% formic acid and desalted using a Toptip column with C18/hypercarb mixed materials (LC-Packing) by following the loading-rinse-eluting steps. The eluted peptides were speed-vacuum dried and re-dissolved in 20 μl of 0.1% formic acid, and then submitted for LC-MS/MS analysis.
Mass Spectrometric Analysis
Targeted proteomic experiments were run on the Agilent 6410 triple quadrupole mass spectrometer. Parameters for positive-ion electrospray: ion source 300 °C; nebulizer gas (N2) flow 10 L/h (42.0 psi in pressure); capillary voltage 4.5 KV; capillary current 75 nA, chamber current 1.66 µA. The selected-reaction-monitoring (SRM) mode was chosen for qualitative and quantitative analysis of peptides with collision energies and fragmentor voltages optimized by a series of changes of parameters using standard peptides or test samples. 20 µl of standard solutions (concentrations vary from 10 fmole/ 20 µl to 1 nmole/20 µl ) injected each time through the HTC PAL autosampler for method development and a maximum amount of 40 µl of histone digests injected through a Rheodyne manual injector for each LC-MS/MS analysis of samples. Acetylation level was calculated by the ratio of the integrated areas of the SRM peaks corresponding to acetylated peptides (Note: Acetylated lysines are mis-cleaved by trypsin) over the integrated areas of the SRM peaks corresponding to H3 peptide without modifications. Figure 1 outlines the principle of SRM for the quantification of histone modifications as reported by our laboratory [18].
Figure 1.
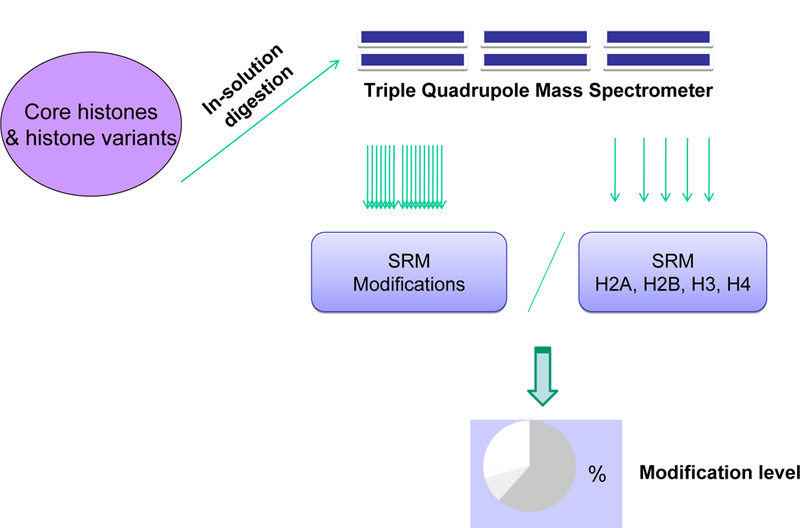
An outline of instrumentation and method for the quantification of histone PTMs by targeted proteomics.
Quantification of peptides by TMT-6 labeling was carried out on the Thermo Orbitrap Velos mass spectrometer. Peptides were separated by online RPLC using an Easy-nLC that houses an autosampler (Thermo Scientific). A 10 cm, 100 µm i.d., 1.7 µm particle size, Equity C18 analytical column (Waters) for the RPLC separations. Approximately 2 µg of peptide sample was injected and experiments run in triplicate. A precolumn (LC Packings, Acclaim PepMap 100 C18, 0.30 × 5 mm, 5 µm in particle size) brought inline with the analytical column and a 200-minute gradient (solvent A, 0.1% formic acid in water; solvent B, 0.1% formic acid in acetonitrile) from 0.1–30% solvent B was used for separating the peptides. The Orbitrap mass analyzer was set to acquire data at 60,000 resolution for the parent full-scan mass spectrum followed by data-dependent HCD MS/MS spectra for the top 12 most abundant ions acquired at 7,500 resolution. The reporter ions of acetylated peptides (Figure 2A) were normalized against the reporter ions of H3 peptide without modifications (Figure 2B). Acetylation levels are calculated by the ratio of the intensities of the reporter ion of the acetylated peptides over the intensities of the reporter ion of H3 peptide without modifications.
Figure 2.
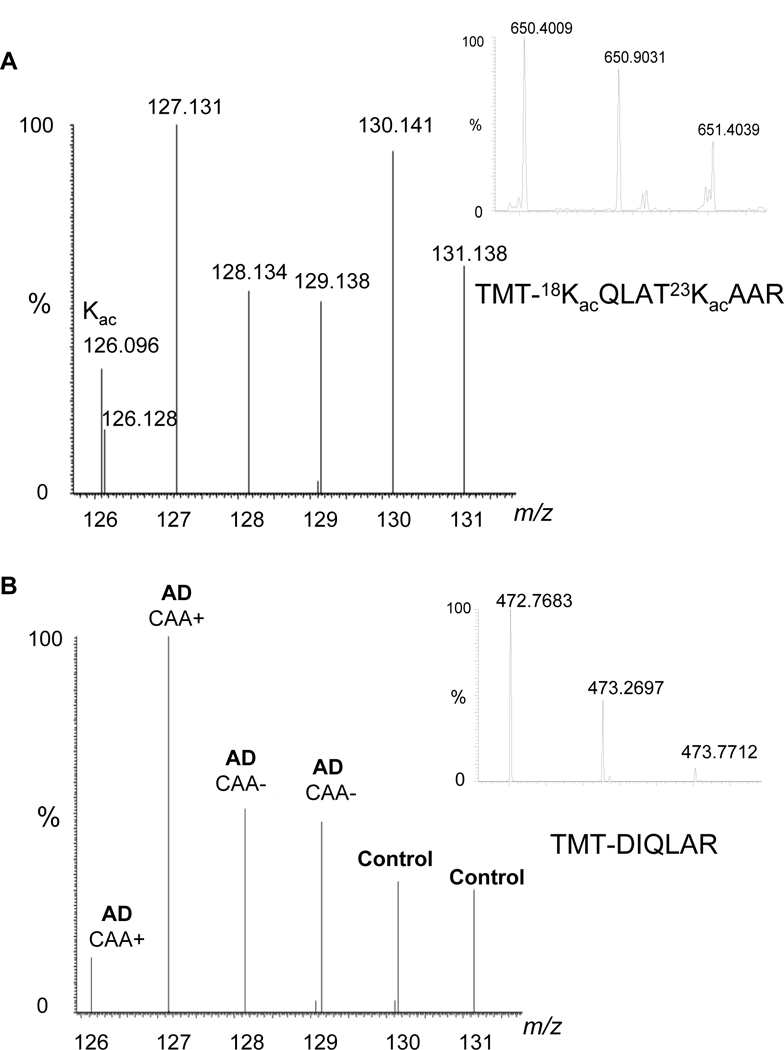
The principle for the quantification of histone acetylation by LC-MS/MS-TMT. A. Reporter ions of the TMT-6 labeled K18/K23 acetylated peptide with a precursor ion at m/z 650.4009. The ion at m/z 126.096 represents the characteristic immonium ion of an acetylated lysine. B. Reporter ions of the TMT-6 labeled H3 peptide with a precursor ion at m/z 471.7683. Histone acetylation level was calculated as the ratio of the intensities of the reporter ions of the acetylated peptide, TMT-18KacQLAT23KacAAR, over the intensities of the reporter ions of the H3 peptide, TMT-DIQLAR.
Western-blot Analysis
Equal amount of core histones were separated by a mini-gel electrophoresis and transferred to a PVDF membrane using an Invitrogen iBlot® Dry Blotting System. The membrane was incubated with blockage buffer (1% BSA in TBS-T) for one hour at room temperature to block the epitope and then incubated with primary antibodies anti-H3, anti-H3 K18 acetylation, and anti-H3 K23 acetylation in the blockage buffer (1:1000 dilution) (All antibodies purchased from Abcam), respectively, after each striping of previous antibody. Membranes washed with TBS-T buffer (3 times) were incubated with fluoro-conjugated secondary (1:5000 dilution) in TBS-T buffer for one hour at room temperature. Membranes were then washed with TBS-T buffer (3 times), tap-water (3 times), dried by Kimwipes tissue before soaked with ECL solution (PerkinElmer, 1.2 mL mixture of oxidizing reagent (0.6 mL) and luminol reagent (0.6 mL)/membrane) for 5 minutes, fully-dried again before sandwiched by two transparent plastic sheets and film-imaged.
Statistical Analysis
Average of acetylation percentage was the mean of multiple data points of measurements and variation of analysis was calculated by the standard deviation (STDV from Microsoft Excel). Significant change of acetylation level was calculated by p-values using the Sattherwaite equation and a p-values calculator (http://www.graphpad.com/quickcalcs/pvalue1.cfm) (Supplemental method).
Results
1. Quantification of histone acetylation by targeted proteomics
As indicated in the experimental section, histone acetylation is determined by the ratio of the integrated peak area of the SRM transition (precursor ion m/z 535.8 → product ion m/z 772.4 (y7)) corresponding to the acetylated H3 peptide, 18KacQLAT23KacAAR, over the integrated peak area of the SRM transition (precursor ion m/z 516.8 → product ion m/z 303.1 (b2-NH3)) corresponding to the H3 peptide, YRPGTVALR. Two internal standards 13C-labeled (marked as *) at selective amino acids, 18KQLAT23KprA*A*R (SRM transition: 525.8 → 681.4) for the acetylated peptide and YRPGTV*ALR (SRM transition: 520.8 → 303.1) for histone H3, were spiked in the samples for evaluation of the reproducibility of the analyte signal response. The indicated precursor ions − product ions pairs (SRM transitions) were chosen for the analysis of the four peptides since they provided the strongest signal responses and maximum sensitivity. Figure 3A shows the total ion chromatogram (TIC) of the SRM transitions of the above-mentioned four peptides.
Figure 3.
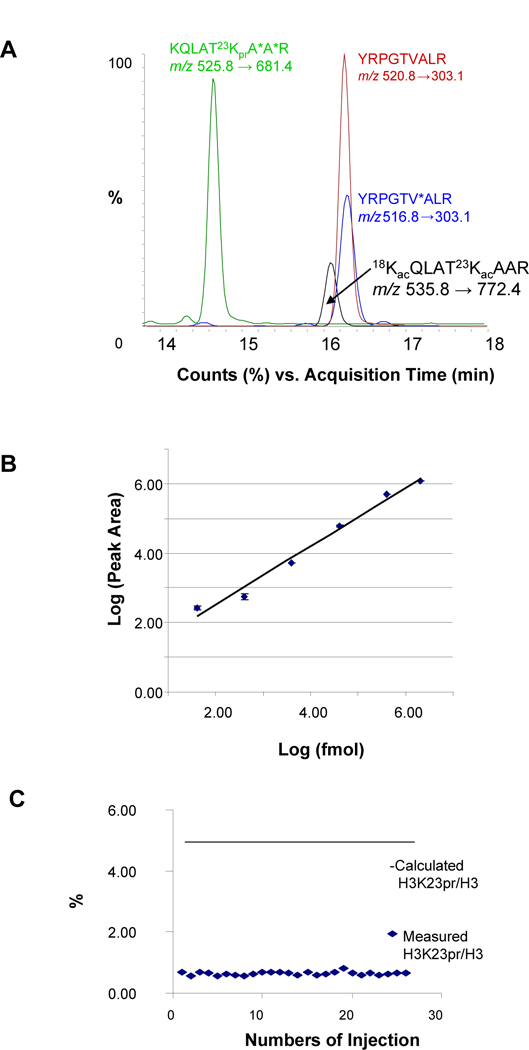
Method evaluation for the quantification of H3 K18/K23 acetylation by targeted proteomics. A. TICs of SRM transitions (pairs of precursor ions and their corresponding product ions) of the H3 K18/K23 acetylated peptide, H3 peptide, and two stable-isotope labeled internal standards. B. Linear curve (Log10) of the relationship between signal responses and H3 peptide concentrations. C. Evaluation of the reproducibility of the measured percentage of H3 K23 propionylation.
The signal response relative to peptide concentration was evaluated by the correlation between peak intensities and the peptide concentrations. ~1000 pmole of internal standard peptide YRPGTV*ALR was spiked in the core histones extracted from one temporal lobe and the solution consecutively diluted with water by a factor of 10 to a final concentration of 10 fmole. Each sample was analyzed twice by LC-MS/MS-SRM and a standard curve constructed from Log10 peak areas versus Log10 sample concentrations. As shown in Figure 3B, the signal response was linear between 100 fmole and 100 pmole indicating four orders of magnitude of dynamic range consistent with previous measurements of ubiquitinated H2B peptide and propiolynated H3 peptide [18]. This dynamic range ensured an accuracy of quantification of acetylation as low as 0.1%.
The reproducibility of analysis was evaluated by the consistency of the signal (integrated peak area) ratio representing the percentage of the H3K23pr peptide relative to the H3 peptide of two spiked internal peptides with known concentrations and fixed acetylation ratio. Signals of the H3K23pr internal standard peptide and the H3 internal standard peptide fluctuated minimally during 26 consecutive runs (duplicate runs of 13 samples). The mean measured percentage of H3K23pr peptide over H3 peptide was 0.65% ± 0.06% (Figure 3C). However, the measured percentages deviated significantly from the 5.0% calculated value presumable due to the inconsistency of electrospray efficiency. The compositions of the two peptides are different and they elute out of the HPLC column based on different contents of solvents. Furthermore, the sensitivities of the two pairs of transitions respectively belonging to the two peptides could be dramatically different. Thus, the percentage of acetylation calculated from mass spectrometry measured signals may not reflect the true concentration. On the other hand, a relative comparison of the percentage among samples is important since we are only interested in the changes that allow for a relative quantification of histone acetylation. In view of the limited availability of stable-isotope labeled K18/K23 acetylated peptide for an internal standard a synthetic stable-isotope labeled H3K23pr peptide was substituted since it has the identical amino acid sequence as K18/K23 acetylated peptide. In order to ensure reproducibility and linear response of signals, the following conditions were applied to the assays: Same HPLC and MS methods, same tune files used for all samples, the analyses finished uninterruptedly without deterioration of MS performance or drift of HPLC retention time.
Appling those optimized conditions to measure SRM transitions that included the choice of product ions, collision energies, and fragmentor voltages [18], H3 K18/K23 acetylation levels in 13 brain tissues were analyzed by LC-MS/MS-SRM with triplicates (Table S2). Since the peptide composition from the core histone digest is relatively homogenous, no proteotypic interferences were found in the transitions chosen for the quantification of histones and histone modifications [18]. Specifically for this study, the average level of histone H3 K18/K23 di-acetylation was determined by LC-MS/MS-SRM to be 24.73% in three controls, 3.90% in four CAA – brain tissue, and 4.45% in six CAA + brain tissue, respectively (Table S2). Therefore, the LC-MS/MS-SRM data demonstrated that H3 acetylation in AD, with CAA or without CAA, was significantly (~ six fold and p = 0.014 and 0.016, respectively, for AD CAA – and AD CAA +) lower than H3 acetylation in the controls, brain tissues donated from healthy persons after their death while no significant changes of H3 acetylation was observed between those two types of AD, AD with CAA (4.45% H3 K18/K23Ac) and AD without CAA (3.90% H3 K18/K23Ac) (Table S2 and Figure 4A). H3 K18 acetylation (H3 K18Ac) and H3 K23 acetylation (H3 K23Ac) in two sets of brain samples (Control, AD CAA –, and AD CAA +) were analyzed by Western-blot (WB) using antibodies specifically against H3 K18Ac and H3 K23Ac and using anti-H3 antibody as loading controls. The WB data demonstrated that acetylation of H3 in AD (CAA – and CAA +) brain tissue decreased as compared with that in the controls (Figure 4B), a well consistent with the data obtained by targeted proteomics analysis. It is noteworthy that among the six samples, sample #11 (AD CAA – brain tissue) and sample #84 (control brain tissue) were not analyzed by neither LC-MS/MS-SRM nor LC-MS/MS-TMT (Table 1). As shown from WB data (Figure 4B), histone acetylation in #84 was significantly higher than in both #166 (AD CAA −) and # 122 (AD CAA +) while histone acetylation in #11 was significantly lower than in #68 (control), demonstrating that WB not only validated the LC-MS/MS-SRM data but also reinforced the result − histone H3 acetylation is higher in control samples than in the AD samples.
Figure 4.
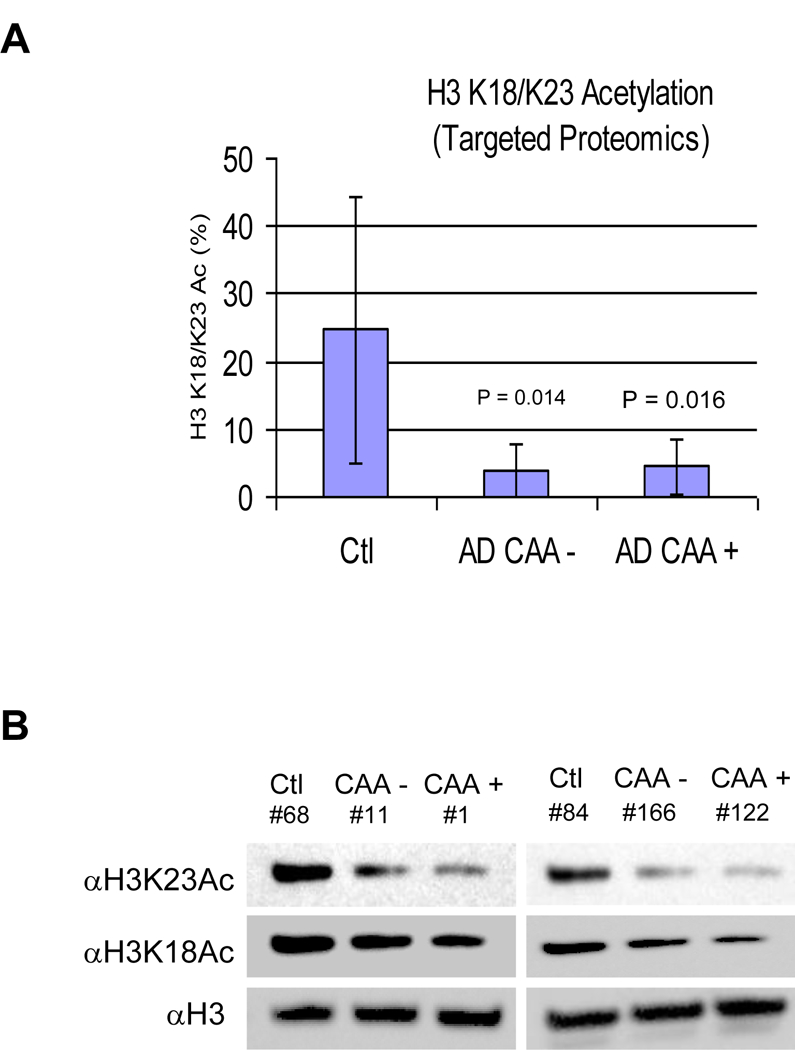
Quantification of H3 K18/K23 acetylation in AD by targeted proteomis. A. H3 K18/K23 acetylation levels in brain tissues quantified by targeted proteomics. B. Western-blot analysis.
2. Quantification of histone acetylation by LC-MS/MS-TMT
Quantification of histone acetylation was alternatively carried out by stable-isotope labeling techniques, a method for laboratories that do not have the capability of performing SRM but have resources to do proteomics with Orbitrap or QTOF mass spectrometers. TMT, alike to iTRAQ, labels peptides predominantly on N-terminal amines, showing an isobaric mass of the peptides (mass of the peptides and the addition of the mass of the modification moiety of TMT reagents). Fragmentation of TMT labeled peptides results in a series of characteristic reporter ions arising from the differentially labeled TMT reagents. The intensities of reporter ions correlate with the concentrations of TMT labeled peptides. As a result, LC-MS/MS-TMT is an accurate measurement of changes in protein expression that are differentially labeled with isobaric TMT reagents because TMT-labeled isobaric peptides behave identically in HPLC and MS assays.
LC-MS/MS-TMT can also be used to quantify histone modifications. Modification levels are calculated by the intensities of reporter ions from modified peptides over the same reporter ions from H3 peptides without modifications. The TMT method allows a relative calculation of acetylation using two peptides (one acetylated peptide and one unmodified peptide) in histone H3. Since the ratio of the signals (peak areas) of two peptides within the same protein is independent of the protein concentrations under identical mass spectrometry and HPLC conditions, a normalization of total proteins is not needed as well for quantification of histone acetylation. One disadvantage of the TMT method over targeted proteomics is that the former can only quantify a maximum of six samples.
In this experiment, trypsin digests of histones extracted from six brain tissues (two controls, two AD with CAA and two AD without CAA) were labeled with six TMT reagents, TMT-126, TMT-127, TMT-128, TMT-129, TMT-130 and TMT-131, respectively. The mixture of these six samples was then subjected to LC-MS/MS analysis. Triplicate analyses were carried out for each sample. Table S3 showed the acetylation percentage calculated by the ratio of the peak intensities corresponding to the peptide with sequence TMT-18KacQLAT23KacAAR (m/z 650.4009, 2+) over the peak intensities corresponding to the H3 peptide with the sequence TMT-DIQLAR (m/z 472.7683, 2+). The peptide, YRPGTVALR, used in targeted proteomics method was not chosen for quantification in the LC-MS/MS-TMT method, because its TMT N-terminal modified form was not detected. The disappearance of TMT-YRPGTVALR was likely caused by multiple TMT modifications at other sites including T and Y. When comparing data in Table S2 (targeted proteomics) to that in Table S3 (TMT), the change of histone acetylation level in AD measured by these independent methods is in good agreement.
Discussion
The evidence for learning induced specific site histone acetylations in experimental animal hippocampal DNA has triggered intensive research in epigenetic studies of late-onset cognitive loss [19–24]. Fisher and colleagues found an altered expression of more than 1500 hippocampal genes in response to fear conditioning in young mice that were not detected in middle aged mice. Increased acetylation of histone H4 lysine 12 (H4K12) was upregulated in the younger animals in contrast to middle aged animals. An increase in histone acetylation is assumed to provide expanded chromatin and increased gene expression [19]. Histone modifications, such as acetylations, phosphorylations or methylations, tend to cluster in regions of gene promoters such as the H4K12 histone region and elongate gene transcription. Thus modulation of histone acetylation has been considered into the design of several therapeutic strategies. Restoration of H4K12 acetylation in mice by histone deacetylation inhibitors enables expression of the learning dependent gene and improved learning of fear conditioning [19]. Improved learning in mice following treatment with histone deacetylation inhibitors were also reported in several other independent studies [20–24], resulting in ongoing intensive investigation in animal therapeutic trials.
The analytical results obtained by targeted proteomics have been validated by Western-blot analysis. In addition, targeted proteomics has technical advantages over the Western-blot and TMT as WB requires the precision of equal loading of H3 samples for electrophoresis and TMT can only quantify a maximum of six samples. Targeted proteomics can quantify unlimited samples consecutively and without the need of equal amount of sample loading. Moreover, the targeted proteomics method has the potential of being extended to enable quantification of multiple histone modifications simultaneously. The major limitation of our targeted proteomics method is the lack of a contemporary triple quadrupole mass spectrometer interfaced with a nano-ESI source and a nano-LC system. This upgraded equipment could increase our analytical sensitivity by several orders of magnitude. Despite this limitation our current equipment enabled a reliable comparative quantification of histone H3 K18/K23 acetylation in AD and control brains. Further development of this new technology will enable a facile quantification of histone acetylation, an important tool for the study of the role of epigenetic modifications and of late-onset cognitive loss.
We have found that histone acetylation in frozen post-mortem AD temporal lobe is significantly lower than that from tissue in aged controls. This data is consistent with previous reports of reduced histone acetylation in the brains of cognitively impaired mice. Histone H4 acetylation in APP/PS1 mice is 50% lower than in wild-type littermates [11]. Histone deacetylase inhibitors can restore hisone acetylation level in the cells and have the effect on memory restoration in the mice with age-dependent memory impairment or other neurodegenerative diseases [20–24]. Our data from human Alzheimer’s disease demonstrated a similar histone acetylation pattern to those in transgenic Alzheimer’s disease animal models. These important findings set the stage for extensive further work to characterize histone acetylation in various neuropathologic phenotypes and genetic subtypes of Alzyheimer’s disease and determine how histone acetylation is linked to disease pathology.
Supplementary Material
Acknowledgements
This work was supported by US National Institute of Health grant (1S10RR027643-01 to KZ).
List of abbreviations:
- AD
Alzheimer’s disease
- CAA
cerebral amyloid angiopathy
- TMT
tandem-mass-tagging
- iTRAQ
isobaric tags for relative and absolute quantification
- HCD
high collision-energy dissociation
- TEBB
triethylammonium bicarbonate buffer
- TCA
Trichloroacetic acid
Footnotes
All authors have no financial/commercial conflicts of interest related to this work.
References
- 1.Keshishian H, Addona T, Burgess M, Kuhn E, and Carr SA, Quantitative, multiplexed assays for low abundance proteins in plasma by targeted mass spectrometry and stable isotope dilution. Mol. Cell. Proteomics 2007, 6, 2212–2229. [DOI] [PMC free article] [PubMed] [Google Scholar]
- 2.Abbatiello AE, Mani DR, Keshishian H, and Carr SA, Automated detection of inaccurate and imprecise transitions in peptide quantification by multiple reaction monitoring mass spectrometry. Clinical Chemistry 2010, 56, 291–305. [DOI] [PMC free article] [PubMed] [Google Scholar]
- 3.Kim K and Kim Y, Preparing multiple-reaction monitoring for quantitative clinical proteomics. Expert Rev. Proteomics 2009, 6, 225–229. [DOI] [PubMed] [Google Scholar]
- 4.Callipo L, Foglia P, Gubbiotti R, Samperi R, and Lagana A, HPLC-CHIP coupled to a triple quadruple mass spectrometer for carbonic anhydrase II quantification in human serum. Anal. Bioanal. Chem 2009, 394, 811–820. [DOI] [PubMed] [Google Scholar]
- 5.Yocum AK, and Chinnaivan AM, Current affairs in quantitative targeted proteomics: multiple reaction monitoring-mass spectrometry. Brief funct. Genomic Proteomics 2009, 8: 145–157. [DOI] [PMC free article] [PubMed] [Google Scholar]
- 6.Doerr A, Targeted proteomics. Nature methods 2011, 8, 43. [Google Scholar]
- 7.Jovanovic M, Reiter L, Picotti P, Lange V, et al. , A quantitative targeted proteomics approach to validate predicted microRNARNA targets in C. elegans. Nature Methods 2010, 7, 837–842. [DOI] [PMC free article] [PubMed] [Google Scholar]
- 8.Olsen JV, Schwartz JC, Griep-Raming J, Nielsen ML, et al. , A dual pressure linear ion trap Orbitrap instrument with very high sequencing speed. Mol. Cell. Proteomics 2009, 8, 2759–2769. [DOI] [PMC free article] [PubMed] [Google Scholar]
- 9.Second TP, Blethrow JD, Schwartz JC, Merrihew GE, et al. , Dual-pressure linear ion trap mass spectrometer improving the analysis of complex protein mixtures. Anal. Chem 2009, 81, 7757–7765. [DOI] [PMC free article] [PubMed] [Google Scholar]
- 10.Xiong L, Darwanto A, Sharm S, Herring J, et al. , Mass spectrometric studies on epigenetic interaction networks in cell differentiation. J. Biol. Chem 2011, 286, 13657–13668. [DOI] [PMC free article] [PubMed] [Google Scholar]
- 11.Francis YI, Fà M, Ashraf H, Zhang H, et al. , Dysregulation of histone acetylation in the APP/PS1 mouse model of Alzheimer’s disease. J. Alzheimer’s Dis 2009, 18, 131–139. [DOI] [PMC free article] [PubMed] [Google Scholar]
- 12.Govindarajan N, Agis-Balboa RC, Walter J, Sananbenesi F Fisher A Sodium butyrate improves memory function in an Alzheimer’s disease model when administered at an advanced stage of disease progression. J. Alzheimer’s Dis 2011, 26, 187–197. [DOI] [PubMed] [Google Scholar]
- 13.Ricobaraza A, Cuadrado-Tejedor M, Marco S, Pérez-Otaño I, and García-Osta A, Phenylbutyrate rescues dentritic spine loss associated with memory deficits in a mouse model of Alzheimer disease. Hippocampus (in press). [DOI] [PubMed]
- 14.Duclot F, Meffre J, Jacquet C, Maurice T Mice knock out of the histone acetyltransferase p300/CREB binding protein-associated factor develop a resistance to amyloid toxicity. Neuroscience 2010, 167, 850–863. [DOI] [PubMed] [Google Scholar]
- 15.Smith CM, Gafken PR, Zhang Z, Gottschling JB, et al. , Mass spectrometric quantification of acetylation at specific lysines within the amino-terminal tail of histone H4. Anal. Biochem 2003, 316, 23–33. [DOI] [PubMed] [Google Scholar]
- 16.Knapp AR, Ren C, Su X, Lucas DM, et al. , Quantification profiling of histone post-translational modifications by stable isotope labeling. Methods 2007, 41, 312–319. [DOI] [PMC free article] [PubMed] [Google Scholar]
- 17.Plazas-Mayorca MD, Zee BM, Young NL, Fingerman IM et al. , One-pot shotgun quantitative mass spectrometry characterization of histones. J. Proteome Res 2009, 8, 5367–5374. [DOI] [PMC free article] [PubMed] [Google Scholar]
- 18.Darwanto A, Curts M, Schrag M, Kirsch W, et al. , A modified “cross-talk” between histone H2B Lys-120 ubiquitination and H3 Lys-K79 methylation. J. Biol. Chem 2010, 285, 21868–21876. [DOI] [PMC free article] [PubMed] [Google Scholar]
- 19.Fischer A, Sarahnaz F, Wang X, Dobbin M, and Tsai L-H Recovery of learning and memory is associated with chromatin remodeling. Nature 2007, 447, 178–182. [DOI] [PubMed] [Google Scholar]
- 20.Peleg S, Sananbenesi F, Zovoilis A, Burkhardt S, et al. , Altered histone acetylation is associated with age-dependent memory impairment in mice. Science 2010, 328, 753–756. [DOI] [PubMed] [Google Scholar]
- 21.Kilgore M, Miller CA, Fass DM, Hennig KM, et al. , Inhibitors of class 1 histone deacetylases reverse contextual memory deficits in a mouse model of Alzheimer’s disease. Neuropsychopharmacology 2010, 35, 870–80. [DOI] [PMC free article] [PubMed] [Google Scholar]
- 22.Kim H-S, Kim E-M, Kim NJ, Chang KA, et al. , Inhibition of histone deacetylation enhances the neurotoxicity induced by the C-terminal fragments of amyloid precursor protein. J. Neurosci. Res 2004, 75, 117–124. [DOI] [PubMed] [Google Scholar]
- 23.Sananbenesi F, and Fischer A, The epigenetic bottleneck of neurodegenerative and psychiatric diseases. Biol Chem 2009, 390, 1145–1153. [DOI] [PubMed] [Google Scholar]
- 24.Daniilidou M, Koutroumani M, and Tsolaki M Epigenetic mechanisms in Alzheimer’s disease. Curr. Med. Chem 2011, 18, 1751–1756. [DOI] [PubMed] [Google Scholar]
Associated Data
This section collects any data citations, data availability statements, or supplementary materials included in this article.