Abstract
This study evaluated the biocompatibility of degradable polydioxanone (PDS) electrospun drug delivery systems (hereafter referred as matrices) containing metronidazole (MET) or ciprofloxacin (CIP) after subcutaneous implantation in rats. 60 adult male rats were randomized into 6 groups: SHAM (sham surgery); PDS (antibiotic-free matrix); 1MET (one 25 wt.% MET matrix); 1CIP (one 25 wt.% CIP matrix); 2MET (two 25 wt.% MET matrices); and 2CIP (two 25 wt.% CIP matrices). At 3 and 30 days, animals were assessed for inflammatory cell response (ICR), collagen fibers degradation, and oxidative profile (reactive oxygen species, ROS; lipid peroxidation, LP; and protein carbonyl, PC). At 3 days, percentages of no/discrete ICR were 100, 93.3, 86.7, 76.7, 50, and 66.6 for SHAM, PDS, 1MET, 1CIP, 2MET, and 2CIP, respectively. At 30 days, percentages of no/discrete ICR were 100% for SHAM, PDS, 1MET and 1CIP and 93.3% for 2MET and 2CIP. Between 3 and 30 days, SHAM, 1CIP, and 2CIP produced collagen, while 1MET and 2MET were unchanged. At 30 days, the collagen fiber means percentages for SHAM, PDS, 1MET, 1CIP, 2MET, and 2CIP were 63.7, 60.7, 56.6, 62.6, 51.8, 61.7, respectively. Antibiotic-eluting matrices showed similar or better oxidative behavior when compared to PDS, except for CIP-eluting matrices, which showed higher levels of PC compared to SHAM or PDS at 30 days. Collectively, our findings indicate that antibiotic-eluting matrices may be an attractive biocompatible drug delivery system to fight periodontopathogens.
Keywords: Drug delivery, Biomaterials, Electrospinning, Nanofibers, Periodontitis
INTRODUCTION
Periodontitis is an inflammatory disorder that leads to the destruction of the teeth supporting tissues, ultimately resulting in tooth loss. According to data from the World Health Organization (WHO), 10.8% of the adult populations worldwide have severe periodontitis.1 Moreover, severe periodontitis is the sixth most prevalent condition in the world.2 Over the last three decades, several regenerative-based strategies aimed at periodontal tissue reconstruction have been proposed3–6 and yet the ideal biomaterial and/or scaffold is still to be found.7
Barrier membranes have been employed in the so-called guided tissue/bone regeneration (GTR/GBR) approaches.8,9 Nevertheless, current membranes, do not possess the structural integrity required to resist compressive forces to maintain the space necessary for periodontal regeneration.10,11 Conventional, non-resorbable membranes have the disadvantage of necessitating a second surgery, with the associated additional discomfort and economic burden. Polyester-based membranes (e.g., polydioxanone, PDS) are biodegradable, allow for tissue integration, and are easier to handle when compared to non-resorbable counterparts. In terms of periodontal defect disinfection prior to tissue regeneration, biodegradable nanofibrous antibiotic-eluting delivery systems have the potential to endow a bacteria-free microenvironment, reducing risk of GTR/GBR failure due to infection,12 while minimizing adverse effects associated with the use of systemic antibiotics.13
Numerous authors have explored the electrospinning technique to generate nanofibrous matrices for drug delivery.10,14–18 Bottino and colleagues19,20 presented mechanically strong biodegradable PDS-based antibiotic-eluting matrices, which demonstrated: (i) adequate mechanical properties to sustain handling and maintain the overall structure during regenerative procedures; (ii) an inhibitory effect on the biofilm of Porphyromonas gingivalis, Aggregatibacter actinomycetemcomitans, and Fusobacterium nucleatum with no detrimental effects on commensal bacteria biofilm (e.g., Lactobacillus casei), and (iii) controlled release of an adequate drug dose over 7 days. Moreover, 25 wt.% MET matrices and its CIP counterparts released only 12% and 40%, respectively, of the antibiotic during this period, demonstrating the ability to sustain a controlled release for a longer time period. Taken together, the ability to inhibit periodontal pathogens enhances the clinical potential of the proposed nanofibrous antibiotic-eluting matrices as a drug delivery system for applications in periodontics. Thus, the purpose of this investigation was to determine the inflammatory response of biodegradable PDS-based electrospun antibiotic-eluting matrices containing MET or CIP using a rat subcutaneous implantation model. Initial (3 days) and late (30 days) inflammatory responses were assessed based on degree of local inflammatory cell response, tissue oxidative status, and collagen degradation.
MATERIAL AND METHODS
Synthesis of electrospun drug delivery systems
Polydioxanone monofilament surgical sutures (PDS II®, Ethicon, Somerville, NJ, USA) were cut into pieces and placed into glass vials containing dichloromethane (Sigma Aldrich, St. Louis, MO, USA) to remove the violet dye.19 Next, undyed PDS was then dissolved in 1,1,1,3,3,3-hexafluoro-2-propanol (Sigma Aldrich) at a 10 wt.% concentration. Metronidazole (Sigma Aldrich) with a molecular weight (Mw) of 171.15 g/mol, or ciprofloxacin (Sigma Aldrich) with Mw of 331.346 g/mol, were directly added at 25 wt.% concentration (respective to the total polymer weight), and mixed together under vigorous stirring.19,20
Pure (i.e., antibiotic-free) PDS or antibiotic-containing PDS solutions were individually loaded into plastic syringes fitted with a 27-gauge stainless steel needle and electrospun under optimized parameters (2 mL/h, 18-cm distance, and 15 kV). The fibers were collected at room temperature (RT) on an aluminum-foil covered rotating mandrel. The electrospun matrices were dried in vacuum desiccators at RT for at least 48 h to remove any residual solvent.19
Experimental design
The experimental protocol (#4141250315) followed the Animal Research: Reporting of In Vivo Experiments (ARRIVE) guidelines and was approved by the Committee on Animal Research of the Institution (Federal University of Santa Maria, Santa Maria, RS, Brazil).
Sixty adult male rats (Rattus norvegicus, albinus, Wistar) 90-days old (250–300 g) were housed at a controlled temperature (23±1°C), relative humidity (60%) with noise control (maximum 85 decibels) and a standard light-dark cycle (12 h). The animals were fed with regular rat pellets and distilled water ad libitum and were acclimatized to the laboratory environment for a period of 2 weeks before the experimental procedures.
The animals were allocated into 2 groups (30 per group) to evaluate the initial (3 days) and late (30 days) inflammatory response to matrix subcutaneous implantation. Computer software (Random Allocation Software, version 1.0, May 2004) was used to randomly allocate the animals into the experimental groups (Table 1). One study team member (RM) performed the randomization process. The surgical procedures were performed by one operator (PCP) in randomized sequence order. The operator made subcutaneous pockets and was then informed whether or not the animals received the nanofibrous matrix. All matrices presented the same coloration and thus avoided any potential bias.
TABLE 1.
Experimental Groups Description.
| Experimental groups | # of animals to evaluate initial inflammatory response: 3 days |
# of animals to evaluate late inflammatory response: 30 days |
|
|---|---|---|---|
| SHAM | One subcutaneous pocket (no matrix) | 5 | 5 |
| 1PDS | One PDS matrix | 5 | 5 |
| 1MET | One 25 wt.% MET PDS matrix per rat | 5 | 5 |
| 1CIP | One 25 wt.% CIP PDS matrix per rat | 5 | 5 |
| 2MET | Two 25 wt.% MET PDS matrices per rat | 5 | 5 |
| 2CIP | Two 25 wt.% CIP PDS matrices per rat | 5 | 5 |
PDS: polydioxanone, CIP: ciprofloxacin, MET: metronidazole.
The animals were anesthetized with intramuscular ketamine (70 mg/kg) and xylazine (6 mg/kg). The back of each rat was shaved and scrubbed with chlorhexidine (2%) and each rat was draped for sterile surgery. One incision (3 cm) was performed through the skin on the right side of the midline. For animals in the 2MET and 2CIP groups, one incision (3 cm) on each side of the midline with at least a 2-cm separating distance was made. For each incision, a pouch was created subcutaneously (3–4 cm2) using blunt dissection. One matrix (2 × 2 cm2) was implanted into each subcutaneous pouch, except for the SHAM animals. The skin incisions were subsequently stitched with non-resorbable 6.0 sutures (Ethicon) and adhesive strips (Leukostrip, Smith & Nephew Ltda., São Paulo, SP, Brazil).
At 3 and 30 days, the animals were anesthetized with an inhalation of isoflurane (3%) (Isoflurano, Instituto BioChimico Indústria Farmacêutica Limitada, Itatiaia, RJ, Brazil) in an oxygen carrier. Blood was collected by cardiocentesis (22G needle and a 5-ml syringe) in EDTA anticoagulant tubes. Euthanasia was performed by total exsanguination and the matrices were explanted together with the surrounding peri-implantation tissue to analysis. The specimens were sectioned in 2 equal segments. One segment was used to analyze the tissue oxidative status and the other segment was fixed in 4% buffered formalin (72 h) prior to histological analysis (Figure 1).
FIGURE 1.
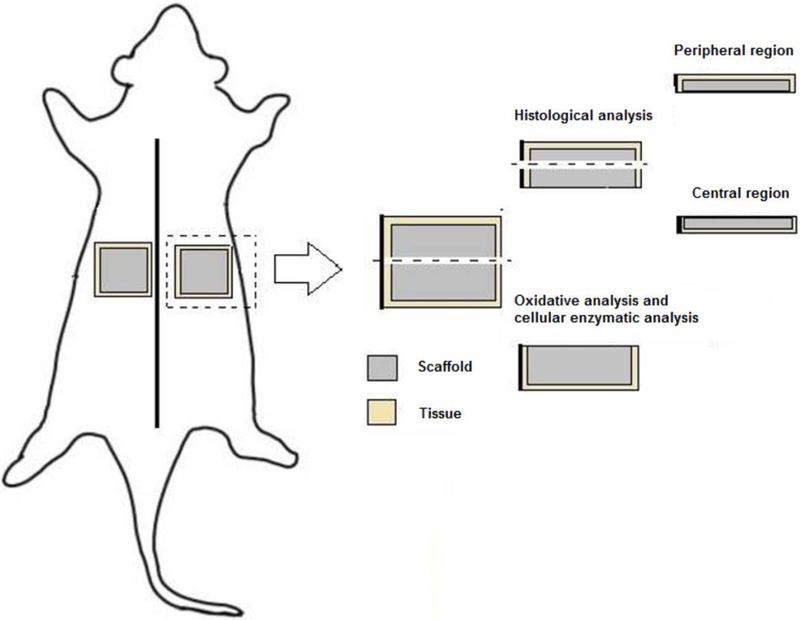
Schematic diagram of oxidative and histological analysis protocol.
Histological analysis
The segment used to provide histological analysis was cut into two identical pieces.21 These tissue segments contained the peripheral and center region (Figure 1) of the implantation bed. Further processing involved dehydration of the biopsies and paraffin embedding. Accordingly, from each animal, 2 consecutive 5-μm serial sections were cut from each segment (peripheral region and center of the biopsies). Hematoxylin and eosin (H&E) staining was used for the first section, and Masson’s trichrome (MT) (Sigma-Aldrich) and Picrosirius Red (PRed, Picrosirius Red Staining, Easy Path®, São Paulo, SP, Brazil) for the second and third sections, respectively.
The H&E sections were used to evaluate for the presence and degree of inflammatory cell response to the matrices. Three fields of view (100×) from the peripheral and central sections were observed and scored from verbal description using a 4-point scale22 considering polymorphonuclear leukocytes/mononuclear cells: 0=absent (no inflammatory cells); 1=mild or discrete (few inflammatory cells); 2=moderate (several inflammatory cells and increased reaction zone); and 3=intense or severe (increased reaction zone, occasional foci of neutrophil granulocytes and/or lymphocytes).23 This evaluation was performed by one calibrated examiner (JM) via double measurements of 10 specimens using a 1-week interval. The Kappa value was 0.95.
The MT stained sections were digitized at 200× magnification using optical microscopy (Axiovision; Carl Zeiss MicroImaging, Jena, Germany). From the left margin of the tissue sample, fields of view were numbered consecutively towards the right margin. On average, 14 fields were displayed. Of these, fields 7, 8, and 9 were selected to determine the percentage of area occupied by collagen fibers from the peripheral and central region, totaling 6 fields of evaluation per rat. The image of the fields was obtained using image-processing software (Zen lite 2012 blue edition, Carl Zeiss MicroImaging). The images were transferred to ImageJ software (v1.50i, National Institutes of Health, Bethesda, MD, USA), binarized and the percentage of area filled by collagen fibers was calculated.24 Descriptive analysis of collagen fiber type was performed in the same fields (7, 8 and 9) by polarized microscopy (Leica, model DM2000, Wetzlar, Germany) at 400× using sections dyed with PRed. The Figure 2 show the position of the analysis fields where the percentage of collagen fibers was performed.
FIGURE 2.
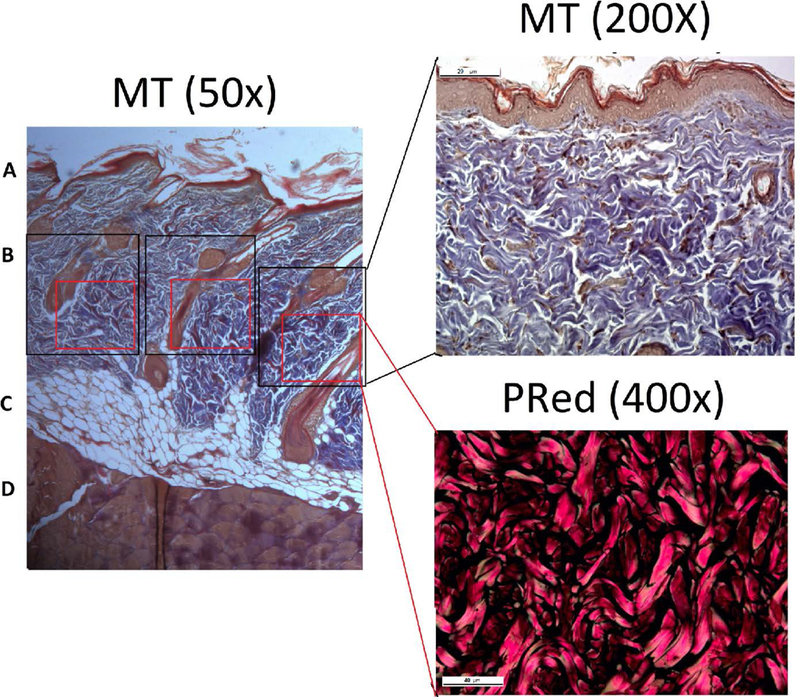
Localization of the collagen fibers percentage analysis using Masson’s trichrome (MT) and Picrosirius Red (PRed) dye. A. Epidermis. B. Dermis. C. Subcutaneous tissue. D. Muscle tissue.
All histometric analyses were performed by examiners (PCP and JM) who were blinded to the experimental groups.
ROS generation with DCH
The ROS levels were quantified using the oxidant-sensing fluorescent probe, 2,7-dichlorofluorescein diacetate (DCHF-DA).25 Oxidation (DCHF-DA) to fluorescent dichlorofluorescein (DCF) ratio was determined at 488 nm for excitation and 525 nm for emission. Tissue samples were added to a medium containing Tris—HCl buffer (0.01 mM, pH 7.4) and DCHF-DA was added to the solution for 1h until fluorescence measurements were obtained. DCF-RS levels were corrected by protein content26 and expressed as a percentage of values from control.
Oxidative cellular damage by protein carbonyl (PC) determination
Protein carbonyl (PC) determination is a type of protein oxidation that can be promoted by ROS, referring to a process that forms reactive ketones or aldehydes that can be reacted by 2,4-dinitrophenylhydrazine (DNPH) to form hydrazones. PC level was measured according to a previously established protocol27 with minor modifications. In brief, aliquots of tissue samples homogenized in Tris—HCl buffer (10 mM, pH 7.4) were mixed with 0.2 ml of DNPH (10 mM). After 1 h of incubation at RT in the dark, 0.5 ml of denaturing buffer (150 mM sodium phosphate buffer, pH 6.8, 3% SDS), 2 ml of heptane (99.5%) and 2 ml of ethanol (99.8%) were added sequentially, mixed for 40 s and centrifuged for 15 min. Thereafter, the protein isolated from the interface was washed twice with ethyl acetate/ethanol 1:1 (v/v) and suspended in denaturing buffer. Each sample was measured at 370 nm against the corresponding HCl sample (blank), and total carbonylation was calculated using a molar extinction coefficient of 22 000 M−1 cm−1.28 The results were expressed as nmol carbonyl/g tissue−1.
Oxidative cellular damage by lipidic peroxidation (LP) estimation
Lipidic peroxidation (LP), or the reaction of oxygen with unsaturated lipids, occurs when reactive oxygen species attack polyunsaturated fatty acids of the fatty acid membrane, initiating a self-propagating chain reaction. The destruction of membrane lipids and the end-products of such LP reactions are hazardous to cell viability. One product of LP is malondialdehyde (MDA), which presents a facile reaction with thiobarbituric acid (TBA), yielding an intensely colored fluorescent chromogen. LP was measured by the reaction of MDA with TBA.29 A pink chromogen was generated and spectrophotometrically measured at 532 nm. The TBARS levels (substances that react with TBA) were expressed as nmol of MDA g tissue.
Statistical analysis
The rat was the unit analysis. The degree of inflammatory cell response data were showed as median, minimum and maximum values. Distribution frequency of each score of degree of inflammatory cell response was calculated per rat (considering 6 evaluation fields). Then, the mean percentage of absent/mild (score of 0 and 1) and moderate/severe (score of 2 and 3) was calculated. The data of collagen fibers’ percentage, ROS, PC, and LP levels were presented as mean and standard deviation. Normality of the data was analyzed using the Shapiro-Wilk test. The intergroup analyses were performed with Two-way ANOVA and post hoc Duncan’ test. Differences were considered significant when p<0.05. The program Statistics 8.0 was used for all analyses.
RESULTS
No animal was lost during the experimental period, and no adverse effects were observed.
Degree of inflammatory cell response
The median (minimum and maximum) of the inflammation scores are presented in Table 2. At 3 days, the implantation of 2 MET matrices revealed higher median values. This finding agrees with the analyses of the mean percentage of fields presenting no or discrete inflammatory infiltration (score of 0 and 1), for which 2MET showed the lowest percentage 50%, thus being the only group that presented statistical difference from SHAM (p=0.041). In the other groups, the mean percentage of fields presenting no or discrete inflammatory infiltration were of 100%, 93.3%, 86.7%, 73.2%, and 66.6% for SHAM, PDS, 1MET, 1CIP, and 2CIP, respectively (Figure 3A), with no statistical difference between groups. At 30 days, 1MET, 2MET and 2CIP groups still had some area with moderate inflammation (Table 2). No statistically difference was observed between groups. Nearly all the groups presented 100% of no/discrete cellular infiltration, except 1MET, 2MET and 2CIP, which showed 96.6%, 90% and 90% of fields in this condition, respectively (Figure 3B). At both evaluation times (3 and 30 days), no rat showed any field with severe inflammation. Figure 4 and Figure 5 show representative H&E micrographs after 3 days at different magnifications.
TABLE 2.
Median Inflammation Scores (Minimum and Maximum) at 3 and 30 Days.
| SHAM | PDS | 1MET | 2MET | 1CIP | 2CIP | |
|---|---|---|---|---|---|---|
| 3 days | 1 (0–1) | 1 (1–2) | 1 (0–2) | 1.5 (0–2) | 1 (1–2) | 1 (1–2) |
| 30 days | 0 (0–1) | 0 (0–1) | 0 (0–2) | 1 (0–2) | 1 (0–1) | 1 (0–2) |
Score system from verbal description using a 4-point scale considering polymorphonuclear leukocytes/mononuclear cells: 0=absent (no inflammatory cells); 1=mild or discrete (few inflammatory cells); 2=moderate (several inflammatory cells and increased reaction zone); and 3=intense or severe (increased reaction zone, occasional foci of neutrophil granulocytes and/or lymphocytes). Sections were viewed at 100× and graded by a blinded and calibrated examiner. Five animals per group and time point were used.
FIGURE 3.
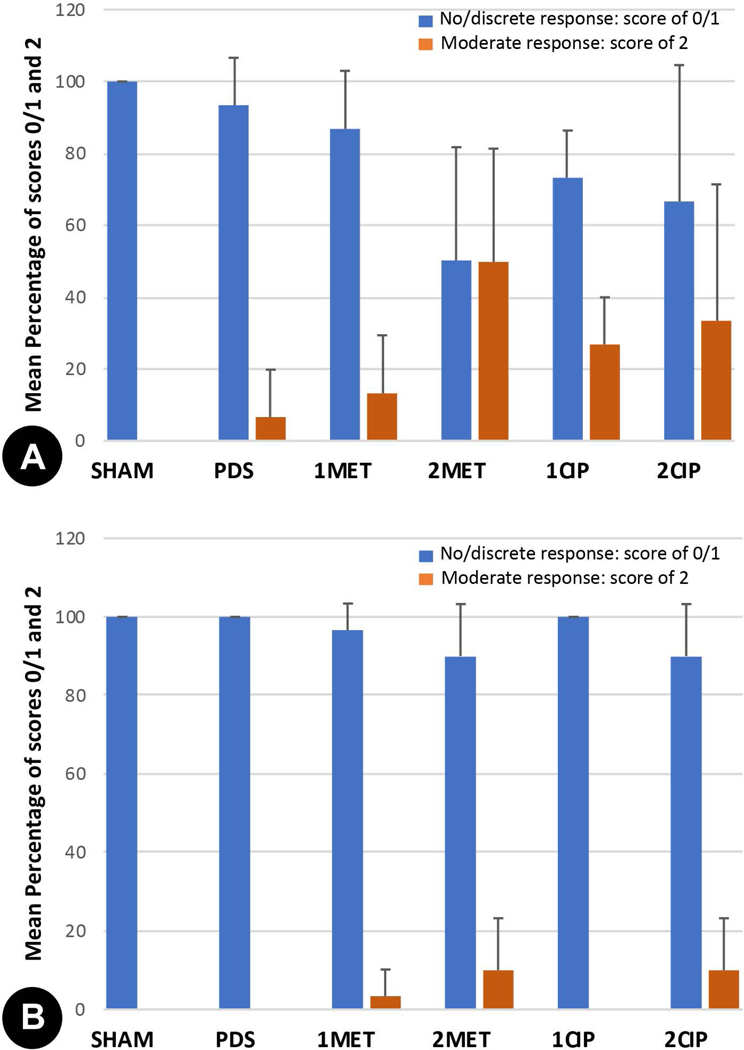
Mean percentage of absent/mild (score of 0 and 1) and moderate/severe (score of 2 and 3) inflammatory cell response in the experimental groups at (A) 3 days and (B) 30 days. Five animals per group and time point were used.
FIGURE 4.
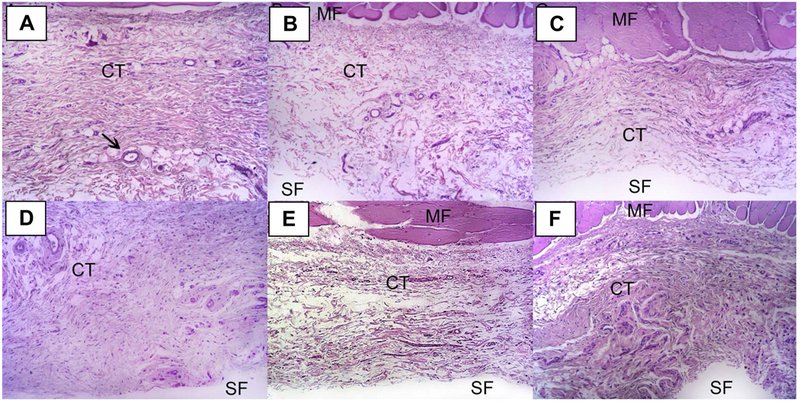
Representative images of H&E stained slides at 3 days (Lower magnification = 100×). General view of the histological section (MF: muscle fiber, CT: connective tissue, SF: matrix). All slides are oriented with skeletal muscle at the upper aspect. Black arrow indicates a blood vessel. (A) SHAM, (B) PDS, (C) 1MET, (D) 2MET, (E) 1CIP, and (F) 2CIP.
FIGURE 5.
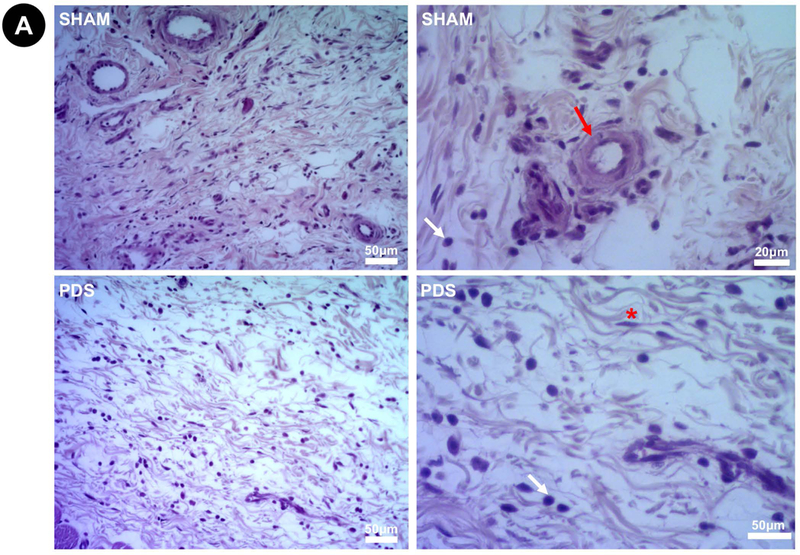
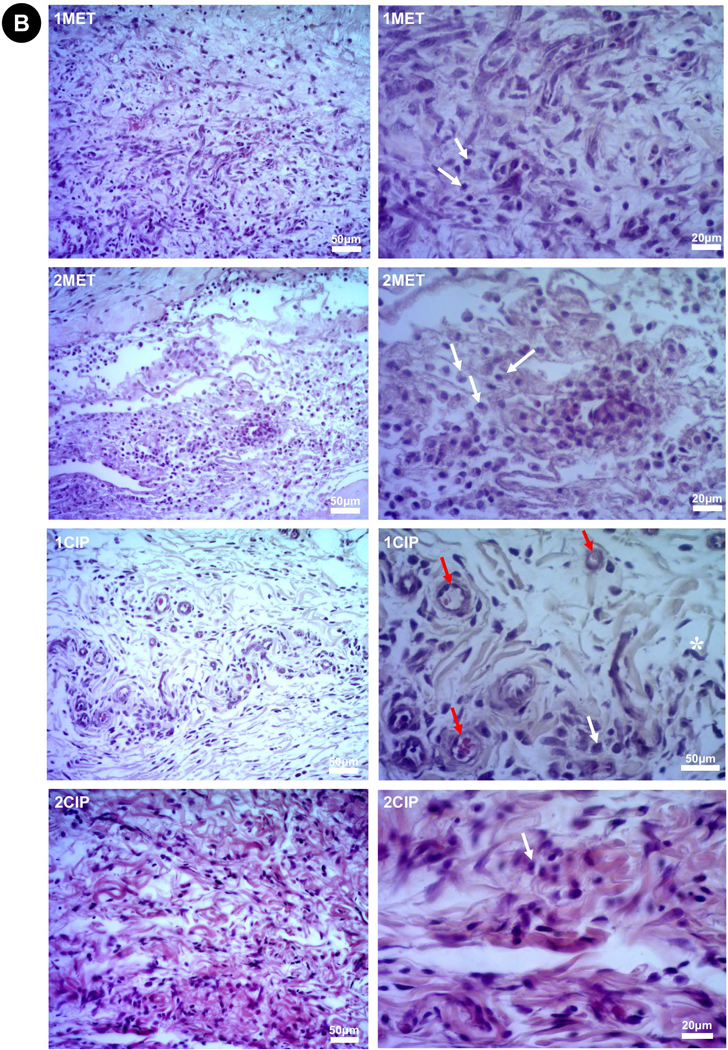
Representative images of H&E stained slides at 3 days (Higher magnifications = 200× left and 400× right). (A) Sham and PDS. (B) 1MET, 1CIP, 2MET, and 2CIP. The degree of inflammatory cell response was classified according to a score system from verbal description using a 4-point scale considering polymorphonuclear leukocytes/mononuclear cells: 0=absent (no inflammatory cells); 1=mild or discrete (few inflammatory cells); 2=moderate (several inflammatory cells and increased reaction zone); and 3=intense or severe (increased reaction zone, occasional foci of neutrophil granulocytes and/or lymphocytes). None of the groups showed severe inflammatory infiltrate. Red arrow (×): blood vessel; white arrow (×): inflammatory cells; asterisk (*): fibroblast.
Collagen fibers
Table 3 shows the mean percentage of collagen fibers in the groups at 3 and 30 days. At 3 days, the PDS matrices seemed to stimulate collagen production. 2MET, 2CIP and 1CIP showed lower statistically percentage of collagen fibers than PDS. All groups were statistically similar to the SHAM. The reduction percentage of collagen fibers when compared to SHAM, was 14.5%, 9.1% and 7.7% for 1CIP, 2CIP, and 2MET, respectively. Interestingly, between 3 and 30 days, the SHAM, 1CIP and 2CIP groups produced collagen, while the 1MET and 2MET maintained the same percentage of collagen fibers seen at 3 days. The 2MET group demonstrated a reduction of approximately 18%, in the collagen fiber percentage at 30 days when compared to the SHAM. The other groups (PDS, 1MET, 1CIP, 2CIP) were statistically similar to the SHAM. Most of the fibers were type I, dense, and thick. Few type III fibers, interlaced with type I fibers, were noted.
TABLE 3.
Mean Percentage of Collagen Fibers (standard deviation) at 3 and 30 Days.
| SHAM | PDS | 1MET | 2MET | 1CIP | 2CIP | |
|---|---|---|---|---|---|---|
| 3 days | 56.8 (5.0) | 66.9 (4.8) | 58.7 (7.4) | 52.4 (7.0)* | 48.6 (3.4)* | 51.6 (2.6)* |
| 30 days | 63.7 (7.0) | 60.7 (4.9) | 56.6 (4.2) | 51.8 (3.0)# | 62.6 (3.4) | 61.7 (3.6) |
One-way ANOVA and Tukey’s post hoc test (p<0.05). Five animals per group and time point were used.
At 3 days: No statistical difference was observed among antibiotics groups. All groups were statistically
similar to the SHAM. Groups with 2 antibiotics matrices (2MET, 2CIP) and the 1CIP group presented
statistically lower percentage of collagen fibers than PDS (*).
At 30 days: No statistical difference was observed among antibiotics groups. Only 2MET group
presented statistically lower collagen fiber percentage when compared to the SHAM (#). None of the
groups showed difference when compared to the PDS.
: represents statistically significant difference compared to PDS at 3 days.
: represents statistically significant difference compared to SHAM at 30 days.
Oxidative status profile
The oxidative status data are shown in Figure 6. At 3 days, the PDS matrices significantly increased the ROS levels (p<0.01) and cellular damage from LP (p<0.01) and PC (p=0.012) when compared to the SHAM. At 30 days, PDS and SHAM showed similar oxidative profile. At 3 days, the cellular damage from LP was in ascending order: SHAM=2MET<1MET=2CIP<1CIP<PDS (p<0.05). At 30 days, the antibiotic-eluting matrices presented lower LP levels when compared to the PDS or SHAM (p<0.05). Concerning PC levels at 3 days, CIP-eluting matrices showed similar behavior to the SHAM. The 2CIP was the only that presented PC levels lower statistically than PDS (p=0.02). At 30 days, all groups were statistically similar to the SHAM, with exception of 1CIP (p=0.025). In general, antibiotic-eluting matrices displayed a protective effect in terms of oxidative cellular damage with regard to LP analyses, but not in terms of PC when compared to antibiotic-free PDS matrices.
FIGURE 6.

Mean and standard deviation of the lipid peroxidation (LP) (A), protein carbonyl (PC) (B), reactive oxygen species (ROS) (C) levels in the experimental groups. Different lower-case letters represent statistical differences between groups at 3 days (p<0.05). Different upper-case letters represent statistical differences at 30 days (p<0.05). Two-way ANOVA and Duncan’s test. For example, at 3 days, PDS showed statistically higher LP levels when compared to all other groups; at 30 days, no difference was observed between PDS and SHAM, but LP levels were statistically higher than 2MET, 1CIP and 2CIP.
DISCUSSION
The aim of this study was to investigate the biocompatibility of PDS-based antibiotic-eluting matrices in a rat subcutaneous implantation model. Tissue response was evaluated based on the degree of inflammatory cellular response, percentage collagen fibers by histological analysis, and oxidative profile by biochemical analysis. Alterations during early inflammatory response (3 days) associated with the matrices without antibiotics were observed when compared to the SHAM. However, at 30 days, these alterations were nullified. Regarding the antibiotic-eluting matrices, the alterations were more prominent at 3 days for all outcomes. At 30 days, 1MET, 2MET and 2CIP did not reach the same inflammatory parameters as observed in PDS or SHAM groups, which showed 100% of no/discrete inflammatory cell response. Moreover, MET-eluting matrices impaired collagen fibers formation between 3 and 30 days.
A higher degree of inflammatory cellular response was observed when two incisions were performed (on each side of the midline) and two antibiotic-eluting matrices were implanted per animal. In the 2MET and 2CIP animals, one antibiotic matrix was implanted on each side of the midline, but the histological analysis was carried out from only one tissue side. Then, it is possible that the drug released from matrix localized on the left side reached the opposite side by tissue diffusion and/or bioavailability. Worth mentioning, tissue diffusion and bioavailability of a drug depends on pH, local vascularization, presence of a bacterial enzyme, and drug physical and chemical properties, such as size and molecular weight, charge, dissociation constants, liposolubility, and partition coefficient.30,31 Drugs administered subcutaneously can reach systemic circulation either by uptake via blood capillaries or indirectly by lymphatic vessels,32 and also can exhibit diffusion and advection into extracellular matrix before uptake by the lymphatic capillaries draining the site.31 Another plausible explanation for these differences is the fact that, regardless of the antibiotic-eluting matrix implantation, two incisions were performed, promoting higher tissue injury, and thus a greater inflammatory cell response at both implantation sites.
Oxygen reactive species (ROS) are produced in the mitochondria during respiratory chain electron transport, where they are rapidly transformed into more inactive species by the antioxidant defenses. However, increased production of ROS during the inflammatory process cannot be counteracted by a concomitant increase in antioxidant defenses, thus leading to cellular damage that can be measured as protein carbonylation and lipidic peroxidation. At the sites of inflammation, there is a considerable overproduction of various oxygen reactive species by activated neutrophils and macrophages. At 3 days, 2 MET was the only group that simultaneously produced higher cellular damage from oxidative mechanisms (PC and LP) when compared to the SHAM. In general, antibiotic-eluting matrices demonstrated similar or lower oxidative damage when compared to the antibiotic-free PDS-based counterparts. At 30 days, antibiotic-eluting matrices presented similar behavior to the PDS or SHAM groups.
With respect to collagen fibers, only MET-eluting matrices were associated with impaired collagen fibers’ formation during the experimental period, since the collagen lost during the initial inflammatory response was not regenerated. However, one should interpret these findings with caution, since 1MET showed an 11% reduction relative to SHAM; and a 6.7% reduction relative to PDS at 30 days. Since PDS is an FDA-approved bioresorbable synthetic polymer, such impairment (6.7%) should not be considered clinically significant. Therefore, although quantitative data obtained from pre-clinical studies cannot be applied directly to humans, one could anticipate a fairly similar behavior.
Although it was not the focus of the present study, our data show a discrete presence of multinucleated giant cells, which are characteristic of foreign body reaction, at 3 and 30 days for PDS, 1MET, 2MET, 1CIP and 2CIP (data not shown). No difference was verified among the groups. The discrete presence of this cellular type at 30 days might indicate that the biomaterial was not yet completely degraded.
In the present study, antibiotic-eluting PDS-based matrices were evaluated using a subcutaneous implantation model in the rat. The proposed matrices have been designed to be used to treat periodontal infection and/or to perform a barrier function as required in GTR/GBR regenerative approaches. Worth mentioning, the overall tissue response upon matrices’ implantation was investigated in the absence of a microbial challenge. Thus, it is possible that in the presence of bacterial infection, the antibiotic-eluting nanofibrous matrices could work reducing the inflammatory alterations when compared to the antibiotic-free PDS matrices; therefore, this issue should be considered in future studies.
CONCLUSIONS
Collectively, the findings of this study demonstrate that antibiotic-eluting biodegradable polymeric matrices did not result in significant damage to tissue healing beyond that obtained from surgical handling (SHAM) or the use of antibiotic-free (PDS only) matrices. Considering the previously established antimicrobial properties of the polymer-based matrices evaluated herein, the results from this biocompatibility study suggest that our antibiotic-eluting matrices may offer an attractive drug delivery system for treating periodontal infection. Further in vivo studies assessing not only bacterial reduction but also the overall tissue response within a more clinically relevant scenario (i.e., presence of infection) are warranted to confirm the clinical potential of the proposed antibiotic-eluting drug delivery systems.
Supplementary Material
Acknowledgments:
M.C. Bottino acknowledges funding from the National Institutes of Health (NIH)/National Institute of Dental and Craniofacial Research (NIDCR) (grants DE023552 and DEDE026578).
REFERENCES
- 1.Petersen PE, Ogawa H. The global burden of periodontal disease: towards integration with chronic disease prevention and control. Periodontol 2000 2012;60:15–39. [DOI] [PubMed] [Google Scholar]
- 2.Kassebaum NJ, Bernabé E, Dahiya M, Bhandari B, Murray CJL, Marcenes W. Global burden of severe periodontitis in 1990–2010: A systematic review and meta-regression. J Dent Res 2014;93:1045–1053. [DOI] [PMC free article] [PubMed] [Google Scholar]
- 3.Chiu HC, Chiang CY, Tu HP, Wikesjo UM, Susin C, Fu E. Effects of bone morphogenetic protein-6 on periodontal wound healing/regeneration in supralveolar periodontal defects in dogs. J Clin Periodontol 2013;40:624–630. [DOI] [PubMed] [Google Scholar]
- 4.Susin C, Wikesjo UM. Regenerative periodontal therapy: 30 years of lessons learned and unlearned. Periodontol 2000 2013;62:232–242. [DOI] [PubMed] [Google Scholar]
- 5.Münchow EA, Albuquerque MT, Zero B, Kamocki K, Piva E, Gregory RL, Bottino MC. Development and characterization of novel ZnO-loaded electrospun membranes for periodontal regeneration. Dent Mater 2015;31:1038–1051. [DOI] [PMC free article] [PubMed] [Google Scholar]
- 6.Yoshimoto I, Sasaki JI, Tsuboi R, Yamaguchi S, Kitagawa H, Imazato S. Development of layered PLGA membranes for periodontal tissue regeneration. Dent Mater 2018;34:538–550. [DOI] [PubMed] [Google Scholar]
- 7.Bottino MC, Thomas V, Schmidt G, Vohra YK, Chu TM, Kowolik MJ, Janowski GM. Recent advances in the development of GTR/GBR membranes for periodontal regeneration: a materials perspective. Dental Mater 2012;28:703–721. [DOI] [PubMed] [Google Scholar]
- 8.Gottlow J, Nyman S, Lindhe J, Karring T, Wennstrom J. New attachment formation in the human periodontium by guided tissue regeneration. Case reports. J Clin Periodontol 1986;13:604–16. [DOI] [PubMed] [Google Scholar]
- 9.Gottlow J, Karring T, Nyman S. Guided tissue regeneration following treatment of recession-type defects in the monkey. J Periodontol 1990;61:680–685. [DOI] [PubMed] [Google Scholar]
- 10.Bottino MC, Thomas V, Janowski GM. A novel spatially designed and functionally graded electrospun membrane for periodontal regeneration. Acta Biomater 2011;7:216–224. [DOI] [PubMed] [Google Scholar]
- 11.Susin C, Fiorini T, Lee J, De Stefano JA, Dickinson DP, Wikesjo UM . Wound healing following surgical and regenerative periodontal therapy. Peridodontol 2000 2015;68:83–98. [DOI] [PubMed] [Google Scholar]
- 12.Slots J, MacDonald ES, Nowzari H . Infectious aspects of periodontal regeneration. Periodontal 2000 1999;19:164–172. [DOI] [PubMed] [Google Scholar]
- 13.Bayramov DF, Neff JA. Beyond conventional antibiotics – New directions for combination products to combat biofilm. Adv Drug Deliv Rev 2017;112:48–60. [DOI] [PMC free article] [PubMed] [Google Scholar]
- 14.Kim K, Luu YK, Chang C, Fang D, Hsiao BS, Chu B, Hadjiargyrou M. Incorporation and controlled release of a hydrophilic antibiotic using poly(lactide-co-glycolide)-based electrospun nanofibrous scaffolds. J Control Release 2004;98:47–56. [DOI] [PubMed] [Google Scholar]
- 15.Cui W, Li X, Zhu X, Yu G, Zhou S, Weng J. Investigation of drug release and matrix degradation of electrospun poly)DL-lactide) fibers with paracetamol inoculation. Biomacromolecules 2006;7:1623–1629. [DOI] [PubMed] [Google Scholar]
- 16.Kenawy ER, Abdel-Hay FI, El-Newehy MH, Wnek GE. Processing of polymer nanofibers through electrospinning as drug delivery systems. Mater Chemistry Physics 2009;113:296–302. [Google Scholar]
- 17.Lee SJ, Heo DN, Moon JH, Ko WK, Lee JB, Bae MS, Park SW, Kim JE, Lee DH, Kim EC, Lee CH, Kwon IK. Electrospun chitosan nanofibers with controlled levels of silver nanoparticles. Preparation, characterization and antibacterial activity. Carbohydr Polym 2014;111:530–537. [DOI] [PubMed] [Google Scholar]
- 18.Münchow EA, Pankajakshan D, Albuquerque MT, Kamocki K, Piva E, Gregory RL, Bottino MC. Synthesis and characterization of CaO-loaded electrospun matrices for bone tissue engineering. Clin Oral Investig 2016;20:1921–1933. [DOI] [PMC free article] [PubMed] [Google Scholar]
- 19.Bottino MC, Kamocki K, Yassen GH, Platt JA, Vail MM, Ehrlich Y, Spolnik KJ, Gregory RL. Bioactive nanofibrous scaffolds for regenerative endodontics. J Dent Res 2013;92:963–969. [DOI] [PMC free article] [PubMed] [Google Scholar]
- 20.Bottino MC, Arthur RA, Waeiss RA, Kamocki K, Gregson KS, Gregory RL. Biodegradable nanofibrous drug delivery systems: effects of metronidazole and ciprofloxacin on periodontopathogens and commensal oral bacteria. Clin Oral Investig 2014;18:2151–2158. [DOI] [PMC free article] [PubMed] [Google Scholar]
- 21.Ghanaati S, Barbeck M, Detsch R, Deisinger U, Hilbig U, Rausch V, Sader R, Unger RE, Ziegler G, Kirkpatrick CJ. The chemical composition of synthetic bone substitutes influences tissue reactions in vivo: histological and histomorphometrical analysis of the cellular inflammatory response to hydroxyapatite, beta-tricalcium phosphate and biphasic calcium phosphate ceramics. Biomed Mater 2012;7:015005. [DOI] [PubMed] [Google Scholar]
- 22.Orstavik D, Mjor IA. Histopathology and X-ray microanalysis of the subcutaneous tissue response to endodontic sealers. J Endod 1988;14:13–23. [DOI] [PubMed] [Google Scholar]
- 23.Bavariya AJ, Andrew Norowski P Jr, Mark Anderson K, Adatrow PC, Garcia-Godoy F, Stein SH, Bumgardner JD. Evaluation of biocompatibility and degradation of chitosan nanofiber membrane crosslinked with genipin. J Biomed Mater Res B Appl Biomater 2014;102:1084–1092. [DOI] [PubMed] [Google Scholar]
- 24.Castro ML, Franco GC, Branco-de-Almeida LS, Anbinder AL, Cogo-Müller K, Cortelli SC, Duarte S, Saxena D, Rosalen PL. Downregulation of Proteinase-Activated Receptor-2, Interleukin-17 and Other Proinflammatory Genes by Subantimicrobial Doxycycline Dose in a Rat Periodontitis Model. J Periodontol 2016;87:203–210. [DOI] [PubMed] [Google Scholar]
- 25.Hempel SL, Buettner GR, ÓMalley YQ, Wessels DA, Flaherty DM Dihydrofluorescein diacetate is superior for detecting intracellular oxidants: comparison with 2’,7’-dichlorodihydrofluorescein diacetate, 5(and 6)-carboxy-2’,7’-dichlorodihydrofluorescein diacetate, and dihydrorhodamine 123. Free Radic Biol Med 1999;27:146–159. [DOI] [PubMed] [Google Scholar]
- 26.Lowry OH, Rosebrough NJ, Farr AL, Randall RJ. Protein measurement with the Folin phenol reagent. J Biol Chem 1951;193:265–275. [PubMed] [Google Scholar]
- 27.Yan LJ, Traber MG, Packer L. Spectrophotometric method for determination of carbonyls in oxidatively modified apolipoprotein B of human low-density lipoproteins. Anal Biochem 1995;228:349–351. [DOI] [PubMed] [Google Scholar]
- 28.Levine RL, Garland D, Oliver CN, Amici A, Climent I, Lenz AG, Ahn BW, Shaltiel S, Stadtman ER. Determination of carbonyl content in oxidatively modified proteins. Methods Enzimol 1990;186:464–478. [DOI] [PubMed] [Google Scholar]
- 29.Ohkawa H, Ohishi N, Yagi K. Assay for lipid peroxides in animal tissues by thiobarbituric acid reaction. Anal Biochem 1979;95:351–358. [DOI] [PubMed] [Google Scholar]
- 30.Cui L, Iwamoto A, Lian JQ, Neoh HM, Maruyama T, Horikawa Y, Hiramatsu K. Novel mechanism of antibiotic resistance originating in vancomycin-intermediate Staphylococcus aureus. Antimicrob Agents Chemother 2006;50:428–438. [DOI] [PMC free article] [PubMed] [Google Scholar]
- 31.Richter WF, Bhansali SG, Morris ME. Mechanistic determinants of biotherapeutics absorption following SC administration. AAPS J 2012;14:559–570. [DOI] [PMC free article] [PubMed] [Google Scholar]
- 32.Charman SA, McLennan DN, Edwards GA, Porter CJ. Lymphatic absorption is a significant contributor to the subcutaneous bioavailability of insulin in a sheep model. Pharm Res 2001;18:1620–1626. [DOI] [PubMed] [Google Scholar]
Associated Data
This section collects any data citations, data availability statements, or supplementary materials included in this article.


