SUMMARY
The non-canonical NF-κB signaling cascade is essential for lymphoid organogenesis, B-cell maturation, osteoclast differentiation, and inflammation in mammals1,2, whereas dysfunction of this system is associated with human diseases, including immunological disorders and cancer3–6. While controlled expression of NF-κB Inducing Kinase (NIK) is the rate-limiting step in non-canonical NF-κB activation2,7, mechanisms of inhibition remain largely unknown. Here, we report the identification of the sine oculis homeobox homolog family transcription factors SIX1 and SIX2 as essential inhibitory components of the non-canonical NF-κB signaling pathway. The developmentally silenced SIX-proteins are reactivated in differentiated macrophages by NIK-mediated suppression of the ubiquitin proteasome pathway. Consequently, SIX1 and SIX2 target a subset of inflammatory gene promoters and directly inhibit RelA and RelB trans-activation function in a negative feedback circuit. In support of a physiologically pivotal role for SIX-proteins in host immunity, human SIX1 transgene suppressed inflammation and promoted the recovery of mice from endotoxic shock. In addition, SIX1 and SIX2 protected RAS/p53-driven lung adenocarcinoma cells from inflammatory cell death induced by SMAC-mimetic chemotherapeutic agents, small-molecule activators of the non-canonical NF-κB pathway. Collectively, our study reveals a NIK-SIX signaling axis that fine-tunes inflammatory gene expression programs under both physiological and pathological conditions.
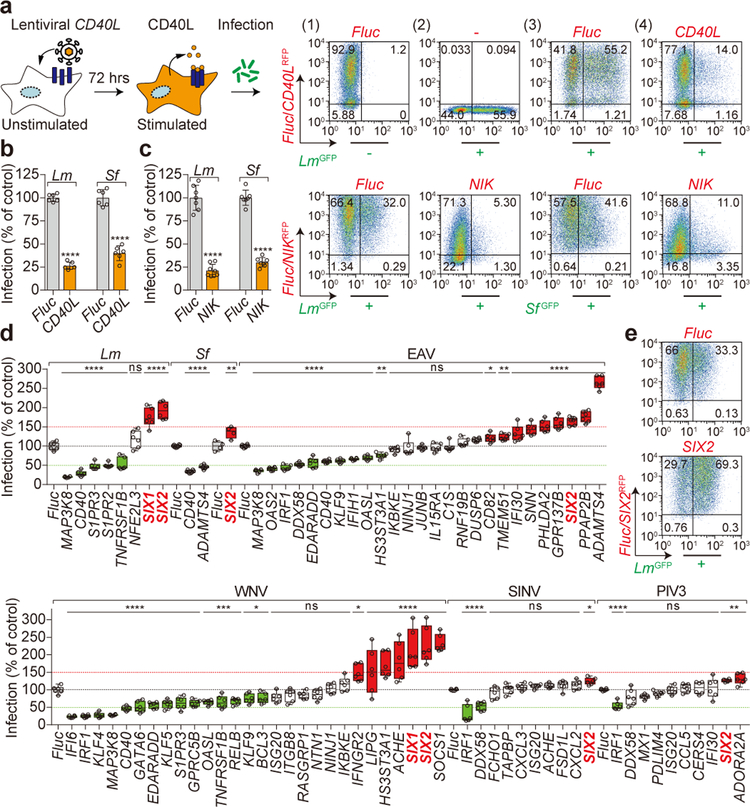
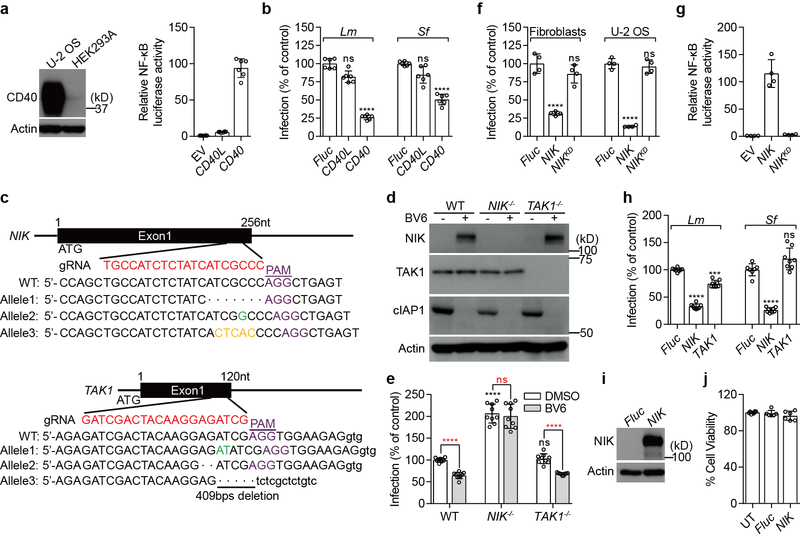
Our investigation into mechanisms of cell-autonomous immunity revealed that the sine oculis (so) homeobox gene family members SIX1 and SIX2 are integral components of the non-canonical NF-κB signaling pathway. Briefly, we found that long term exposure of U-2 OS cells with CD40 ligand (TNFSF5)8 restricted infection by two evolutionarily diverse intracellular pathogens, Gram-positive Listeria monocytogenes (Lm) and Gram-negative Shigella flexneri (Sf) (Fig. 1a, b). This cell autonomous immune mechanism was dependent on signaling through the non-canonical NF-κB kinase NIK (MAP3K14), but not the canonical NF-κB kinase TAK1 (MAP3K7) (Extended Data Fig. 1a–g). In addition, ectopic expression NIK, but not TAK1, potently inhibited bacterial infection (Fig. 1c and Extended Data Fig. 1h–j). Previous studies indicate that NIK also inhibits both positive- and negative-sense single stranded RNA viral infection9, suggesting that activation of the non-canonical NF-κB signaling pathway is broadly anti-microbial.
Figure 1. SIX-proteins exhibit immunomodulatory functions.
a, b, Diagram and data showing lentiviral delivery of CD40L/RFP into U-2 OS cells and its effect on GFP-expressing Lm infection. Representative flow cytometry scatter plots showing (1) luciferase (Fluc) RFP transduced uninfected cells, (2) untransduced LmGFP infected cells, (3) FlucRFP transduced cells infected with LmGFP, and (4) CD40LRFP transduced cells infected with LmGFP (a). Quantification of Lm and Sf infection of CD40L transduced cells as indicated (b). Bacterial infectivity was normalized to Fluc control (shown as 100%). Data are mean±s.d. from 6 independent experiments, ****P<0.0001, P values were derived from biological replicates using one-way ANOVA (GraphPad). The same statistics were applied to later studies unless otherwise stated. c, Fibroblasts transduced with Fluc or NIK lentivirus and then infected with GFP expressing Lm and Sf as indicated. Quantification of infection is presented as in b. Data are mean±s.d. from 6 independent experiments, ****P<0.0001. Representative flow cytometry scatter plots showing infection efficiency as described in a. d, Repeated trials of NIK-stimulated genes that inhibit (green) or enhance (red) infection by bacterial pathogens (Lm and Sf), +ssRNA viral pathogens (EAV: equine arteritis virus, WNV: West Nile virus, and SINV: Sindbis virus), and +ssRNA viral pathogen (PIV3: parainfluenza virus type 3). The relative percentage of pathogen infection was normalized to Fluc control (black dotted line). Data are presented as box and whisker plots, box is percentiles, black line is the population median, whiskers indicating the highest and lowest values (6 independent experiments). *P<0.05, **P<0.01, ***P<0.001, ****P<0.0001, ns: no significant difference. e, Representative flow cytometry scatter plots showing Lm infection efficiency in Fluc and SIX2 expressed fibroblasts as described in a. Data are representative of 6 independent experiments.
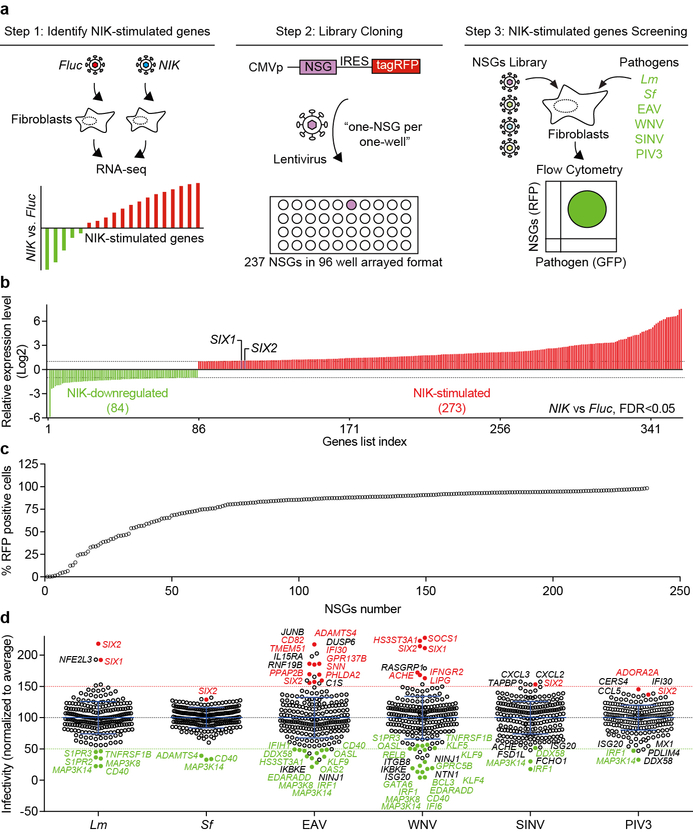
To identify key genetic factors involved in the anti-microbial response to non-canonical NF-κB pathway activation, we generated a cDNA library encompassing 237 genes induced by ectopic expression of NIK (mimicking the anti-microbial conditions in Fig. 1c). The rates of bacterial and viral infection were evaluated in host cells transduced with each of the 237 NIK-stimulated genes in a one-gene to one-well format (Extended Data Fig. 2, Table S1 and S2). A subset of NIK-stimulated genes reproducibly inhibited either bacterial or viral infection, including components of the non-canonical NF-κB signaling pathway (e.g. CD40, MAP3K8, and RelB) as well as anti-viral effectors (e.g. IRF1, OAS2, and IFI6) (Fig. 1d). However, two homologous genes, SIX1 and SIX2, specifically caught our attention because while these genes were activated by NIK, they induced an opposite phenotype to other NIK-stimulated genes by potently enhancing bacterial and viral infection of host cells (Fig. 1d, e).
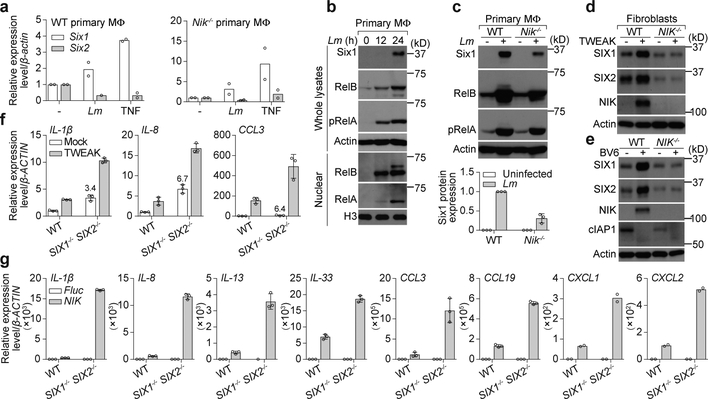
SIX1 and SIX2 are lineage specific transcription factors that define progenitor cell identity in developing organs and are thought to be silenced in adult tissues10,11. We sought to determine if endogenous SIX-proteins are reactivated in terminally differentiated immune cells under physiological infection conditions. Lm infection of primary Bone Marrow Derived Macrophage (BMDMs) stimulated Six1 transcription (~2 fold) and late phase Six1 protein accumulation (Fig. 2a–c). Interestingly, Six1 protein expression, but not mRNA induction, was potently suppressed in Lm infected BMDMs isolated from Nik−/− mice (Map3k14 gene knockout; Fig. 2a, c and Extended Data Fig. 3a). De novo SIX-protein synthesis was also observed in human fibroblasts stimulated with two distinct non-canonical NF-κB agonists: TWEAK, a TNF-family cytokine that signals through the FN14 receptor12, and BV6, a SMAC-mimetic compound that promotes rapid NIK protein accumulation through cIAP1/2 inhibition13,14 (Fig. 2d, e). Importantly, NIK−/− fibroblasts failed to express SIX-proteins under these conditions. Finally, we found that long-lasting treatment (24 hours) of cells with traditional canonical NF-κB pathway agonists (e.g. TNF and LPS) induced SIX1 and SIX2 through a mechanism requiring signaling cross talk with NIK15 (Extended Data Fig. 3b–e). These data indicate that NIK induces SIX-proteins expression under a variety of inflammatory conditions.
Figure 2. Reactivation of SIX1 and SIX2 by NIK results in inflammatory gene suppression.
a, qRT-PCR of total RNA isolated from WT or Nik−/− primary BMDMs infected with Lm (MOI=0.1) or treated with 25 ng/ml TNF for 24 hours. The relative gene expression was normalized to untreated control. Bars are the mean from 2 independent experiments and circles are the average of 2 technical replicates from each experiment. b, c, Levels of Six1 protein in WT or Nik−/− primary BMDMs infected with Lm (MOI=~0.1) for indicated time points (b) or for 24 hours (c). Whole cell lysate or nuclear extracts were probed with indicated antibodies by western blot. Quantification of Six1 protein levels (mean±s.d. from 3 independent experiments) in the indicated samples were normalized to WT cells (1.0). d, e, SIX1 expression levels in WT and NIK−/− fibroblasts treated with 50 ng/ml TWEAK (d) or 5 μM BV6 (e) for 24 hours and processed for western blot analysis as in b. f, qRT-PCR of total RNA isolated from WT and SIX1−/− SIX2−/− fibroblasts treated with 50 ng/ml TWEAK for 24 hours. The relative gene expression was normalized to WT untreated control and shown as mean±s.d. of 3 technical replicates from one experiment. Data are representative of 3 independent experiments. g, qRT-PCR of total RNA isolated from WT and SIX1−/− SIX2−/− fibroblasts transduced with Fluc or NIK lentivirus for 72 hours. The relative gene expression was normalized to WT Fluc transduced control and shown as mean±s.d. of 3 technical replicates from one experiment. Data are representative of 3 independent experiments. All western blot data are representative of 3 independent experiments. For gel source data, see Supplementary Figure 1.
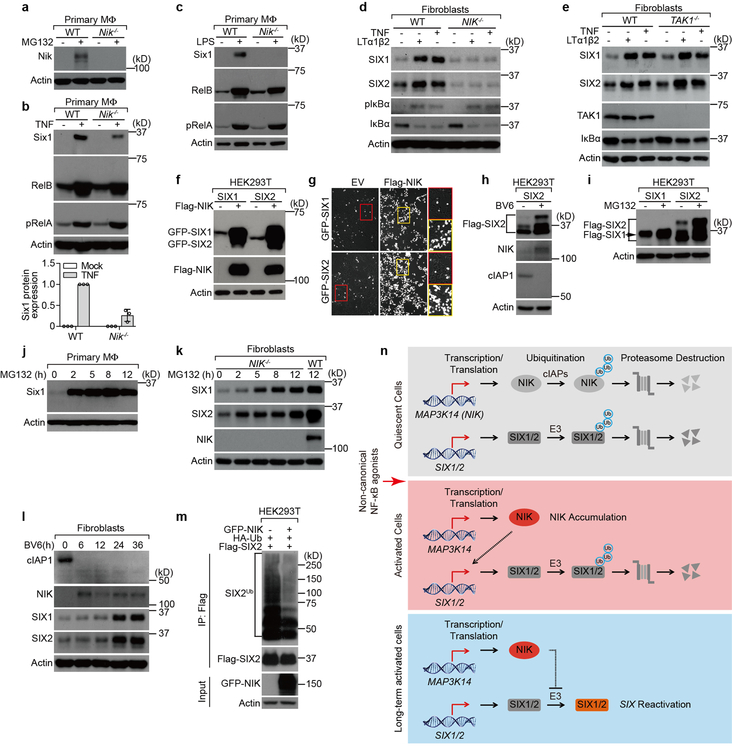
We noted that recombinant SIX1 and SIX2 proteins were expressed at unusually low levels when driven by a strong Cytomegalovirus (CMV) promoter (Extended Data Fig. 3f, g). Co-transfection of NIK or long-lasting treatment of cells with non-canonical NF-κB agonists induced CMV-driven SIX-proteins expression revealing a post-transcriptional mechanism of control (Extended Data Fig. 3f–h). Application of the 26S proteasome inhibitor MG132 also induced rapid accumulation of CMV-driven SIX-proteins in HEK293 cells and endogenous SIX-proteins in BMDMs and human fibroblasts suggesting that these proteins are constitutively marked for ubiquitin-mediated degradation16 (Extended Data Fig. 3i–k). Detailed kinetic analysis of endogenous SIX1 and SIX2 protein expression during non-canonical NF-κB pathway activation (Extended Data Fig. 3l) and investigation into the ubiquitination status of SIX2 (Extended Data Fig. 3m) revealed a concerted mechanism of SIX-protein reactivation: 1) induction of SIX gene expression through secondary transcription, and 2) SIX-protein stabilization through NIK-dependent inhibition of the ubiquitin/proteasome pathway (Extended Data Fig. 3n).
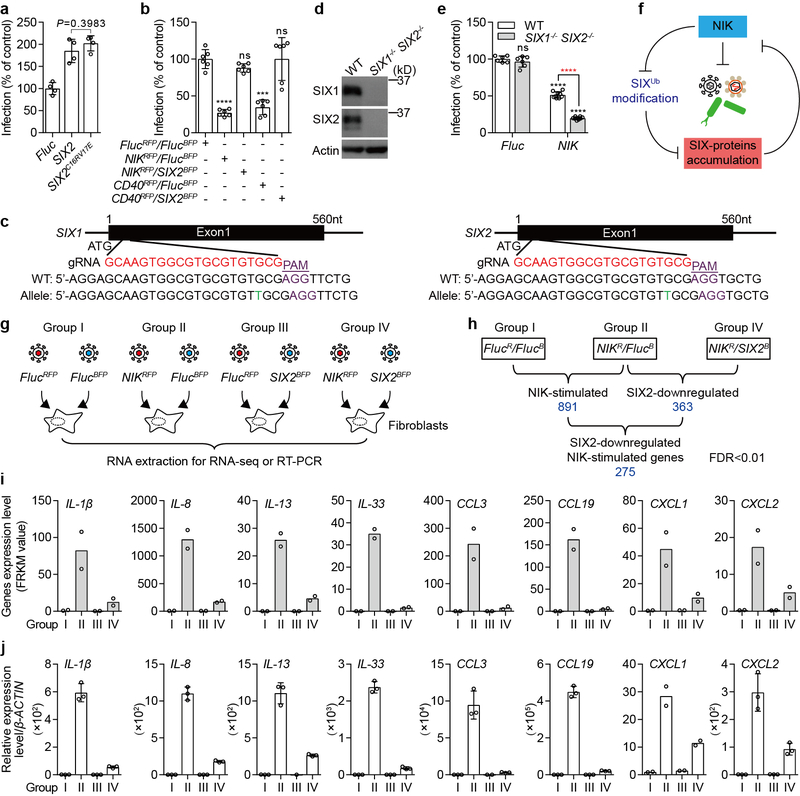
SIX-family members regulate gene expression programs in development17. However, mutations that prevented assembly of transcriptional co-activator complexes had no bearing on the immunological activity of SIX2 implying an alternative mechanism of action (Extended Data Fig. 4a)18. We found that SIX-proteins suppressed NIK-mediated immunity suggesting they may negatively regulate non-canonical NF-κB (Extended Data Fig. 4b–f). Whole genome RNA-seq was used to test this hypothesis. Chronic activation of non-canonical NF-κB by ectopic expression of NIK induced transcription of 891 genes, including those with primary and secondary inflammatory response signatures (Extended Data Fig. 4g, h and Table S3). Remarkably, nearly 30% of these genes were potently suppressed by SIX2, including cytokines and chemokines that harbor consensus κB transcriptional binding sites or that are indirectly stimulated by NF-κB (Extended Data Fig. 4i). Inhibition of IL-1β, IL-8, IL-13, IL-33, CCL3, CCL19, CXCL1, and CXCL2 by SIX2 was confirmed by quantitative PCR with reverse transcription (qRT-PCR) (Extended Data Fig. 4j). In addition, SIX1−/− SIX2−/− cells exhibited enhanced transcription of these genes after long term cytokine stimulation (Fig. 2f) or viral transduction of NIK (Fig. 2g), indicating that endogenous SIX-proteins negatively regulate inflammatory gene expression programs.
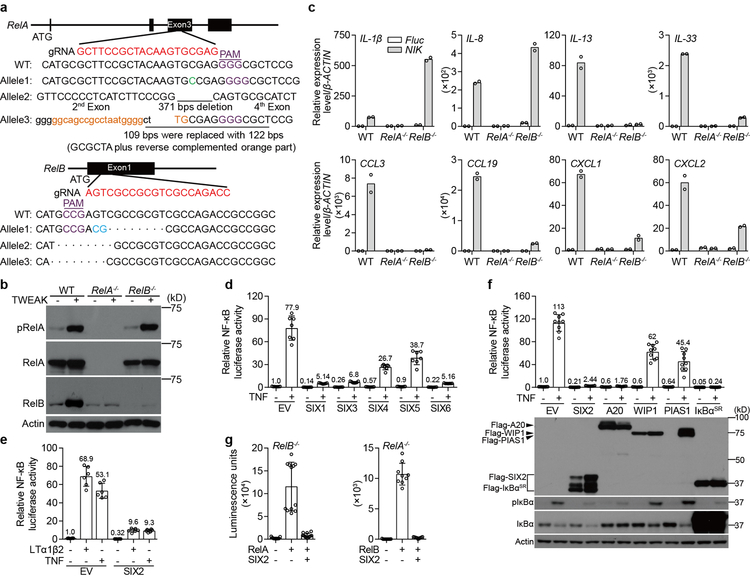
A subset of the SIX regulated genes were induced by the canonical NF-κB subunit RelA (e.g. IL-1β and IL-8) and others required non-canonical RelB (e.g. IL-13, IL-33, CCL3, CCL19, CXCL1, and CXCL2)2 (Extended Data Fig. 5a–c). To then determine if SIX-proteins inhibit multiple NF-κB isoforms as these data suggest, we analyzed luciferase reporter expression driven by 5×κB binding sites. Transient transfection of SIX-family members inhibited 5×κB-LUC stimulated by long term cellular application of canonical and non-canonical NF-κB agonists TNF and LTα1β2, respectively (Extended Data Fig. 5d, e). The potency of SIX2 was equivalent to well-known inhibitors of NF-κB including IκB super repressor and A20 and was much stronger than both WIP1 and PIAS1 (Extended Data Fig. 5f)19–22. Direct studies on RelA−/− and RelB−/− cells confirmed that the SIX-proteins suppress transcription by both the canonical and non-canonical NF-κB isoforms (Extended Data Fig. 5g). Thus, SIX1 and SIX2 are negative regulatory components of the non-canonical NF-κB pathway by virtue of their NIK-dependent expression, and not by differential recognition of RelA or RelB target genes.
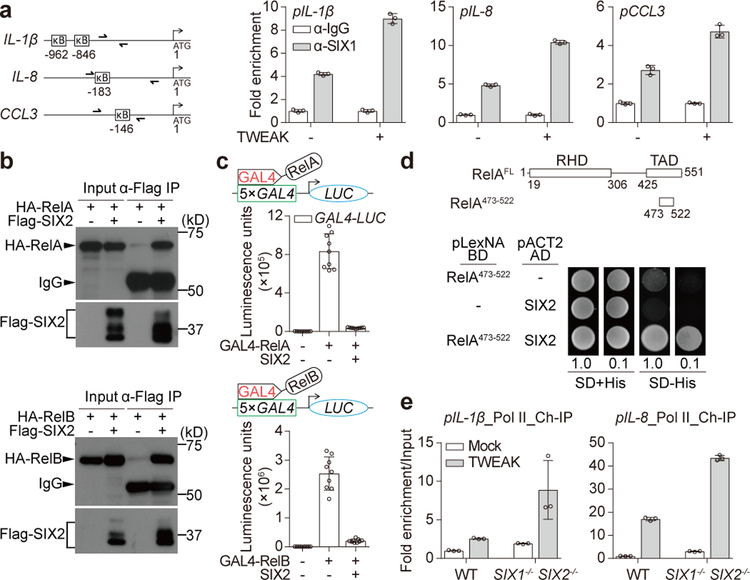
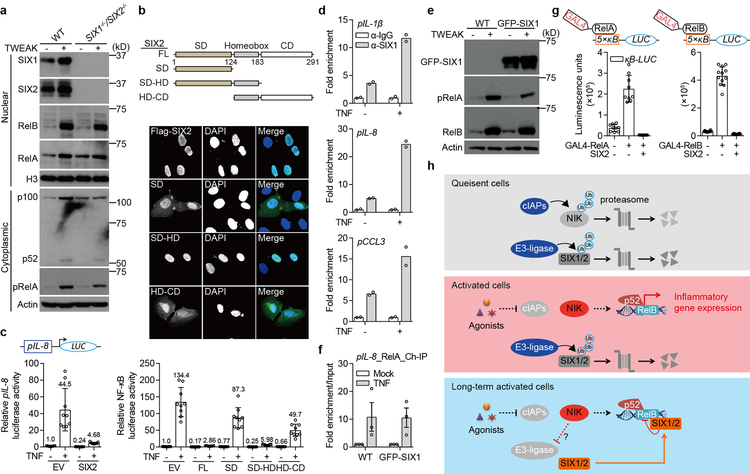
Mechanistic investigations suggested that SIX-proteins exhibit gene proximal inhibitory activities (Extended Data Fig. 6a–c). SIX1 bound promoter regions neighboring the κB sequence(s) of the IL-1β, IL-8, and CCL3 genes indicating it was primed for transcriptional inhibition (Fig. 3a and Extended Data Fig. 6d, e). Cytokine treatment induced further recruitment of SIX1 to these genes (Fig. 3a and Extended Data Fig. 6d). Importantly, the ability of SIX1 to occupy inflammatory gene promoters under both quiescent and stimulated conditions explains the observed increase in IL-1β, IL-8, and CCL3 mRNA expression in SIX1−/− SIX2−/− cells (see Fig. 2f).
Figure 3. SIX-family transcription factors directly inhibit promoter bound NF-κB.
a, ChIP qPCR analysis of SIX1 occupancy of the indicated genes from fibroblasts treated with mock or 50 ng/ml TWEAK for 2 hours. Location of each primer set compared to the gene start sites (ATG) and κB sites are shown (diagram). IgG control samples were normalized to 1.0 and relative fold enrichment of SIX1 is shown as mean±s.d. of 3 technical replicates from one experiment. Data are representative of 3 independent experiments. b, Western blot showing input and Co-Immunoprecipitation (Co-IP) of Flag-SIX2 and association with HA-RelA (upper blot) or HA-RelB (lower blot) expressed in HEK293T cells. c, Graph showing luminescence units from 5×GAL4-Luciferase reporter gene driven by RelA (upper) and RelB (lower) fused to GAL4 DNA-binding domain. Reporter constructs were co-transfected with or without SIX2 and measured after 48 hours as indicated. Data are mean±s.d. from 9 independent experiments. d, Yeast two hybrid analysis of SIX2 binding to RelA TAD domain. Diagram shows RelA domains (RHD: Rel homology domain, TAD: Transactivation domain). Yeast transformed with the indicated plasmids were serial diluted and spotted on SD/UWL− (SD+His) or SD/WHULK− (SD-His) used to detect His-reporter gene activation by protein-protein interactions (bottom). e, The relative fold enrichment of RNA Pol II on the indicated genes in mock or 50 ng/ml TWEAK (2 hours) treatment of WT or SIX1−/− SIX2−/− fibroblasts as in a. Mock treated WT fibroblasts were normalized to 1.0 by adjusting to “input DNA” that was saved prior to immunopreciptation. Relative fold enrichment of RNA Pol II is shown as mean±s.d. of 3 technical replicates from one experiment. Data are representative of 3 independent experiments. All western blot and yeast two hybrid data are representative of 3 independent experiments. For gel source data, see Supplementary Figure 1.
SIX-proteins formed a stable complex with nuclear RelA and RelB (Fig. 3b). Interestingly, this interaction did not affect recruitment of NF-κB to target gene promoters (Extended Data Fig. 6f). In addition, SIX2 inhibited both GAL4-RelA and GAL4-RelB activation of a 5×GAL4 luciferase reporter gene, a reconstituted system that measures NF-κB transcriptional activity independent of its DNA binding preference23 (Fig. 3c and Extended Data Fig. 6g). These data suggested that SIX-proteins inhibit the trans-activation function of NF-κB. In support of this conclusion, SIX2 directly interacted with the trans-activation domain of RelA (TAD; residues 473–522), the functional region of NF-κB that recruits chromatin remodeling enzymes and basal transcriptional machinery including RNA Pol II24 (Fig. 3d). Knockout of SIX1 and SIX2 increased RNA Pol II occupancy of IL-1β and IL-8 genes in both basal and cytokine treated fibroblasts (Fig. 3e). Collectively, these data support an inhibitory model by which SIX-proteins regulate the trans-activation function of NF-κB at inflammatory gene promoters in a negative feedback loop (Extended Data Fig. 6h).
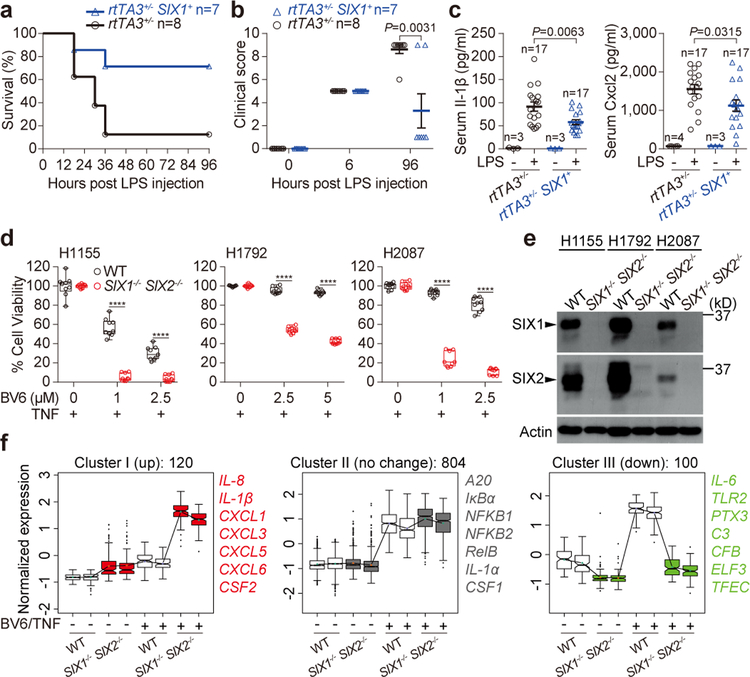
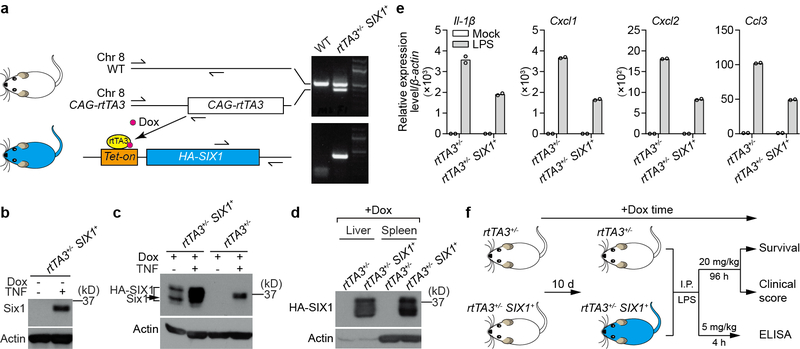
We next sought evidence that SIX-proteins suppress inflammatory gene expression programs in vivo. Knockout of Six1 or Six2 causes embryonic lethality10. We therefore adapted a doxycycline inducible system for broad tissue expression of human SIX1 transgene in adult mice (Extended Data Fig. 7a–d)25. Since doxycycline is a powerful antibiotic, we monitored the inflammatory response and progression of disease in mice exposed to bacterial lipopolysaccharide (LPS). SIX1 suppressed transcription of inflammatory mediators induced by LPS treatment of peritoneal macrophage ex vivo, indicating that the human transgene maintains its function across species (Extended Data Fig. 7e). Remarkably, expression of SIX1 provided nearly complete protection of mice from lethal LPS challenge as compared to littermate controls (Fig. 4a and Extended Data Fig. 7f). While the clinical signs of septic shock were indistinguishable between genotypes six hours post-LPS injection, SIX1 expressing mice made a near complete recovery over the time course of experiment (Fig. 4b). This recovery correlated with a reduction of inflammatory mediators in serum of SIX1 expressing mice (Fig. 4c). While these findings clearly indicate that SIX-proteins promote inflammatory resolution in vivo, we suspect that reactivation of SIX1 or SIX2 will have cell-type specific functions under physiological conditions associated with non-canonical NF-κB activation.
Figure 4. Physiological and pathological roles of the NIK-SIX signaling axis.
a, b, rtTA3+/− SIX1+ mice or littermate controls (rtTA3+/−) were challenged with LPS as described in Extended Data Fig. 7f. LPS-induced survival curve (a) and clinical score outcome (b) are representative of 3 independent experiments. The number of animals (n) are shown. Data are mean±s.e.m and P value was measured by two tailed unpaired Student’s t-test (b). c, serum Il-1β and Cxcl2 production in the indicated genotypes treated with LPS as described in Extended Data Fig. 7f. The number of animals (n) are shown. P value was measured by two tailed unpaired Student’s t-test. d, e, H1155 (left), H1792 (middle), or H2087 (right) cells were treated with 10 ng/ml TNF alone or in the presence of BV6 for 24 hours. Cell survival rate was normalized to the absence of BV6 control. Data are presented as box and whisker plots (9 independent experiments). Box is percentiles, line is the population median, and whiskers indicate the highest and lowest values. ****P<0.0001 (d). Western blot showing endogenous SIX1 and SIX2 expression in the indicated cells (e). Data are representative of 3 independent experiments. f, RNA-seq data from WT and SIX1−/− SIX2−/− H1792 cells treated with mock or 5 μM BV6 plus 25 ng/ml TNF for 24 hours. 1024 genes were significantly induced by BV6/TNF treatment in WT cells (statistical test is presented in methods). 120 out of 1024 genes were significantly upregulated (left), 804 genes were unchanged (middle), and 100 genes were downregulated (right) in SIX1−/− SIX2−/− cells. The representative genes were listed. Data are from 2 independent experiments and presented as box and whisker plots. Box is percentiles and line is the population median from the indicated number of genes. For gel source data, see Supplementary Figure 1.
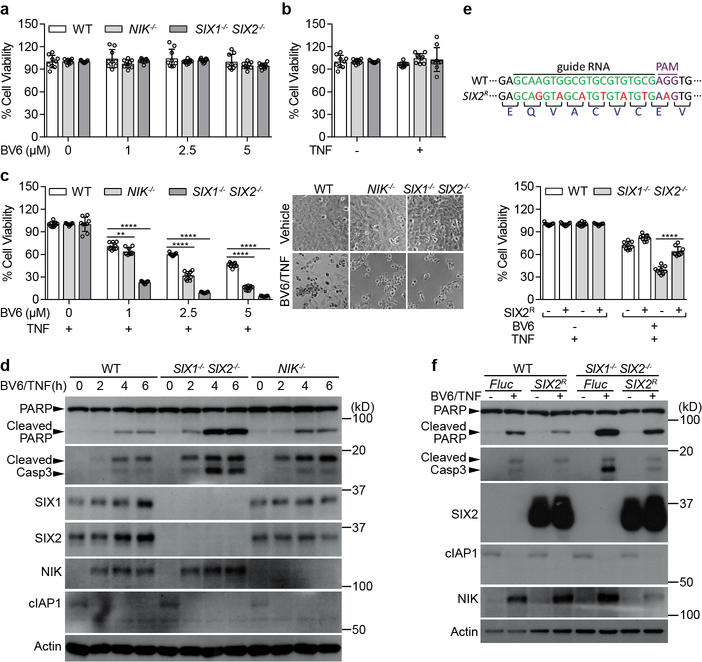
We then searched for a second, alternative line of evidence that SIX-proteins regulate biological systems associated with non-canonical NF-κB function. Previous studies indicate that combinatorial application of SMAC-mimetic compounds (e.g. BV6) and TNF promotes cancer cell death, including Non-Small Cell Lung Cancer (NSCLCs), through non-canonical NF-κB activation13,14,26–28. However, many NSCLCs are resistant to death induced by BV6 and TNF, an observation that has limited the therapeutic efficacy of these compounds27,29,30. A potential mechanistic explanation for resistance of cancer cells to SMAC-mimetics emerged from our studies on SIX-proteins. Specifically, we identified three RAS and p53-driven NSCLC cell lines (H1155, H1792 and H2087) that were refractory to combined BV6/TNF induced cell death, and exhibited high levels of endogenous SIX1 and SIX2 protein (Fig. 4d, e). CRISPR-Cas9 knockout of SIX1 and SIX2 dramatically sensitized these NSCLCs to BV6/TNF (Fig. 4d, e). The anti-apoptotic function of SIX-proteins was also observed in SV40 immortalized fibroblasts and U-2 OS osteosarcoma cells (Extended Data Fig. 8, 9a–g). We confirmed that SIX1 and SIX2 suppressed Caspase-8 mediated cell death in these cell lines (Extended Data Fig. 9h–j).
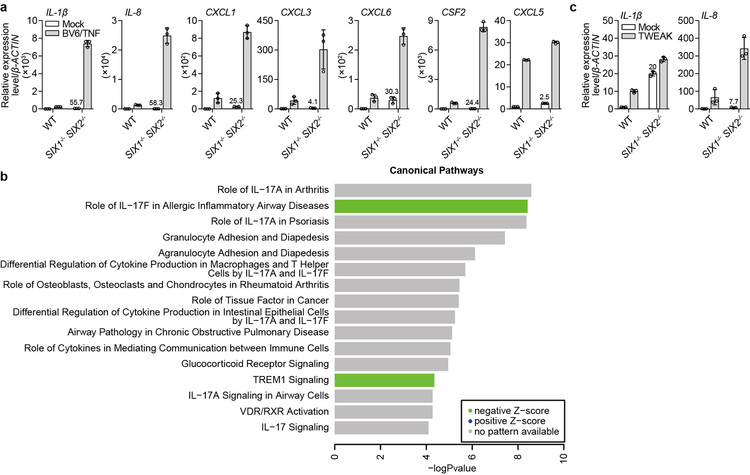
To broadly investigate if the protective effects of SIX-proteins arise from regulation of gene expression programs, WT and SIX1−/− SIX2−/− H1792 NSCLCs were treated with BV6/TNF and processed for RNA-seq. Over 90% of the analyzed transcripts were unaltered by BV6/TNF treatment. However, of the 1024 genes induced greater than 2-fold (false discovery rate, FDR<0.05) by BV6/TNF treatment of WT cells, 120 were significantly upregulated in SIX1−/− SIX2−/− cells (cluster 1, Fig. 4f, Extended Data Fig. 10a and Table S4). Cluster 1 genes had a strong inflammatory response signature with enrichment of transcripts from cytokines and chemokines with experimentally verified κB binding sites (Extended Data Fig. 10b). A large percentage of cluster 1 genes were also upregulated in unstimulated SIX1−/− SIX2−/− cells (Fig. 4f, Extended Data Fig. 10a, c), which is consistent with SIX promoter occupancy and inflammatory gene transcription profiles observed in non-cancer cells (Fig. 2f, 3a). In addition, SIX-proteins suppressed only a subset of κB target genes as 78% of transcripts induced by BV6/TNF were unaltered between wild-type and SIX1−/− SIX2−/− (cluster 2, Fig. 4f and Table S5, 6). Together, these data provide an unbiased conformation that SIX1 and SIX2 regulate gene specific transcriptional responses induced by non-canonical NF-κB under both physiological and pathological conditions.
In summary, we have established that SIX-family transcription factors function as immunological gatekeepers, dampening the promoter activity of inflammatory genes in response to persistent non-canonical NF-κB pathway activation. In support of this mechanism, reactivation of SIX1 and SIX2 in immune cells is coupled to NIK protein accumulation caused by chronic cytokine stimulation or pathogen infection. In addition, expression of SIX1 and SIX2 directly inhibits the transactivation function of RelA and RelB in a negative feedback loop (Extended Data Fig. 6h). These findings not only connect the non-canonical NF-κB signaling pathway to a mechanism of transcriptional repression, but also indicate that disruption of this response circuit may have important consequences on the pathogenesis of human disease, including cancer1,4,5.
METHODS
Plasmids and reagents
Flag-tagged constructs were generated by cloning indicated genes into NotI and SalI sites of pCMV-6b-Flag backbone using Gibson Assembly Master Mix (E2611, NEB). RelA, and RelB were cloned into BamHI and NotI sites of pEBB-HA. GFP-tagged constructs were assembled by cloning indicated genes into EcoRI and BamHI sites of pEGFP-C2. NIK-stimulated genes and other indicated genes were cloned into TRIP.CMV.IVSβ.GENE.ires.TagRFP destination vector31 using Gateway® LR Clonase™ II (11791, Invitrogen). The pRK5-HA-Ub plasmid was a gift from Ted Dawson (17608, Addgene). GAL4-RelA and GAL4-LUC plasmids23 were kindly provided by Dr. Eric Olson (UT Southwestern Medical Center). GAL4-RelB was assembled by cloning full length RelB into EcoRI and XbaI using Gibson. NF-κB luciferase plasmid, containing 5 units of κB enhancer elements, was obtained from Agilent technology (219077). NIK kinase dead (K429/430A)32 and IκBSR (S32/36A)19 mutants were generated by mutagenesis of indicated amino acids. All gene cloning was verified by sequencing.
Recombinant TNF (210-TA, R&D), LTα1β2 (L5162, Sigma) and TWEAK (SRP4360, Sigma) were reconstituted in sterilized PBS containing 0.1% BSA. LPS (L2880, Sigma) was reconstituted in sterilized double-distilled H2O. Doxycycline (D9891) was purchased from Sigma. BV6 (B4653, Apexbio), Z-VAD (FMK007, R&D), and Z-IETD (ALX-260–020-M001, Enzo) were dissolved in DMSO. X-tremeGENE9 transfection reagent was purchased from Roche. Following antibodies were used in this study: anti-Flag (A8592, Sigma), anti-Actin (A2066, Sigma), anti-HA (MMS-101P, Covance), anti-GFP (632592, Clontech), anti-pIκBα (2859, Cell Signaling), anti-IκBα (4814, Cell Signaling), anti-NIK (4994, Cell Signaling), anti-SIX1 (12891, Cell Signaling), anti-RelA (8242, Cell Signaling; sc-372x, Santa Cruz), anti-pRelA (3033, Cell Signaling), anti-RelB (sc-226x, Santa Cruz), anti-p100/52 (sc-7386, Santa Cruz), anti-H3 (ab1791, Abcam), anti-PARP (9542, Cell Signaling), anti-cleaved caspase-3 (9664, Cell Signaling), anti-TAK1 (MAB5307, R&D; #4505, Cell Signaling), anti-cIAP1 (AF8181, R&D) anti-SIX2 (11562–1-AP, Proteintech), anti-CD40 (ab13545, Abcam), anti-Pol II (39097, Active motif), and Rabbit normal IgG (12–370, Millipore).
Mice, mice experiments, ELISA, peritoneal macrophages and BMDMs preparation
All mice in this study were bred and maintained under pathogen-free conditions in the animal care facility at UT Southwestern Medical Center. All experiments were performed according to experimental protocols approved by the Institutional Animal Care and Use Committee and complied with all relevant ethical regulations. Nik−/− mice were obtained from Jackson Laboratory (#025557)33. Tet-O-HA-SIX1 embryos were kindly provided by Dr. Heide Ford (University of Colorado) and revived at UT Southwestern Medical Center transgenic core. Line #6239 was confirmed by PCR (primer sets are shown in Extended Data Fig. 7a)25 and then intercrossed with CAG-rtTA3 line (#016532, Jackson laboratory) to obtain the rtTA3+/− and rtTA3+/− SIX1+ mice. Age- and gender-matched littermates were used for further experiments.
6–7 weeks old rtTA3+/− or rtTA3+/− SIX1+ mice were given 2 mg/ml doxycycline water containing 10 g/L sucrose for 10 days (Dox water was refreshed 3–4 days). Mice were then injected with indicated dosage of LPS through intraperitoneal (I.P.) route. For survival and recovery assays, mice were monitored according to approved animal protocol and the survival rate was recorded at the indicated time post LPS injection. Mice were given a clinical score and then euthanized at the end point of experiment (96 hours post injection). Clinical score was given according to physical conditions induced by LPS including hunched posture, reduced mobility, ability to obtain food/water, and dehydration. The score range was from 0–9 (0: mouse was indistinguishable from untreated control, 9: mouse exhibited extreme sickness classified as moribund and was euthanized as the humane end point of the experiment). To measure Il-1β and Cxcl2 production, mice blood samples were collected and serum was isolated using 1.1ml Z-Gel microtube (41.1378.005, Sarstedt) at 4 hours post injection. Quantikine or Duoset ELISA kit was used to measure the production of Il-1β (MLB00C, R&D) and Cxcl2 (DY452–005, R&D). Experiments were performed according to manufacturer’s instructions. The absorbance units were measured by FLUOstar OPTIMA (BMG LABTECH).
Peritoneal macrophages were isolated from rtTA3+/− and rtTA3+/− SIX1+ mice as described previouly34. Briefly, mice were euthanized by CO2. 7–8 ml sterilized cold PBS was injected into cavity through peritoneal wall. Cell suspension fluid was aspirated from peritoneum and pelleted using 1000×g for 3 minutes. Cells were then seeded in poly-lysine pretreated 12-well-plate and cultured in DMEM media in the presence or absence of 2 μg/ml doxycycline. After 24 hours, adherent cells were used for LPS administration.
To obtain primary bone marrow derived macrophages (BMDMs), bone marrow cells were collected from 6-week-old wild type C57BL/6NJ, Nik−/−, rtTA3+/− or rtTA3+/− SIX1+ mice’ femurs and tibiae. Red cells were eliminated by applying 1×RBC buffer (TNB-4300-L100, TONBO biosciences). Cells were then cultured and differentiated in DMEM supplemented with 10% FBS and 10% conditional media of L929 cell culture for 6–7 days. 2×10⁵ differentiated primary BMDM cells were seeded in 12-well-plate for Lm infection, cytokines treatment, or LPS administration. All cells were grown at 37°C in a 5% CO2 incubator.
Cell lines
SV40-immortalized STAT1−/− fibroblasts were kindly provided by Dr. Jean-Laurent Casanova, Rockefeller University and were cultured in RPMI (Gibco) supplemented with 10% FBS and 1×NEAA. HCT116 (ATCC), U-2 OS (ATCC), HEK293A (Jack Dixon, University of California, San Diego) and HEK293T (Paul Bieniasz, Aaron Diamond AIDS Research Center) cells were cultured in DMEM (Gibco) supplemented with 10% FBS (Gibco or Sigma) and 1×NEAA (Gibco). NSCLC cell lines H1155 (KRASA183T(Q61H), TP53 G818A(R273H), PIK3CAC2529G(D843E), DDR2C187T(L63L, splice site) and PTENC697T(R233*)), H2087 (NRASC181A(Q61K), TP53G469T(V157F), ALKT1657G(S553A), and BRAFC1789G(L597V)), and H1792 (KRASG34T(G12C) and TP53splice site) were kindly provided by Dr. John Minna (UT Southwestern Medical Center) and were cultured in RPMI supplemented with 10% FBS and 1×NEAA. Indicated knock out or stable cell lines were generated as described below. All cells were grown at 37°C in a 5% CO2 incubator.
Lentivirus production and transduction
For lentivirus production, 4×10⁵ HEK293T cells were seeded in each well of poly-lysine coated 6-well-plate. 1 μg of indicated lentiviral expressing genes, 0.8 μg HIV gag-pol, and 0.2 μg vesicular stomatitis virus glycoprotein (VSV-G) were transfected into HEK293T cells by X-tremeGENE 9. The transfection media was replaced with fresh DMEM/3% FBS/1×NEAA after 6 hours. Lentiviral particles were collected at 48 hours and 72 hours. Pooled supernatants were cleared by centrifugation at 1500 rpm for 5 minutes. Supernatants, supplied with 20mM HEPES and 4 μg/ml polybrene, were stored in −80°C.
For lentivirus transduction, 7×10⁴ fibroblasts, HEK293A or U-2 OS cells were seeded in each well of 24-well-plate. Cells were transduced with indicated lentivirus in transduction media (RPMI or DMEM supplemented with 3% FBS, 20 mM HEPES and 4 μg/ml polybrene) by spinning 1000×g for 45 minutes at 37°C. The transduction media was replaced with culture media after 6 hours. Transduced cells were split into duplicate after 48 hours transduction, followed by bacteria and virus infection assay.
Bacteria and virus infection
To generate GFP expressing Shigella, Shigella flexneri M90T was transformed with pBBRMCS1-GFP plasmid. GFP expressing Listeria monocytogenes 10403s strain was a gift from Dan Portnoy (University of California, Berkeley). For Shigella infection, bacteria were grown in BHI broth media (237500, BD science) supplemented with 5 μg/ml chloramphenicol (CAM) at 30°C with 200 rpm shaking for overnight. Bacteria were then diluted 1:25 into BHI/5 μg/ml CAM and incubated at 37°C for about 2 hours (OD600=~0.5). Bacteria were washed with PBS and then suspended in PBS/0.03% Congo red (C6277, Sigma) and incubated at 37°C for 15 minutes. Bacteria (MOI of 10:1) suspensions were inoculated to each well of 24-well-plate, followed by centrifugation at 1000×g for 10 minutes. Infected cells were then incubated at 37°C in a 5% CO2 incubator for 1.5 hours. Extracellular bacteria were killed by replacing the media supplemented with 50 μg/ml gentamicin. After 8 hours incubation, cells were collected for flow cytometry analysis. For Listeria infection, bacteria were cultured overnight in BHI at 30°C without shaking and (MOI of 10:1) suspensions were inoculated to each well of 24-well-plate (for U-2 OS cells, centrifugation at 1000×g for 7 minutes was performed to help Listeria adhesion) and incubated for 1.5 hours. Cells were then incubated for 4.5 hours after replacing with gentamicin-contained media.
Viral infection was performed as previous described9. Briefly, all viruses were suspended in RPMI media supplemented with 1% FBS/1×NEAA. Cells were infected by adding 200 μl virus suspensions to each well of 24-well-plate (MOI of 0.5:1) and then incubated after adding 800 μl RPMI media supplemented with 10% FBS/1×NEAA for the indicated time periods: EAV (19 hours, 1 hour infection+18 hours incubation), WINV (25 hours, 1+24), PIV3 (16 hours, 3+13), and SINV (10 hours, 1+9).
Flow Cytometry and data analysis
To quantify bacterial and viral infection efficiency, infected cells were detached by 37°C warmed Accumax (Sigma), followed by centrifugation at 800×g for 2 minutes. Cells were then fixed by suspending in PBS/1% PFA at 4°C for at least 30 minutes. Cells were then stored in PBS/3% FBS. The Stratedigm S1000 flow cytometry was used to distinguish the RFP-, BFP-, or GFP-expressed cells. All flow cytometry generated raw data was analyzed by FlowJo 10.0.6. For most part of analysis, we gated live cells, single cell population from live cells, and then RFP positive cells from single cell population. Finally, we gated the GFP positive units from RFP positive population. For RFP-, BFP-, or GFP-expressed experiments, we gated cells that expressed both RFP and BFP to analyze GFP expressed population.
CRISPR-Cas9 gene editing cell lines
The RelA, RelB, NIK, TAK1, or SIX1/SIX2 guide RNA (the guide targets both SIX1 and SIX2 genes) was cloned into lenti-CRISPR v2 vector35 (Dr. Feng Zhang, Addgene 52961) according to the protocol. Lentivirus was produced as described above. 7×10⁴ fibroblasts, U-2 OS, H1155, H1792, or H2087 cells were transduced with indicated lentivirus and incubated for 48 hours. Transduced cells were then selected with 2 μg/ml (fibroblasts and U-2 OS) or 5μg/ml (H1155, H1792, and H2087) puromycin for 7 days. Single colony cells were sorted by flow cytometry. Homozygote knockout cells were then determined by genotyping and western blot. Knock out of SIX1 and SIX2 in H1155, H1792, and H2087 resulted from a single T insertion to both alleles as shown in Extended Data Fig. 4c.
Lm infection-, cytokines and LPS stimulation- and drug treatment-induced SIX-proteins accumulation
For Lm-, cytokines-, LPS or drug-induced endogenous SIX1 and SIX2 protein accumulation, 1×10⁵ WT, NIK−/−, TAK1−/− fibroblasts or 2×10⁵ primary BMDM cells (WT and Nik−/−) were seeded in 12-well-plate. Cells were then infected with Lm (MOI=0.1 [BMDMs]), or treated with 25 ng/ml TNF, 50 ng/ml LTα1β2, 100 ng/ml LPS, 50 ng/ml TWEAK, 30 μM MG132 or 5 μM BV6 for 24 hours or the indicated time. The whole cells were then lysed in lysis buffer (50 mM Tris-HCl pH7.6, 150 mM NaCl, 1% Triton X-100, and 1×protease inhibitor, cocktail) along with 1×laemmli sample buffer (161–0737, Biorad). Whole cell lysates were then separated by 8% SDS-PAGE and probed with indicated antibodies by western blot. The same method was applied to the entire study unless otherwise stated in the figure legend (e.g. Fig. 2d and Extended Data Fig. 3m, 6a). For MG132 treatment, indicated cells were challenged with 30 μM MG132 for 12 hours or the indicated time. To analyze RelA and RelB translocation, the cell plasma membrane was disrupted by incubation in lysis buffer (50 mM Tris-HCl pH7.6, 150 mM NaCl, 1% NP-40, and 1×protease inhibitor, cocktail). Nuclei were pelleted by centrifugation and cytosolic extracts were collected for analysis. Nuclei were then washed 2–3 times with lysis buffer and were boiled in lysis buffer to obtain nuclear extracts. 12% SDS-PAGE was used to separate H3.
For BV6-, or MG132-induced CMV-Flag-SIX2 protein accumulation, indicated plasmids were transfected into 5×10⁴ HEK293T cells. After 24 hours transfection, cells were treated with 5 μM BV6 or 30 μM MG132 for 24 or 12 hours. For NIK expression induced SIX1 and SIX2 accumulation, GFP-SIX1/SIX2 were co-transfected with Flag-NIK into HEK293T cells. SIX1 and SIX2 expression was quantified by fluorescence microscopy and western blot after 48 hours transfection. To test BV6/TNF-induced apoptosis pathway activation, 1×10⁵ fibroblasts were seeded in 12-well-plate. Cells were then treated with 25 ng/ml TNF plus 2.5 μM BV6 along with or without 30 μM z-VAD or 40 μM z-IETD for 6 hours. 12% SDS-PAGE was used to separate cleaved caspase-3.
Immunoprecipitation assay
To test the interaction between SIX2 and RelA/RelB, 8×10⁵ HEK293T cells were transfected with the indicated plasmids (6μg total). After 48 hours, cells were lysed in 1 ml lysis buffer, followed by 30s on and 30s off sonication for 7–10 cycles to break the nuclei. Anti-Flag immunoprecipitation was carried out using anti-Flag M2 affinity gel (A2220, Sigma) for 4 hours. Beads were then washed 4 times with lysis buffer. Co-immunoprecipitated proteins were separated by SDS-PAGE and the present proteins were detected by anti-HA or Flag western blot.
For ubiquitination of SIX2, Flag-SIX2 and HA-Ub were co-transfected with EV or GFP-NIK into HEK293T cells. After 48 hours, equal amount of Flag-SIX2 proteins were loaded for anti-Flag immunoprecipitation. Ubiquitnated SIX2 were detected by anti-HA western blot.
Yeast two hybrid
To test the interaction between SIX2 and RelA trans-activation domain, full-length SIX2 was cloned into the pACT2-AD vector. Amino acid 473–522 of RelA, which does not have ability of self-activation36, was cloned into pLexNA-BD vector. Yeast transformation was performed using standard LiAc based method. Equal amount of indicated yeast cells were placed on either SD/UWL− or SD/WHULK− (Clontech) with 10 μM 3-Amino Triazole (3-AT) and grown for 2–3 days.
RNA sequencing and data analysis
RNA sequencing (RNA-seq) was performed at UTSW McDermott Center Next Generation Sequencing Core and analyzed at the McDermott Center Bioinformatics Lab as described previously37. Briefly, Fluc or NIK lentivirus was transduced into WT fibroblasts. After 72 hours, total RNA was purified according to RNAeasy mini kit instruction (QIAGEN, 74104) and prepared according to the TruSeq® stranded mRNA sample preparation guide (Illumina). Sequencing data was then generated by Illumina HiSeq 2500 by reading paired-end 100 bp (base pair). To consider the NIK-stimulated genes, each read was mapped to human genome based on Human-hg19 by Tophat (v2.0.10) based on igenome annotations (https://ccb.jhu.edu/software/tophat/igenomes.shtml). Cufflinks/Cuffdiff (v2.1.1) was then used to calculate the expression value of each sample and identify differentially expressed genes in Fluc or NIK sample using a regularized t-test38. Only genes with log2(fold change; FC) ≥ 1 or ≤ −1 and false discovery rate (FDR)< 0.05 were considered as NIK up- or down-regulated genes compare to Fluc control.
To analyze the SIX2-downregulated NIK-stimulated genes, FlucRFP/FlucBFP, NIKRFP/FlucBFP, NIKRFP/SIX2BFP, or FlucRFP/SIX2BFP lentivirus was transduced into WT fibroblasts. RNA purification and RNA sequencing were performed as described above. Comparison of NIK/SIX2 vs NIK/Fluc (comp I) or NIK vs Fluc (comp II) was carried out by considering log2(FC) ≤−1 or ≥ 2 and FDR<0.01. The SIX2 downregulated NIK-stimulated genes were then adjusted by comparing comp I with comp II.
For BV6/TNF-induced gene transcription profiles in H1792 NSCLCs, 3×10⁵ WT and SIX1−/− SIX2−/− cells were treated with mock or 5 μM BV6 along with 25 ng/ml TNF for 24 hours. The total RNA was extracted from the adherent cells. RNA sequencing was performed as described above. The read length for this experiment is 75 bp single-end. To analyze the differential expression profiles, fastq files were checked for quality using fastqc (v0.11.2; http://www.bioinformatics.babraham.ac.uk/projects/fastqc) and fastq_screen (v0.4.4; http://www.bioinformatics.babraham.ac.uk/projects/fastq_screen) and were then quality trimmed using fastq-mcf (ea-utils/1.1.2–806)39. Trimmed fastq files were mapped to hg19 (UCSC version from igenomes) using TopHat40, duplicates were marked using picard-tools (v1.127 https://broadinstitute.github.io/picard/), read counts were generated using featureCounts41 and differential expression analysis was performed using the generalized linear model likelihood ratio test implemented in edgeR42. For comparison of BV6/TNF-induced genes in WT cells, only gene that exhibits log2(counts per million) ≥ 0.1, log2(FC) ≥ 1, and FDR< 0.05 was considered as up-regulated genes. The differential genes between BV6/TNF-treated WT and SIX1−/− SIX2−/− cells were considered by log2FC ≥ 1 (up) or ≤ −1 (down) and FDR< 0.05. The remaining genes were considered as no change. The expression levels of each of the 1,024 differentially expressed genes were normalized across conditions to generate z-scores and presented in Fig. 4f. Final gene lists were then used for pathway analysis with QIAGEN’s Ingenuity Pathway Analysis tool (QIAGEN Redwood City, http://www.qiagen.com/ingenuity). Trends in these gene lists were also plotted using various R packages (https://www.R-project.org/). The significance values for the canonical pathways are calculated by one-sided Fisher’s exact test.
RNA-seq data validation and qRT-PCR
To validate RNA-seq data, experiments were performed as described above. Briefly, total RNA was isolated for synthesizing cDNA using SuperScriptIII First-Strand Kit (18080051, Invitrogen). The gene expression level was quantified by real-time PCR through detecting the SYBR green (4309155, ABI) by ABI 7500 fast real-time PCR system. To test if SIX1 and SIX2 suppressed NIK-stimulated genes and if these NIK-stimulated genes were dependent on RelA or RelB, WT, RelA−/−, RelB−/−, or SIX1−/− SIX2−/− fibroblasts were transduced with Fluc or NIK lentivirus. Total RNA was isolated after 72 hours transduction. Gene expression level was quantified by qRT-PCR.
For Lm- and TNF-stimulated Six1 and Six2 gene expression, 2×10⁵ WT and Nik−/− primary BMDM cells were seeded in 12-well-plate and then infected with Lm (MOI=~0.1) or treated with 25 ng/ml TNF for 24 hours. For TWEAK-induced IL-1β, IL-8, and CCL3 gene transcription in fibroblasts, WT and SIX1−/− SIX2−/− fibroblasts were treated with 50 ng/ml TWEAK for 24 hours. For LPS-induced inflammatory mediators’ gene expression in peritoneal macrophages, cells were treated with 100 ng/ml LPS for 4 hours. Relative gene expression was adjusted to housekeeping gene β-Actin (murine or human) and then normalized to experimental control.
NIK-stimulated genes library
Based on the RNA-seq data, 273 genes were identified as NIK-stimulated genes. 237 out of 273 genes were cloned into the TRIP.CMV.IVSβ.GENE.ires.TagRFP destination vector. 141 genes were obtained from hORF Collection (Invitrogen), 35 were from DNASU43 and 61 were from the type I interferon library31. Lentiviruses were produced as described above.
Luciferase reporter assay
1×10⁴ HEK293T cells or 2×10⁴ WT, RelA−/−, or RelB−/− fibroblasts were seeded in each well of 48-well-plate. Indicated plasmids were transfected into cells along with LacZ (as transfection control) and 5×κB-LUC, pIL-8-LUC, or 5×GAL4-LUC and incubated for 48 hours. For cytokines treatment, after 24 hours transfection, cells were treated with 25 ng/ml TNF or 50 ng/ml LTα1β2 for 24 hours. Activity of luciferase was measured according to manufacturer’s protocol (E1500, Promega). ONPG buffer (2-Nitrophenyl β-D-galactopyranoside dissolving in 200 mM NaH2PO4, 2 mM MgCl2, and 100 mM β-mercaptoethanol) was used to measure activity of LacZ. The luminescence and absorbance units were measured by FLUOstar OPTIMA (BMG LABTECH). Relative luciferase activity was quantified by adjusting to LacZ control and normalizing to experimental control.
Fluorescence microscopy
To analyze localization of truncated SIX2 fragments, 2×10⁴ U-2 OS cells were seeded on coverslips in 24-well-plate. Indicated Flag-tagged SIX2 fragments were transfected into cells. After 48 hours, cells were washed 2–3 times with PBS and were fixed by incubating in 500 μl PBS/3.7% formaldehyde for 10 minutes at 37°C, followed by washing 3 times with PBS and incubation in 500 μl PBS/50 mM NH4Cl for 10 minutes. Cells were permeabilized in PBS/10% horse serum/0.5% Triton X-100 for 45 minutes. Cells were then incubated with primary antibody (1:500 anti-Flag in PBS/10% horse serum/0.5% Triton X-100) for 45 minutes. After washing 3 times with PBS, secondary antibody (1:500 fluorescein conjugated goat anti-mouse from Pierce and 1:1000 DAPI in PBS/10% horse serum/0.5% Triton X-100) was added and incubated for 45 minutes. After washing 3 times with PBS and 1 time with H2O, the samples were mounted on slides and images were processed by Zeiss Observer Z1 fluorescent microscope.
Chromatin-immunoprecipitation
GFP-SIX1 stable cell line was generated by cloning GFP-SIX1 into pSCRPSY-blasticidin backbone. Lentiviruses were produced as described above. Fibroblasts and HCT116 cells were transduced and selected by using 10 μg/ml blasticidin. Positive cells were used for following experiments. Chromatin-immunoprecipitation (Ch-IP) assay was performed according to manufacturer’s instructions (Millipore, 12–495). Briefly, 1.0×10⁷ cells were cross-linked by 1% PFA for 10 minutes at 37°C and 125 mM glycine was used to quench crosslinking. Cells were then washed with chilled PBS twice, and lysed in lysis buffer (5mM PIPES pH8.0, 85mM KCl, 0.5% NP-40, 1mM PMSF, 1×protease inhibitor). The nuclei were then pelleted down by spinning at 3,000 rpm for 5 minutes and were resuspended in RIPA buffer (50 mM Tris-HCl pH8.0, 1% NP-40, 150 mM NaCl, 0.5% Sodium Deoxycholate, 0.1% SDS, 2.5 mM EDTA, 1 mM PMSF, 1×protease inhibitor). Nuclei lysates were sonicated 40 cycles (HCT116 cells, 70 cycles for fibroblasts) with 30s on and 30s off to yield fragments of 200–1000 bps using Bioruptor (Diagenode). 6 μg of IgG, SIX1, RelA or Pol II antibodies were conjugated with the protein G beads (10004D, Invitrogen) for 1 hour and blocked using 5% BSA for 1 hour. After spinning down sonicated nuclei lysates at 13,000 rpm for 10 minutes, equal supernatant of sonication products was incubated with the pre-conjugated protein G beads at 4°C overnight. The bound beads were washed with RIPA buffer, low salt buffer, high salt buffer, and LiCl buffer once, finally with TE buffer twice. The bound protein-DNA complex was eluted by 500 μl elution buffer (100 mM NaHCO3, 1% SDS). 20 μl 5 M NaCl was added to reverse crosslinks of protein and DNA by heating at 65°C for over 4 hours or overnight. DNA was recovered by PCA and precipitated by ethanol in the presence of glycogen (AM9515, Invitrogen). The enrichment of IL-1β, IL-8, and CCL3 promoter was measured by quantitative PCR (qPCR). Fold enrichment was normalized to experimental control. For RelA and Pol II ChIP experiments, fold enrichment was adjusted to “input DNA” that was saved prior to immunoprecipitation and then normalized to experimental control.
Cell viability assay
5×10³ (for 48 hours treatment) or 1×10⁴ (for 24 hours treatment) indicated cells were seeded in the 96 well plates (Costar, black with clear flat bottom, 3603). After 19 hours, the media was removed and fresh media supplemented with the indicated compounds were added and incubated at 37°C with 5% CO2 for 24 or 48 hours. Whole cell ATP levels were measured using CellTitre Glo following manufacturer’s instructions (G7572, Promega). The luminescence units were measured by FLUOstar OPTIMA (BMG LABTECH). For SIX2 complementation assays, 7×10⁴ parental, NIK−/− or SIX1−/− SIX2−/− fibroblasts were seeded in the 24-well-plate. Then cells were transduced with Fluc, SIX2 or SIX2R lentivirus. After 50 hours, transduced cells were seeded in 96 well plates and the experiments were performed as described above.
DATA AVAILABILITY
All data generated during this study that supporting the findings are included in the manuscript or in its source data and supplementary information. All materials are available from authors upon reasonable request. The RNA-seq data associated with Fig. 4f, Extended Data Fig. 2b, and Extended Data Fig. 4g have been deposited in NCBI (insert accession code when it is available).
Supplementary Material
Extended Data
Extended Data Fig. 1. CD40-NIK signaling axis mediates anti-bacterial function.
a, b, Experiments were performed to exclude the possibility that the observed CD40L induced anti-bacterial function was specific to a particular cell type or protocol of cytokine induction. We reconstituted the CD40L signaling pathway in HEK293 cells. These cells do not express CD40, the endogenous receptor for CD40L (a, western blot). HEK293 cell are also unable to be stimulated by CD40L (a, graph). However, we found that overexpression of CD40 strongly induced NF-κB pathway activation (a, graph). Expression of CD40 restricted both Lm and Sf infection (b) to levels similar to those observed in CD40L treated U-2 OS cells (compare data to Fig. 1b). The NF-κB reporter activity assay in panel a was performed by co-transfecting empty vector (EV), CD40L or CD40 with 5×κB-LUC reporter gene into HEK293T cells. Luciferase activity was measured after 48 hours and normalized to EV (right). Data are mean±s.d. from 6 independent experiments. Experiment and quantification of panel b is presented as in Fig. 1b. Data are mean±s.d. from 6 independent experiments. c, d, Conformation of genetic knockout of the MAPK3K14 (here forward referred to as NIK) and MAPK3K7 (here forward referred to as TAK1) genes in STAT1−/− human fibroblasts. c, Schematic representation of In/Del base pairing and the sgRNA targets locus of Exon 1 in the NIK and TAK1 gene. NIK−/− contains −7bps, +G, and +CTCAC alleles (top). TAK1−/− contains +AT alleles, −2bps, and −409bps (bottom). (- means deletion, + means insertion). d, Western blot shows endogenous NIK and TAK1 expression in parental, NIK−/− and TAK1−/− cells. It is important to point out that NIK is constitutively degraded by cIAPs-TRAF2/3 E3-ligase complex in quiescent cells2. To detect NIK expression, WT, NIK−/−, and TAK1−/− fibroblasts were treated with 2.5 μM BV6 (a SMAC-mimetics compound that antagonizes cIAPs and leads to NIK accumulation13,14) for 14 hours and then the endogenous proteins were probed with indicated antibodies by western blot. e, NIK is necessary for restricting Lm infection. Fibroblasts with the indicated genetic background were treated with vehicle control (DMSO) or 2.5 μM BV6 for 14 hours and then infected with LmGFP. The percent of bacterial infection was normalized to WT uninfected control. Black statistic markers denote the difference between WT and indicated cell lines and red markers denote the difference between DMSO and BV6 treatment. We noted that NIK−/− cells exhibited much greater levels of Lm infection than either WT or TAK−/− cells consistent with its role in preventing infection after cellular stimulation. However, BV6 treatment of cells, which suppressed Lm infection of WT cells, had no effect on NIK−/− cells further indicating that NIK activation is necessary for the anti-bacterial response. Data are mean±s.d. from 9 independent experiments. f, The kinase activity of NIK is required for its anti-bacterial function. Fluc, WT NIK or NIK-kinase dead mutant (NIKK429/430A referred to as NIKKD) lentivirus was transduced into fibroblasts or U-2 OS cell as indicated. Cells were then challenged with SfGFP. Quantification of bacterial infection is presented as described in Fig. 1b. Data are mean±s.d. from 4 independent experiments. g, NF-κB gene expression induced by NIK is kinase dependent. Empty vector (EV), NIK or NIKKD was co-transfected with 5×κB-LUC into HEK293T cells. NF-κB activity was measured after 48 hours and normalized to EV (right). Data are mean±s.d. from 4 independent experiments. h, Expression of NIK, but not TAK1, potently inhibits Lm and Sf infection. WT U-2 OS cells were transduced with combinational FlucRFP/FlucBFP, NIKRFP/FlucBFP, or TAK1RFP/TAB1BFP lentivirus. Cells were then challenged with LmGFP or SfGFP. Infection efficiency was quantified by flow cytometry. The infection efficiency was determined by gating GFP positive cells in both RFP and BFP positive cell populations. The relative percentage of pathogen infection was normalized to Fluc control. Data are mean±s.d. from 8 independent experiments. i, Control experiment showing NIK protein expression levels that correspond to experiments presented in Fig. 1c. Fluc and NIK transduced cells were lysed and probed with anti-NIK antibody. j, Overexpression of NIK does not cause cytotoxicity in fibroblasts. Previous studies suggest that ectopic expression of NIK causes cytotoxicity in A549 cells44. To test if ectopic expression of NIK causes cytotoxicity in fibroblasts, we transduced WT fibroblasts with indicated lentivirus and measured the cell viability after 72 hours by measuring ATP. Data are mean±s.d. from 6 independent experiments. P values were measured using one-way ANOVA (GraphPad), ***P<0.001, ****P<0.0001, ns: no significant difference. The same statistics were used in the later figures unless otherwise stated. Western blot data are representative of 3 independent experiments. For gel source data, see Supplementary Figure 1.
Extended Data Fig. 2. NIK-stimulated genes library screen.
a, Schematic of NIK-stimulated gene library design, cloning, and the multidimensional flow cytometry based high throughput screen. NIK-stimulated genes were determined by RNA-seq. The cDNAs of 237 NIK-stimulated genes were individually cloned into the lentiviral vector pTRIP upstream of the IRES-tagRFP (see methods). Fibroblasts were transduced with lentivirus in a one-gene to one-well format and were then infected with GFP expressing Lm, Sf, EAV, WNV, SINV, and PIV3 in independent experiments. The effect of a single gene expression on infection was quantified by flow cytometry. b, The relative expression levels of NIK-stimulated genes identified by RNA-seq. Fluc or NIK lentivirus was transduced into fibroblasts. Total RNA was isolated after 72 hours and gene expression level was determined by RNA sequencing. Graph shows gene expression levels that are significantly stimulated (red, 237 genes) or downregulated (green, 84 genes) by NIK expression compared to Fluc control. Fold change over 2 (Log2≥1) or less 0.5 (Log2≤−1) and FDR<0.05 (statistics test is presented in methods section). Bars were ranked numerically from low to high (see Table S1 for details). The expression levels of SIX1 and SIX2 are indicated. Data are representative of 2 independent experiments. c, Graph showing the efficiency of lentiviral expression of NIK-stimulated genes used in the high throughput bacterial and viral screen. NIK-stimulated genes were transduced into WT fibroblasts in a “one-gene per one-well” format. Transduction efficiency as measured % RFP positive cells was determined by flow cytometry and was ranked numerically from low to high (see source data for details, values are from the average of 2 technical replicates). 12 out of 237 genes were poorly transduced (less than 20% RFP+) and were excluded from subsequent analyses. d, Dot plots of Sf, Lm, EAV, WNV, SINV, and PIV3 infectivity in the presence of expressed NIK-stimulated genes (in c). Data were normalized to the average of each screen, indicating as the black dotted line. We chose to confirm hits in Fig. 1d based on two criteria: (1) the gene expression effect on inhibiting or enhancing pathogen infection by less than or greater than 50%, and (2) an adjusted Z-score less than −2 or greater than 2 (see Table S2 for details). NIK-stimulated genes that reproducibly and significantly inhibited (green) or enhanced infection (red) by these criteria are indicated. The genes shown in black font are hits that were not reproduced in the confirmatory experiments (Fig. 1d). Data are mean±s.d. from 2 (Sf and Lm) or 1 (EAV, WNV, SINV, and PIV3) independent experiments.
Extended Data Fig. 3. NIK mediates reactivation of SIX-proteins by inhibiting the ubiquitin/proteasome pathway.
a, Control experiment for Fig. 2a, c showing that Nik is expressed in WT BMDMs but not in BMDMs isolated from Map3k14−/− (here forward Nik−/−) mice. As mentioned in Extended Data Fig. 1d, Nik protein is constitutively degraded under quiescent condition. Thus, we employed MG132 proteasome inhibitor to stabilize endogenous Nik protein expression. To validate Nik protein expression, WT and Nik−/− primary BMDM cells were treated with mock or 30 μM MG132 for 12 hours and Nik protein was detected by western blot. b, c, Long term treatment of cells with TNF (b) or LPS45 (c) stabilized Six1 expression through activation of Nik in murine primary BMDM cells. WT and Nik−/− primary BMDMs were treated with 25 ng/ml TNF (b, graph showing quantification of Six1 protein expression in TNF treated cells mean±s.d. from 3 independent experiments as described in Fig. 2c) or 100 ng/ml LPS (c) for 24 hours. d, e, Human SIX1 and SIX2 protein reactivation by long term treatment of cells with both canonical (TNF) and non-canonical (LTα1β2) NF-κB agonists requires NIK, but not TAK1. WT, NIK−/− or TAK1−/− fibroblasts were treated with mock, 25 ng/ml TNF or 50 ng/ml LTα1β2 for 24 hours. LTα1β2 was employed as positive control of a non-canonical NF-κB agonist. TAK1−/− cells were included as control to show TNF and LTα1β2 could induce SIX1 and SIX2 accumulation in a TAK1 independent manner (e). f, g, Ectopic expression of NIK induces expression of recombinant SIX1 and SIX2 driven by the strong CMV promoter in HEK293 cells. Plasmids encoding CMV-driven GFP-SIX1 or GFP-SIX2 were co-transfected into HEK293T cells with empty vector (EV) or Flag-NIK. Western blot (f) and fluorescence microscopy (g) assays were performed to detect expression of GFP-SIX1 and GFP-SIX2 post 48 hours transfection. We estimate that SIX1 and SIX2 protein are expressed in 5–10% of untreated cells, whereas they are expressed in 60–70% of cells when co-transfected with NIK. Microscopy images were taken using a 10× objective (g). h, i, Experiments showing that activation of NIK by BV6 (h) or by inhibition of the proteasome with MG132 (i) stabilizes CMV-Flag-SIX2 expression in HEK293T cells. Flag-SIX2 was transfected into HEK293T cells for 24 hours, cells were then treated with mock or 5 μM BV6 for 24 hours or 30 μM MG132 for 12 hours. j, Inhibition of the 26S proteasome with MG132 induces endogenous Six1 protein expression in primary BMDMs. Cells were treated with 30 μM MG132 for the indicated time. k, Inhibition of the 26S proteasome promotes SIX1 and SIX2 expression in human fibroblasts and this expression occurs in NIK−/− fibroblasts. Experiments were performed as in j. l, Kinetics of cIAP1 degradation and NIK, SIX1 and SIX2 accumulation in human fibroblasts treated with BV6. WT fibroblasts were treated with 5 μM for indicated time. m, NIK potently suppresses SIX2 ubiquitination. HEK293T cells were co-transfected with HA-ubiquitin and Flag-SIX2 along with GFP-NIK as indicated and cells were incubated for 48 hours. SIX2 was immunoprecipitated with anti-Flag antibody. The ubiquitination status of the protein was determined by anti-HA western blot. n, Diagram showing the reactivation mechanism of SIX-proteins in response to non-canonical NF-κB activation. Details are explained in the main text. All data are representative of 3 independent experiments. For gel source data, see Supplementary Figure 1.
Extended Data Fig. 4. SIX-proteins oppose NIK-mediated anti-bacterial function through inhibiting NIK-stimulated genes expression.
a, SIX2 enhances bacterial infection independent of interaction with Eya family transcriptional co-activators. Previous studies have shown that SIX-family transcription factors assemble gene co-activator complexes through interaction with Eyes Absent (Eya) family members17. Structural studies indicate that SIX1 residues C16 and V17 are required for the interaction with EYA218. These residues are conserved in SIX2. Thus, using mutant SIX2C16RV17E protein, we found that SIX2 enhances Lm infection independent of EYA interactions. Fluc, WT SIX2, or SIX2C16RV17E lentivirus was transduced into WT fibroblast cells. Cells were then challenged with LmGFP. The percent of Lm infection was normalized to Fluc control. Data are mean±s.d. from 4 independent experiments. P is shown in the figure. b, Expression of SIX2 suppresses the anti-microbial function of NIK and CD40. WT fibroblasts were lentiviral transduced with a combination of cDNAs (FlucRFP/FlucBFP, NIKRFP/FlucBFP, NIKRFP/SIX2BFP, CD40RFP/FlucBFP, or CD40RFP/SIX2BFP). After 72 hours, cells were infected with LmGFP. The RFP-, BFP- and GFP-expressed cells were gated by flow cytometry. Quantification of infection was performed as described in Extended Data Fig. 1h. Data are mean±s.d. from 6 independent experiments. ***P<0.001, ****P<0.0001, ns: no significant difference. c, d, Characterization of SIX1−/− SIX2−/− fibroblasts generated by CRISPR-Cas9. Schematic representation of In/Del base pairing and the sgRNA targets locus of Exon 1 in the SIX1 and SIX2 gene in fibroblasts (c). SIX1−/− SIX2−/− contains a single T insertion in both alleles of the SIX1 and SIX2 genes. Western blot shows endogenous SIX1 and SIX2 expression in parental and SIX1−/− SIX2−/− fibroblasts (d). Data are representative of 3 independent experiments. e, The anti-bacterial activity of NIK is enhanced in SIX1−/− SIX2−/− fibroblasts. WT and SIX1−/− SIX2−/− fibroblasts were transduced with Fluc or NIK lentivirus. After 72 hours, cells were then challenged with LmGFP. Black statistic markers denote the difference between WT (Fluc) and WT (NIK) or SIX1−/− SIX2−/− (Fluc or NIK). Red marker denotes the difference between WT (NIK) and SIX1−/− SIX2−/− (NIK). Relative infectivity was normalized to WT (Fluc) control. These data indicate that SIX-proteins oppose the function of NIK, potentially through suppression of non-canonical NF-κB gene expression (see f, below). Data are presented as mean±s.d. from 6 independent experiments. ****P<0.0001, ns: no significant difference. f, Model illustrating the relationship between NIK expression, SIX-proteins accumulation, and their roles in regulating anti-microbial immunity. g, Diagram describing RNA-seq experiments used to identify NIK-stimulated genes that are suppressed by SIX2. To identify the NIK-stimulated genes that are regulated by SIX2, the indicated lentiviruses (group I-IV) were transduced into WT fibroblasts. Total RNA was extracted for deep sequencing post 72 hours transduction (see Table S3). h, Diagram showing the group comparisons from data generated in g. Briefly, the NIK-stimulated genes that suppressed by SIX2 were determined from Group IV vs Group II comparison (Log2 ≤−1) and then adjusted to NIK-stimulated genes that are from Group II vs Group I comparison (we chose fold change greater than 4), FDR<0.01 (statistics test is presented in methods section). i, Representative raw data from RNA-seq experiments performed in g, h. RNA-seq data are presented as FPKM value (bars show mean from 2 independent experiments indicated as circle). j, Validation of RNA-seq data. Experiments were performed as described as in g. Gene transcription level was determined by qRT-PCR and relative gene expression was normalized to Fluc control. Data are mean±s.d. of 3 or 2 technical replicates and representative of 3 independent experiments. For gel source data, see Supplementary Figure 1.
Extended Data Fig. 5. SIX-family proteins inhibit RelA and RelB mediated NF-κB activation.
a, b, Characterization of RelA−/− and RelB−/− in human fibroblasts. Schematic representation of In/Del base pairing and the sgRNA targeting locus of Exon 3 in RelA and Exon 1 in RelB gene. RelA−/− cells contain +C, −371 bps, and a 109 bps fragment that was replaced with 122 bps containing the GCGCTA with reverse complementary (orange fragment) (a up). RelB−/− cells contain the indicated deletions (a bottom). Western blot shows endogenous RelA and RelB expression in parental and RelA−/− or RelB−/− fibroblasts and response to stimulation by 24-hour application of TWEAK (b). c, Experiments evaluating the contributions of the canonical and non-canonical NF-κB subunits RelA and RelB, respectively, on expression of the indicated genes. Fluc or NIK was transduced into WT, RelA−/−, and RelB−/− fibroblasts to stimulate the non-canonical NF-κB signaling pathway and mRNA expression of the indicated genes were evaluated by qRT-PCR. We concluded that the IL-1β gene is specifically stimulated by RelA since we did not detect its expression in RelA−/− cells but did so in RelB−/− cells (which expression RelA). Similar logic was used to evaluate the 7 additional genes shown. Experiments were performed as described in Fig. 2g. Bars are mean of 2 technical replicates (shown as circle) and representative of 2 independent experiments. d, The human SIX-family consists of 6 unique isoforms. To determine which of these genes suppress NF-κB mediated gene expression, empty vector (EV), SIX1, SIX3, SIX4, SIX5, or SIX6 cDNAs were co-transfected with 5×κB-LUC into HEK293T cells. After 24 hours, cells were treated with mock or 25 ng/ml TNF for 24 hours. The luciferase activity was measured and normalized to EV untreated control. SIX1, SIX3, and SIX6 (SIX2 was not evaluated in this experiment) potently inhibited both basal and inducible activity of NF-κB. Data are mean±s.d. from 7 independent experiments. e, SIX2 inhibits LTα1β2- and TNF-induced NF-κB activation. EV or Flag-SIX2 was co-transfected with 5×κB-LUC into WT fibroblasts. After 24 hours, cells were treated with mock, 25 ng/ml TNF or 50 ng/ml LTα1β2 for 24 hours. Data were analyzed as described in d. Data are mean±s.d. from 6 independent experiments. f, The inhibitory potency of SIX2 is equivalent to A20 and IκBαSR. The Flag-tagged genes indicated were co-transfected with 5×κB-LUC into HEK293T cells. After 24 hours, cells were treated with mock or 25 ng/ml TNF for 24 hours. Data were analyzed as in d. Data are mean±s.d. from 9 independent experiments. Anti-Flag western blot was performed to determine expression levels, IκBα regulation was included as pathway activation control upon cellular stimulation with TNF. g, Experiments showing that SIX2 specifically inhibits the activity of both canonical and non-canonical NF-κB isoforms RelA and RelB, respectively. To evaluate the transcriptional activity of each NF-κB isoform independently, we transfected RelA cDNA into RelB−/− cells and RelB cDNA into RelA−/− cells along with SIX2, 5×κB-LUC. Transfection of both RelA and RelB potently induced NF-κB transcription of the indicated cells, and this transcription was suppressed by SIX2. Luminescence units were measured post 48 hours transfection. Data are mean±s.d. from 12 (left) and 9 (right) independent experiments. All western blot data are representative of 3 independent experiments. For gel source data, see Supplementary Figure 1.
Extended Data Fig. 6. SIX-family proteins inhibit NF-κB activation through occupying the target gene promoters.
a, In order to narrow down the possible mechanisms for SIX-proteins inhibition of inflammatory gene expression, we monitored the activation, processing and nuclear translocation of RelA and RelB upon cellular stimulation with TWEAK. WT and SIX1−/− SIX2−/− H1792 cells were treated with mock or 50 ng/ml TWEAK for 24 hours. Cells lysates from cytoplasmic or nuclear fractions were analyzed by western blot. Neither SIX1 nor SIX2 blocked RelA phosphorylation, p100/52 processing, or restricted NF-κB translocation to the nucleus. b, Domain analysis of SIX-family protein function. SIX-proteins are composed of a Six Domain (SD), Homeobox domain (HD), and Coiled Coil (CD) region (diagram). Full-length SIX1 and SIX2 have 80% identical amino acids over the entirety of the protein coding sequence. The SD and HD domains (residues 1–183, highlighted) are 96% identical46. The indicated FLAG-tagged SIX2 fragments were transfected alone into U-2 OS cells and processed for microscopy (middle) or transfected with 5×κB-LUC into HEK293T cells and processed for κB reporter activity (bottom). The highly conserved SD-HD domain was the minimal fragment that inhibited κB reporter activity. This fragment strictly localized to the nucleus, together indicating that SIX-proteins inhibit nuclear activity of NF-κB. Graph data were analyzed as described in Extended Data Fig. 5d. Data are mean±s.d. from 9 independent experiments. c, SIX2 inhibits gene activation from the IL8-promoter. pIL8-LUC plasmid composed of the 1.5 kilobase (kb) promoter region of IL-8 cloned upstream of luciferase gene, was co-transfected with indicated plasmids into HEK293T cells. After 24 hours, cells were treated with mock or 25 ng/ml TNF for 24 hours. The luciferase activity was then measured and analyzed as described in Extended Data Fig. 5d. Data are mean±s.d. from 9 independent experiments. Together, these data suggested that SIX-proteins inhibit NF-κB activation at gene promoters. d, Chromatin immunoprecipitation (ChIP) experiment providing additional evidence that SIX-proteins bind to inflammatory gene promoters as shown in Fig. 3a. Chromatin was prepared from GFP-SIX1 stable cell lines (HCT116 cells) treated with mock or 25 ng/ml TNF for 2 hours. Anti-SIX1 antibodies (or anti-IgG control) were used to immunoprecipitate SIX1 from nuclear extracts. Co-eluted DNA was amplified by primer sets as shown in Fig. 3a. Relative promoter occupancy was normalized to each experimental IgG control. Bars are mean of 2 technical replicates (shown as circles) and data are representative of 3 independent experiments. e, Control experiments corresponding to Fig. 3a and Extended Data Fig. 6f showing GFP-SIX1 expression levels. WT and GFP-SIX1 stable fibroblasts were stimulated with 50 ng/ml TWEAK for 24 hours. GFP-SIX1 expression was measured by western bot. f, SIX1 expression does not affect recruitment of RelA to the IL-8 promoter. Chromatin was prepared from WT or GFP-SIX1 stable fibroblasts and then immunopreciptated with anti-RelA. Bound DNA was amplified and quantified by qPCR. Results were adjusted to “input DNA” that was saved prior to immunopreciptation. Relative enrichment was then normalized to each group’s untreated control. Data are presented as mean±s.d. from 3 independent experiments. g, Control experiments corresponding to Fig. 3c showing that SIX2 inhibits GAL4-RelA and GAL4-RelB induced 5×κB-LUC activity. To validate if GAL4-RelA and GAL4-RelB constructs were functional, GAL4 DNA-binding domain fused RelA or RelB construct was co-transfected with indicated plasmids into HEK293T cells. 48 hours post transfection, the luminescence units were measured. Data are mean±s.d. from 9 (left) and 12 (right) independent experiments. h, Model showing NIK-mediated reactivation of SIX-proteins function in a negative feedback loop to control inflammatory gene expression by targeting gene promoter and inhibiting NF-κB trans-activation function. In quiescent cells (top panel), NIK and SIX-proteins are constitutively ubiquitinated and degraded by the proteasome. Non-canonical NF-κB agonists (e.g. TWEAK, LTα1β2, or BV6) promote degradation of cIAPs, loss of NIK ubiquitination and subsequent NIK protein accumulation (middle panel). Stabilized NIK protein activates non-canonical NF-κB mediated inflammatory gene expression (middle panel). Under conditions of long-term cytokine exposure, NIK-mediated suppression of a currently unknown E3-ubiquitin ligase results in SIX-protein accumulation (bottom panel). Consequently, SIX-proteins suppress inflammatory gene expression by targeting gene promoters and directly inhibiting NF-κB trans-activation function in a negative feedback loop (bottom panel). All western blot and microscopy data are representative of 3 independent experiments. For gel source data, see Supplementary Figure 1.
Extended Data Fig. 7. Doxycycline-induced HA-SIX1 expression in mice.
a, Schematic representation of the doxycycline-induced HA-SIX1 bitransgenic mouse model system. CAG-rtTA3 mice were intercrossed with Tet-on driven HA-SIX1 mice to obtain rtTA3+/−-SIX1+ mice. In principle, doxycycline bound rtTA3 targets the Tet-on operator and drives broad HA-SIX1 expression across multiple tissues. Primer sets used to genotype CAG-rtTA3 on chromosome 8 and Tet-on HA-SIX1 are shown. Electrophoresis gels shows genotyping of a representative rtTA3+/−-SIX1+ bitransgenic mouse. b, Anti-SIX1 western blot of whole cell lysates from BMDMs isolated from rtTA3+/−-SIX1+ mice. HA-SIX1 is not expressed in the absence of doxycycline under quiescent condition (left lane). TNF was administered to these cells as a control showing that endogenous murine Six1 is stimulated in these cells (right lane). c, Whole cell lysates from doxycycline treated BMDMs isolated from rtTA3+/− or rtTA3+/−-SIX1+ mice. BMDMs were stimulated with TNF, as indicated, and probed with anti-SIX1 antibody by western blot. Dox induced HA-SIX1 expression (lane 1), and this induction is potentiated by TNF (lane 2). We noted that HA-SIX1 ran as a doublet, which potentially represents unmodified and a mono-ubiquitinated form of the SIX1 protein. Neither endogenous Six1 nor HA-SIX1 was detected in BMDMs isolated from Dox treated rtTA3+/− mice (lane 3). In control experiments, TNF induced endogenous murine Six1 in BMDMs isolated from Dox treated rtTA3+/− mice (lane 4). d, HA-SIX1 is expressed in liver and spleen. rtTA3+/−-SIX1+ and rtTA3+/− mice were given 2 mg/ml doxycycline through drinking water for 10 days. Cell lysates from liver and spleen were used to probe HA-SIX1 expression by anti-SIX1 western blot. All western blot data are representative of 3 independent experiments. e, Peritoneal macrophages were isolated from rtTA3+/−-SIX1+ and rtTA3+/− littermate control mice. The adherent macrophages were incubated with 2 μg/ml doxycycline for 24 hours and then treated with mock or 100 ng/ml LPS for 4 hours. Total RNA was isolated for RT-qPCR. Relative gene expression was normalized to rtTA3+/− untreated control. Bars show mean from 2 technical replicates (shown as circles). Data are representative of 3 independent experiments. f, Diagram showing the experimental procedures corresponding to Fig. 4a–c. Further experimental details are provided in the methods section. For gel source data, see Supplementary Figure 1.
Extended Data Fig. 8. NIK−/− and SIX1−/− SIX2−/− sensitized fibroblasts to BV6/TNF induced cell death.
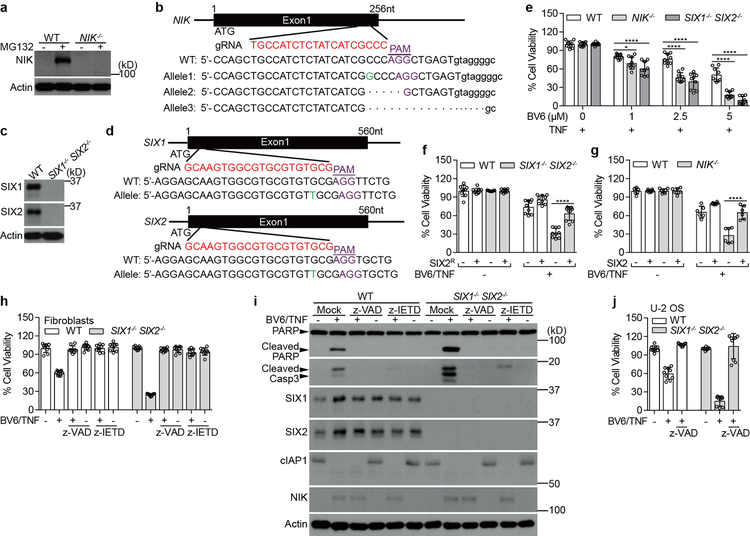
To further validate the observation that SIX1−/− SIX2−/− sensitized NSCLCs cell lines to combined BV6 and TNF induced cell death, we chose SV40 immortalized STAT1−/− fibroblasts for additional studies. a, b, Fibroblasts of the indicated genotype were treated with either BV6 (a) or TNF (b) alone. Cell viability was determined by measuring ATP after 24 hours. Cell survival rate was normalized to each genotype untreated control. Neither BV6 nor TNF (10ng/ml) alone induced fibroblast cell death. c, Knockout of NIK or SIX1/SIX2 sensitized fibroblasts to combined BV6/TNF induced cell death. Experiments were performed and data were analyzed as in a (graph). Representative images showing that the cell death phenotype induced by BV6/TNF in fibroblasts of the indicated genotype (right panels). d, Time course of combined BV6 (2.5 μM) and TNF (25 ng/ml) treatment of the indicted fibroblast genotypes. NIK−/− and SIX1−/− SIX2−/− cells exhibited increased cleavage of poly ADP-ribose polymerase (PARP) and the executioner Caspase-3 in BV6/TNF treated fibroblasts. We also noted that BV6/TNF induced NIK-dependent expression of both SIX1 and SIX2 proteins suggesting this cascade may be responsible for resistance to this treatment. e, f, We introduced a silent mutations in gRNA recognition sequence of the SIX2 cDNA that cannot be targeted by CRISPR-Cas9 (SIX2R, e, diagram). Expression of SIX2R in SIX1−/− SIX2−/− fibroblasts rescued the cell death phenotype (e) and suppressed both PARP and Caspase-3 cleavage (f) induced by BV6/TNF. WT and SIX1−/− SIX2−/− fibroblasts were transduced with Fluc or SIX2R lentivirus. After 72 hours, cells were treated with mock or 0.2 μM BV6 plus 10 ng/ml TNF for 24 hours and cell viability was determined by measuring ATP. Cell survival rate was normalized to each untreated control (e, bottom). For western blot, cells were treated with 2.5 μM BV6 plus 25 ng/ml TNF for 6 hours (f). All quantified data are mean±s.d. from 9 independent experiments. **P<0.01, ****P<0.0001. Western blot data are representative of 3 independent experiments. For gel source data, see Supplementary Figure 1.
Extended Data Fig. 9. NIK−/− and SIX1−/− SIX2−/− sensitized U-2 OS cells to BV6/TNF induced caspase-8-dependent cell death.
a-d, Knock out NIK or SIX1/SIX2 in U-2 OS cells using the CRISPR-Cas9 system. Western blot shows endogenous NIK, SIX1, or SIX2 expression in parental, NIK−/− and SIX1−/− SIX2−/− U-2 OS cells (a, c). We employed MG132 to stabilize endogenous NIK protein in WT and NIK−/− U-2 OS cells. Schematic representation of In/Del base pairing and the sgRNA targets locus of Exon 1 in the NIK in U-2 OS cells (b). NIK−/− contains +G, −5bps, and −18 bps (disrupted the alternative splicing site) alleles. Schematic representation of In/Del base pairing and the sgRNA targets locus of Exon 1 in the SIX1 and SIX2 gene in U-2 OS cells (d). SIX1−/− SIX2−/− contains +T of SIX1 and SIX2. e, SIX1−/− SIX2−/− and NIK−/− U-2 OS cells are sensitive to BV6/TNF-induced apoptosis. WT, NIK−/−, or SIX1−/− SIX2−/− U-2 OS cells were treated with 25 ng/ml TNF alone or in the presence of indicated concentrations of BV6 for 48 hours. The cell viability was measured by ATP. Cell survival rate was normalized to the absence of BV6 control. f, g, Expression of cDNAs SIX2R (see Extended Data Fig. 8e) or SIX2 protected SIX1−/− SIX2−/− or NIK−/− cells, respectively, from BV6/TNF induced apoptosis. WT, NIK−/−, or SIX1−/− SIX2−/− U-2 OS cells were transduced with Flu, SIX2 or SIX2R lentivirus as indicated. Cells were then treated with 2.5 μM BV6 plus 25 ng/ml TNF for 24 hours. h, j, We confirmed that cell death was mediated by the extrinsic apoptotic pathway, as both the pan-Caspase inhibitor (z-VAD) and specific Caspase-8 inhibitor (z-IETD) blocked BV6/TNF-induced cell death SIX1−/− SIX2−/− fibroblasts (h) and U-2 OS cells (j). WT and SIX1−/− SIX2−/− fibroblasts were treated with 1 μM BV6 plus 10 ng/ml TNF alone or in the presence of 20 μM z-VAD or z-IETD for 24 hours. For U-2 OS experiments, cells were treated with 2.5 μM BV6 plus 25 ng/ml TNF alone or in the presence of 20 μM z-VAD for 48 hours. The cell viability was measured by ATP. Cell survival rate was normalized to each untreated control. i, Western blot data showing PARP/Caspase-3 cleavage and the effect of Caspase inhibitors on BV6/TNF induced cell death of WT and SIX1−/− SIX2−/− fibroblasts. Cells were treated with mock, 2.5 μM BV6 plus 25 ng/ml TNF alone or in the presence of 30 μM z-VAD or 40 μM z-IETD for 6 hours. All quantified data are mean±s.d. from 9 (e, f, h, and j) and 6 (g) independent experiments. *P<0.05, ****P<0.0001. Western blot data are representative of 3 independent experiments. For gel source data, see Supplementary Figure 1.
Extended Data Fig. 10. Validation and Pathway analysis of RNA-seq in WT and SIX1−/− SIX2−/− H1792 NSCLCs.
a, To validate cluster 1 genes from RNA-seq data shown in Fig. 4f, WT and SIX1−/− SIX2−/− H1792 cells were treated with mock or 5 μM BV6 plus 25 ng/ml TNF for 24 hours. Total RNA was then isolated for qRT-PCR. Gene expression was normalized to WT untreated control. Data are mean±s.d. of 3 technical replicates and are representative of 3 independent experiments. b, Ingenuity pathway analysis (IPA) of Cluster 1 genes was performed as described in the methods. Pathway enrichment bar plots are shown. Data are from 2 independent experiments. The significance values for the canonical pathways are calculated by Fisher’s exact test right tailed. c, Experiment showing that inflammatory gene transcription is highly induced in SIX1−/− SIX2−/− H1792 cells (compared to WT controls) upon specific stimulation of the non-canonical NF-κB signaling pathway. WT and SIX1−/− SIX2−/− H1792 cells were treated with mock or 50 ng/ml TWEAK for 3 hours. Total RNA was extracted for qRT-PCR. Gene expression level was normalized to WT untreated control. Data are mean±s.d. of 3 technical replicates and representative of 2 independent experiments.
ACKNOWLEDGEMENTS
We would like to thank Heide Ford (University of Colorado) for providing the Tet-on HA-SIX1 transgenic embryos and for helpful discussion in preparation of the manuscript. We also thank UT Southwestern Medical center transgenic core for reviving the frozen embryos, John Minna (UTSW) for providing NSCLCs, and Vincent Tagliabracci, Joshua Mendell, Duojia Pan, Ivan D’Orso, Nicholas Conrad, and Rolf Brekken and the Alto Lab for helpful discussions. This research was supported by grants from the National Institute of Health (AI083359 to N.M.A and AI117922 to J.W.S.), the Welch Foundation (#I-1731), The Burroughs Welcome Fund, and the Howard Hughes Medical Institute and Simons Foundation Faculty Scholars Program to N.M.A.
Footnotes
COMPETING INTERESTS
The authors declare no competing interests.
REFERENCES
- 1.Cildir G, Low KC & Tergaonkar V Noncanonical NF-kappaB Signaling in Health and Disease. Trends Mol Med 22, 414–429, doi: 10.1016/j.molmed.2016.03.002 (2016). [DOI] [PubMed] [Google Scholar]
- 2.Sun SC The non-canonical NF-kappaB pathway in immunity and inflammation. Nat Rev Immunol, doi: 10.1038/nri.2017.52 (2017). [DOI] [PMC free article] [PubMed] [Google Scholar]
- 3.Shinkura R et al. Alymphoplasia is caused by a point mutation in the mouse gene encoding Nf-kappa b-inducing kinase. Nat Genet 22, 74–77, doi: 10.1038/8780 (1999). [DOI] [PubMed] [Google Scholar]
- 4.Annunziata CM et al. Frequent engagement of the classical and alternative NF-kappaB pathways by diverse genetic abnormalities in multiple myeloma. Cancer Cell 12, 115–130, doi: 10.1016/j.ccr.2007.07.004 (2007). [DOI] [PMC free article] [PubMed] [Google Scholar]
- 5.Keats JJ et al. Promiscuous mutations activate the noncanonical NF-kappaB pathway in multiple myeloma. Cancer Cell 12, 131–144, doi: 10.1016/j.ccr.2007.07.003 (2007). [DOI] [PMC free article] [PubMed] [Google Scholar]
- 6.Rosebeck S et al. Cleavage of NIK by the API2-MALT1 fusion oncoprotein leads to noncanonical NF-kappaB activation. Science 331, 468–472, doi: 10.1126/science.1198946 (2011). [DOI] [PMC free article] [PubMed] [Google Scholar]
- 7.Xiao G, Harhaj EW & Sun SC NF-kappaB-inducing kinase regulates the processing of NF-kappaB2 p100. Mol Cell 7, 401–409 (2001). [DOI] [PubMed] [Google Scholar]
- 8.Coope HJ et al. CD40 regulates the processing of NF-kappaB2 p100 to p52. EMBO J 21, 5375–5385 (2002). [DOI] [PMC free article] [PubMed] [Google Scholar]
- 9.Schoggins JW et al. Pan-viral specificity of IFN-induced genes reveals new roles for cGAS in innate immunity. Nature 505, 691–695, doi: 10.1038/nature12862 (2014). [DOI] [PMC free article] [PubMed] [Google Scholar]
- 10.Silver SJ & Rebay I Signaling circuitries in development: insights from the retinal determination gene network. Development 132, 3–13, doi: 10.1242/dev.01539 (2005). [DOI] [PubMed] [Google Scholar]
- 11.Ford HL, Kabingu EN, Bump EA, Mutter GL & Pardee AB Abrogation of the G2 cell cycle checkpoint associated with overexpression of HSIX1: a possible mechanism of breast carcinogenesis. Proc Natl Acad Sci U S A 95, 12608–12613 (1998). [DOI] [PMC free article] [PubMed] [Google Scholar]
- 12.Vince JE et al. TWEAK-FN14 signaling induces lysosomal degradation of a cIAP1-TRAF2 complex to sensitize tumor cells to TNFalpha. J Cell Biol 182, 171–184, doi: 10.1083/jcb.200801010 (2008). [DOI] [PMC free article] [PubMed] [Google Scholar]
- 13.Varfolomeev E et al. IAP antagonists induce autoubiquitination of c-IAPs, NF-kappaB activation, and TNFalpha-dependent apoptosis. Cell 131, 669–681, doi: 10.1016/j.cell.2007.10.030 (2007). [DOI] [PubMed] [Google Scholar]
- 14.Vince JE et al. IAP antagonists target cIAP1 to induce TNFalpha-dependent apoptosis. Cell 131, 682–693, doi: 10.1016/j.cell.2007.10.037 (2007). [DOI] [PubMed] [Google Scholar]
- 15.Kim JY et al. TNFalpha induced noncanonical NF-kappaB activation is attenuated by RIP1 through stabilization of TRAF2. J Cell Sci 124, 647–656, doi: 10.1242/jcs.075770 (2011). [DOI] [PubMed] [Google Scholar]
- 16.Christensen KL, Brennan JD, Aldridge CS & Ford HL Cell cycle regulation of the human Six1 homeoprotein is mediated by APC(Cdh1). Oncogene 26, 3406–3414, doi: 10.1038/sj.onc.1210122 (2007). [DOI] [PubMed] [Google Scholar]
- 17.Li X et al. Eya protein phosphatase activity regulates Six1-Dach-Eya transcriptional effects in mammalian organogenesis. Nature 426, 247–254, doi: 10.1038/nature02083 (2003). [DOI] [PubMed] [Google Scholar]
- 18.Patrick AN et al. Structure-function analyses of the human SIX1-EYA2 complex reveal insights into metastasis and BOR syndrome. Nat Struct Mol Biol 20, 447–453, doi: 10.1038/nsmb.2505 (2013). [DOI] [PMC free article] [PubMed] [Google Scholar]
- 19.Brown K, Gerstberger S, Carlson L, Franzoso G & Siebenlist U Control of I kappa B-alpha proteolysis by site-specific, signal-induced phosphorylation. Science 267, 1485–1488 (1995). [DOI] [PubMed] [Google Scholar]
- 20.Wertz IE et al. De-ubiquitination and ubiquitin ligase domains of A20 downregulate NF-kappaB signalling. Nature 430, 694–699, doi: 10.1038/nature02794 (2004). [DOI] [PubMed] [Google Scholar]
- 21.Chew J et al. WIP1 phosphatase is a negative regulator of NF-kappaB signalling. Nat Cell Biol 11, 659–666, doi: 10.1038/ncb1873 (2009). [DOI] [PubMed] [Google Scholar]
- 22.Liu B et al. Negative regulation of NF-kappaB signaling by PIAS1. Mol Cell Biol 25, 1113–1123, doi: 10.1128/MCB.25.3.1113-1123.2005 (2005). [DOI] [PMC free article] [PubMed] [Google Scholar]
- 23.Sosic D, Richardson JA, Yu K, Ornitz DM & Olson EN Twist regulates cytokine gene expression through a negative feedback loop that represses NF-kappaB activity. Cell 112, 169–180 (2003). [DOI] [PubMed] [Google Scholar]
- 24.Barboric M, Nissen RM, Kanazawa S, Jabrane-Ferrat N & Peterlin BM NF-kappaB binds P-TEFb to stimulate transcriptional elongation by RNA polymerase II. Mol Cell 8, 327–337 (2001). [DOI] [PubMed] [Google Scholar]
- 25.McCoy EL et al. Six1 expands the mouse mammary epithelial stem/progenitor cell pool and induces mammary tumors that undergo epithelial-mesenchymal transition. J Clin Invest 119, 2663–2677, doi: 10.1172/JCI37691 (2009). [DOI] [PMC free article] [PubMed] [Google Scholar]
- 26.Li L et al. A small molecule Smac mimic potentiates TRAIL- and TNFalpha-mediated cell death. Science 305, 1471–1474, doi: 10.1126/science.1098231 (2004). [DOI] [PubMed] [Google Scholar]
- 27.Petersen SL et al. Autocrine TNFalpha signaling renders human cancer cells susceptible to Smac-mimetic-induced apoptosis. Cancer Cell 12, 445–456, doi: 10.1016/j.ccr.2007.08.029 (2007). [DOI] [PMC free article] [PubMed] [Google Scholar]
- 28.Cheung HH et al. SMG1 and NIK regulate apoptosis induced by Smac mimetic compounds. Cell Death Dis 2, e146, doi: 10.1038/cddis.2011.25 (2011). [DOI] [PMC free article] [PubMed] [Google Scholar]
- 29.Cheung HH, Mahoney DJ, Lacasse EC & Korneluk RG Down-regulation of c-FLIP Enhances death of cancer cells by smac mimetic compound. Cancer Res 69, 7729–7738, doi: 10.1158/0008-5472.CAN-09-1794 (2009). [DOI] [PubMed] [Google Scholar]
- 30.Fulda S & Vucic D Targeting IAP proteins for therapeutic intervention in cancer. Nat Rev Drug Discov 11, 109–124, doi: 10.1038/nrd3627 (2012). [DOI] [PubMed] [Google Scholar]
METHODS REFERENCES
- 31.Schoggins JW et al. A diverse range of gene products are effectors of the type I interferon antiviral response. Nature 472, 481–485, doi: 10.1038/nature09907 (2011). [DOI] [PMC free article] [PubMed] [Google Scholar]
- 32.Malinin NL, Boldin MP, Kovalenko AV & Wallach D MAP3K-related kinase involved in NF-kappaB induction by TNF, CD95 and IL-1. Nature 385, 540–544, doi: 10.1038/385540a0 (1997). [DOI] [PubMed] [Google Scholar]
- 33.Yin L et al. Defective lymphotoxin-beta receptor-induced NF-kappaB transcriptional activity in NIK-deficient mice. Science 291, 2162–2165, doi: 10.1126/science.1058453 (2001). [DOI] [PubMed] [Google Scholar]
- 34.Zhang X, Goncalves R & Mosser DM The isolation and characterization of murine macrophages. Curr Protoc Immunol Chapter 14, Unit 14 11, doi: 10.1002/0471142735.im1401s83 (2008). [DOI] [PMC free article] [PubMed] [Google Scholar]
- 35.Sanjana NE, Shalem O & Zhang F Improved vectors and genome-wide libraries for CRISPR screening. Nat Methods 11, 783–784, doi: 10.1038/nmeth.3047 (2014). [DOI] [PMC free article] [PubMed] [Google Scholar]
- 36.Tetsuka T et al. Inhibition of nuclear factor-kappaB-mediated transcription by association with the amino-terminal enhancer of split, a Groucho-related protein lacking WD40 repeats. J Biol Chem 275, 4383–4390 (2000). [DOI] [PubMed] [Google Scholar]
- 37.Perelman SS et al. Cell-Based Screen Identifies Human Interferon-Stimulated Regulators of Listeria monocytogenes Infection. PLoS Pathog 12, e1006102, doi: 10.1371/journal.ppat.1006102 (2016). [DOI] [PMC free article] [PubMed] [Google Scholar]
- 38.Trapnell C et al. Differential gene and transcript expression analysis of RNA-seq experiments with TopHat and Cufflinks. Nat Protoc 7, 562–578, doi: 10.1038/nprot.2012.016 (2012). [DOI] [PMC free article] [PubMed] [Google Scholar]
- 39.Aronesty E Comparison of sequencing utility programs. Open Bioinformatics J 7, 1–8, doi: 10.2174/1875036201307010001 (2013). [DOI] [Google Scholar]
- 40.Kim D et al. TopHat2: accurate alignment of transcriptomes in the presence of insertions, deletions and gene fusions. Genome Biol 14, R36, doi: 10.1186/gb-2013-14-4-r36 (2013). [DOI] [PMC free article] [PubMed] [Google Scholar]
- 41.Liao Y, Smyth GK & Shi W featureCounts: an efficient general purpose program for assigning sequence reads to genomic features. Bioinformatics 30, 923–930, doi: 10.1093/bioinformatics/btt656 (2014). [DOI] [PubMed] [Google Scholar]
- 42.Robinson MD, McCarthy DJ & Smyth GK edgeR: a Bioconductor package for differential expression analysis of digital gene expression data. Bioinformatics 26, 139–140, doi: 10.1093/bioinformatics/btp616 (2010). [DOI] [PMC free article] [PubMed] [Google Scholar]
- 43.Cormier CY et al. Protein Structure Initiative Material Repository: an open shared public resource of structural genomics plasmids for the biological community. Nucleic Acids Res 38, D743–749, doi: 10.1093/nar/gkp999 (2010). [DOI] [PMC free article] [PubMed] [Google Scholar]
- 44.Dittmann M et al. A serpin shapes the extracellular environment to prevent influenza A virus maturation. Cell 160, 631–643, doi: 10.1016/j.cell.2015.01.040 (2015). [DOI] [PMC free article] [PubMed] [Google Scholar]
- 45.Bhattacharyya S, Borthakur A, Dudeja PK & Tobacman JK Lipopolysaccharide-induced activation of NF-kappaB non-canonical pathway requires BCL10 serine 138 and NIK phosphorylations. Exp Cell Res 316, 3317–3327, doi: 10.1016/j.yexcr.2010.05.004 (2010). [DOI] [PMC free article] [PubMed] [Google Scholar]
- 46.Kumar JP The sine oculis homeobox (SIX) family of transcription factors as regulators of development and disease. Cell Mol Life Sci 66, 565–583, doi: 10.1007/s00018-008-8335-4 (2009). [DOI] [PMC free article] [PubMed] [Google Scholar]
Associated Data
This section collects any data citations, data availability statements, or supplementary materials included in this article.
Supplementary Materials
Data Availability Statement
All data generated during this study that supporting the findings are included in the manuscript or in its source data and supplementary information. All materials are available from authors upon reasonable request. The RNA-seq data associated with Fig. 4f, Extended Data Fig. 2b, and Extended Data Fig. 4g have been deposited in NCBI (insert accession code when it is available).


