

Abstract
Toxin–antitoxin (TA) systems are found on both chromosomes and plasmids. These systems are unique in that they can confer both fatal and protective effects on bacterial cells—a quality that could potentially be harnessed given further understanding of these TA mechanisms. The current work focuses on the ParE subfamily, which is found throughout proteobacteria and has a sequence identity on average of approximately 12% (similarity at 30%–80%). Our aim is to evaluate the equivalency of chromosomally derived ParE toxin activity depending on its bacterial species of origin. Nine ParE toxins were analyzed, originating from six different bacterial species. Based on the resulting toxicity, three categories can be established: ParE toxins that do not exert toxicity under the experimental conditions, toxins that exert toxicity within the first four hours, and those that exert toxicity only after 10–12 hr of exposure. All tested ParE toxins produce a cellular morphologic change from rods to filaments, consistent with disruption of DNA topology. Analysis of the distribution of filamented cells within a population reveals a correlation between the extent of filamentation and toxicity. No membrane septation is visible along the length of the cell filaments, whereas aberrant lipid blebs are evident. Potent ParE‐mediated toxicity is also correlated with a hallmark signature of abortive DNA replication, consistent with the inhibition of DNA gyrase.
Keywords: DNA gyrase, DNA topology, filamented morphology, ParE toxin, toxin–antitoxin systems
Nine ParE toxins from six different bacteria were cloned and expressed in Escherichia coli for comparison of toxicity and induced filamented morphology. Three distinct classes are identified. The first contains three toxins with minimal toxicity but induced morphological changes, the next contains four toxins with potent toxicity and dramatic morphological changes, and the last class contains two toxins with limited toxicity at longer exposures and no morphologic changes.

1. INTRODUCTION
Toxin–antitoxin (TA) systems are of interest because they can tailor bacterial physiology toward either death or survival, in effect acting as accessory resiliency factors (Andersen et al., 2017; Peters et al., 2016). The mechanisms used by TA systems provide attractive new antibacterial strategies, but the formulation of this concept requires a deeper understanding of how and when their control over bacterial cell growth is exerted (Hayes & Kedzierska, 2014; Williams & Hergenrother, 2012). For example, studies have linked bacterial‐mediated TA upregulation to the formation of dormant types of cells in Escherichia coli (Shah et al., 2006). Persisters, such as these dormant‐type cells, have the ability to withstand external stresses, potentially including treatment regimens during an infection (Coussens & Daines, 2016; Harms, Maisonneuve, & Gerdes, 2016; Kedzierska & Hayes, 2016; Lewis, 2010). TA systems have been observed to have a direct protective effect on the survival of Salmonella within macrophages via toxin‐mediated tRNA acetylation (Cheverton et al., 2016), by upregulation of multiple toxins promoting biofilm formation in Burkholderia species (Van Acker, Sass, Dhondt, Nelis, & Coenye, 2014), and for the survival of extraintestinal pathogenic E. coli in a mouse infection model (Norton & Mulvey, 2012).
Toxin–antitoxin systems are found throughout the bacterial kingdom and have been categorized through bioinformatics analyses of genomic sequencing data into broadly conserved families of structure and toxin mechanism of action (Makarova, Wolf, & Koonin, 2009; Pandey & Gerdes, 2005; Sevin & Barloy‐Hubler, 2007; Xie et al., 2018). The RelE superfamily is unique in containing toxins with distinctly different functions within an overall conserved structural scaffold (Anantharaman & Aravind, 2003; Park, Son, & Lee, 2013). The functional categories of RelE superfamily toxins result in multiple subfamilies of ribosome‐dependent RNase toxins (RelE, HigB, YoeB, YafQ) and one large subfamily that is reported to inhibit DNA gyrase (ParE).
A ParDE system on the broad‐host‐range RK2 plasmid was among the first identified TA system and was denoted as “Par” for its role in plasmid partitioning via a postsegregational killing (PSK) system (Jensen, Grohmann, Schwab, Diaz‐Orejas, & Gerdes, 1995; Roberts, Strom, & Helinski, 1994; Sobecky, Easter, Bear, & Helinski, 1996). This ParE toxin was later demonstrated to inhibit E. coli DNA gyrase in vitro, and its expression in cells recapitulated a filamentous phenotype consistent with the identified in vitro inhibition (Jiang, Pogliano, Helinski, & Konieczny, 2002). Other reports have corroborated in vitro ParE‐mediated gyrase inhibition for chromosomally encoded toxins from Pseudomonas aeruginosa (Pa), Vibrio cholera (Vc), and Mycobacterium tuberculosis (Mt; Gupta et al., 2016; Muthuramalingam, White, Murphy, Ames, & Bourne, 2018; Yuan et al., 2010). The filamentous phenotype arising from ParE toxin exposure is consistent with DNA gyrase inhibition, which is stalled during the catalytic cycle, resulting in fragmented DNA that can trigger the SOS and other responses (Kreuzer, 2013; Reece & Maxwell, 1991; Williams & Schumacher, 2017). While there are many triggers for SOS, the filamentous phenotype has been observed upon overexpression of multiple ParE toxins for Pa, Vc, Mt, and Caulobacter crescentus (Cc; Fiebig, Castro Rojas, Siegal‐Gaskins, & Crosson, 2010; Gupta et al., 2016; Muthuramalingam et al., 2018; Yuan et al., 2010), as well as with other gyrase‐inhibiting proteins (CcdB and Fic toxins, SmbC; Dao‐Thi et al., 2004; De Jonge et al., 2012; Harms et al., 2015; Nakanishi, Oshida, Matsushita, Imajoh‐Ohmi, & Ohnuki, 1998; Sprenger et al., 2017; Van Melderen, Bernard, & Couturier, 1994) and compounds (quinolones, novobiocin; Handel, Hoeksema, Freijo Mata, Brul, & Kuile, 2015; Torres‐Barcelo, Kojadinovic, Moxon, & MacLean, 1816). Interestingly, a MazF toxin also induces filamentation and results in persister cells, but only when ciprofloxacin has also been administered to the culture (Cho, Carr, Whitworth, Johnson, & Wilson, 2017). Although many factors can result in a filamented morphology, within a defined experimental system, the presence of filamentation can be a convenient marker of ParE toxin‐mediated activity.
The sequences among TA system families are highly variable; conserved residues support the shared three‐dimensional fold, and, in the case of ribonucleases, conserved catalytic residues can also be delineated (Anantharaman & Aravind, 2003; Park et al., 2013; Schureck, Repack, Miles, Marquez, & Dunham, 2016). For some toxin families, such as the other gyrase‐inhibiting toxins CcdB and Fic, clear conservation of interacting surfaces and the Fic toxin catalytic residues for adenylation provide a basis to understand their in vivo activity (Dao‐Thi et al., 2004; Harms et al., 2015; De Jonge et al., 2012; Van Melderen et al., 1994). However, in the ParE toxin subfamily, sequence identity is only around 12%, while conservation is stronger with a range of 30%–80% (e.g., see Figure 1). Reports vary on which portion of the large DNA gyrase heterotetramer that the ParE toxins target (Gupta et al., 2016; Sterckx et al., 2016; Yuan et al., 2010). Therefore, despite the high prevalence of ParE toxin sequences in bacterial genomes, they remain one of the few toxins to have an unknown molecular mechanism for interaction with their target.
Figure 1.
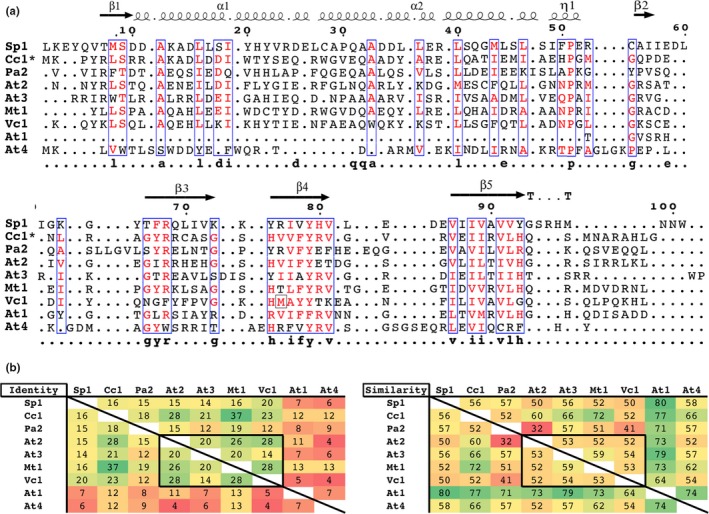
ParE toxins have conserved secondary structure elements within low sequence identity and similarity. (a) Sequences are aligned based on predicted secondary structure, except for the Cc1 which has an available three‐dimensional structure (3KXE, denoted by an *); abbreviations as in Table 1. Residue classes conserved at 65% or greater are boxed in blue, with conserved residues in red text. (b) Percent identity and similarity are shaded by most conserved (green) to least conserved (red). Toxins At2, At3, Vc1, and Mt1 (boxed) are found to exert the strongest toxicity (see Figure 2c)
Given the high sequence variability, as well as the location of ParE toxins on plasmids as well as chromosomes, there increasingly are questions about their primary biological function. For example, early studies discovered that the RK2‐derived parDE locus mediates variable plasmid retention depending on the bacterial species (Sia, Roberts, Easter, Helinski, & Figurski, 1995; Sobecky et al., 1996). Our group recently measured different inhibitory potencies of a Pa‐derived chromosomal ParE for DNA gyrase from E. coli versus that from Pa (Muthuramalingam et al., 2018). Other recent studies have highlighted misnomers in TA‐mediated PSK, including that the effect does not kill all the cells in the culture, and further, at longer growth times, there is robust re‐growth of plasmid‐free cells (Song & Wood, 2018). Each of these observations is consistent with the idea of a TA system having a balanced activity within cells, allowing some protection from external stressors while limiting potentially toxic mechanisms (Blower, Salmond, & Luisi, 2011; Muthuramalingam, White, & Bourne, 2016). This highlights that the context of genetic location, in addition to diversification between species of bacteria, can correlate to different outcomes for a given TA system.
Our recent work has uncovered a pleiotropic effect of a ParE toxin expression dependent on the strength of induction. Toxic effects are only observed at higher induction concentrations (0.2% arabinose), while protective effects are noted at weaker induction (0.02% arabinose) conditions (Muthuramalingam et al., 2018). Further, this toxin displayed modestly weaker inhibition activity for gyrase from its host bacteria as compared to E. coli gyrase. Interestingly, this ParDE system was identified as part of the core genome and it was suggested to represent a “domesticated” toxin (Andersen et al., 2017). These results have driven the interest of the current work, which seeks to test the equivalency of ParE toxin activity from different bacterial species. Experiments were carried out to quantify the effect of inducible ParE toxin expression on isogenic E. coli cultures by measuring the amount of cell death and the extent of morphological changes. These results demonstrate a surprising sensitivity to filamentation, even in the absence of measurable cell death. Microscopic evaluations highlight a nonseptated and either multinucleoid or noncompacted nucleoid formations in response to ParE expression, as well as the accumulation of aberrant lipid‐staining material at discrete locations along the inner cell membrane. Finally, while there are clearly variable effects of potency, these results do not correlate with phylogenetic grouping (data not shown); the specific regions or sequences mediating ParE‐specific toxicity remain elusive.
2. MATERIALS AND METHODS
DNA sequences for ParE toxins were obtained from the TA database (Shao et al., 2011), and primers were designed for amplification of genes from genomic DNA. Appropriate restriction sites were included in the primers to allow digestion and ligation into the desired expression vectors (see Appendix Table A1). Resulting clones were verified by DNA sequencing, transformed into BL21 DE3 pLysS E. coli, and stored at −80°C in LB with 20% glycerol.
Secondary structure was predicted from homology models generated with the Swiss‐Model server (Biasini et al., 2014), except for the Cc1 toxin which has a known structure (PDB ID 3KXE; Dalton & Crosson, 2010). Alignments based on secondary structure, as well as the calculation of sequence similarity and identity, utilized the UCSF Chimera program (Pettersen et al., 2004). Figure 1a was generated with the online tool ESPript 3.0 (Robert & Gouet, 2014).
2.1. Growth of cultures and measurements of viability
Cultures were inoculated from frozen glycerol stocks into LB media supplemented with appropriate selection antibiotics and 0.5% glucose, and grown overnight (16–18 hr) at 37°C, 200 rpm. These dense cultures were then diluted at a 1:20 ratio in fresh LB media supplemented with 0.2% glucose, grown at 37°C, 200 rpm, and induction with 0.4 mM IPTG was initiated when an optical density of 0.2 was reached for each culture; 0.5 μg/ml of ciprofloxacin was added to a control culture. Aliquots of culture were taken at the defined time points and serial dilutions were plated for determination of the colony‐forming units (CFUs), which were then corrected for the original aliquot volume to calculate CFU/ml.
2.2. Analysis of protein expression
For each time point, a volume of culture equivalent to 0.3 optical density units was pelleted and resuspended in 100 μl of 2× Laemmli loading buffer with SDS and reducing agent, and heated at 95°C for 5 min. A 20 μl volume was loaded and electrophoresed through a 12% Tris–tricine gel system. Gels were washed briefly in water before staining with Coomassie blue R‐250 and then destained in warm water and visualized on a ChemiDoc imaging system (Bio‐Rad).
A duplicate gel was transferred to a 0.2‐μm nitrocellulose membrane using a semidry transfer unit (Bio‐Rad) set at 1.2 mA for 5 min. The membrane was subsequently blocked by incubation for 1 hr at room temperature or overnight at 4°C in 1% nonfat milk dissolved in Tris‐buffered saline (TBS). After three washes in TBS, 5 min. each, the blots were incubated for 1 hr with the appropriate primary antibody (Pent–His antibody, Qiagen, at a 1:3,000 dilution or anti‐CBD antibody, NEB, at 1:3,000), washed again three times, and then incubated with the secondary antibody (anti‐mouse IgG at 1:5,000) for 1 hr. After washing, the blots were developed with an enhanced chemiluminescent detection reagent (ECL substrate, Bio‐Rad) and imaged on a ChemiDoc Imaging system (Bio‐Rad).
2.3. Imaging and measuring cell lengths
At the 4‐ and 15‐hr time points, 20 μl of culture was incubated with 1 μl of 200 nM DAPI and 1 μl of 0.5 mg/ml Nile Red for 5 min, or alternatively with 0.5–1 μl of a Live/Dead stain mixture (Biotium) according to the manufacturer's directions. The culture–dye mixtures were then applied to a poly‐lysine‐coated glass slide and allowed to adhere for 5 min. Excess liquid was removed and gently washed twice with phosphate‐buffered saline. A coverslip was then sealed into place, and the cells were imaged using a Zeiss Axioplan 2i Upright Fluorescent Microscope with appropriate settings for each fluor.
Images were opened in ImageJ (Schindelin, Rueden, Hiner, & Eliceiri, 2015) and the contrast adjusted for automated detection of individual cells with the plug‐in MicrobeJ (Ducret, Quardokus, & Brun, 2016). Lengths of individual cells were measured in pixels for at least 10 images per sample (numbers of cells in each population are given in Appendix Table A2) and binned into histograms normalized to the total cells in each population.
2.4. Purification of genomic DNA, genome sequencing, and chromosomal copy number analysis
Using Illumina MiSeq technology, E. coli genomes from five different samples were analyzed. Two samples contained the parent vector pRSF with no inserted open reading frame (with control sample treated with CIP at the time of induction), while the remaining three samples contained a toxin‐encoding construct (Mt1, Sp1, At3). Aliquots of cultures were collected just prior to induction and 4 hr after induction of ParE toxins, resulting in 10 total samples for analysis.
The genomic DNA was purified using the SV Wizard kit (Promega), and resulting DNA was dissolved in water. The sequencing libraries were prepped using NEBNext® Ultra™ II DNA Library Prep Kit according to the manufacturer's recommendations with 350 bp insert size. Samples were run on Illumina MiSeq kit version 3 with 150 cycles.
The sequences were trimmed by bbduk (Bushnell, 2014) and aligned using bwa (Li & Durbin, 2010). Escherichia coli BL21 (Takara) was used as the reference genome to assemble the reads. The potential single‐ and double‐stranded breaks were deduced with an in‐house script that uses the resulting sorted bam file. This allowed the examination of each break within the genome context. The sorted bam file also provided the nucleotide coverage that was parsed using bedtools (Quinlan & Hall, 2010). The resulting file was used to plot base coverage against its position, after filtering to remove sequences arising from the resident plasmid, and these values were normalized by dividing by the total number of reads in the sample (as in Samadpour & Merrikh, 2018).
3. RESULTS
3.1. ParE toxins do not have an obvious shared sequence motif to account for their function(s)
ParE toxins were identified based on annotations in the toxin–antitoxin database (TADB; Shao et al., 2011). From the starting selected sequences, cloning was successful for nine annotated ParE toxins (abbreviations are given in Table 1, while sequences are given in Table A1).
Table 1.
ParE toxin sources, abbreviations used in text, and construct formats
| Bacterial species of origin | Abbreviation in text | Vector and affinity tag |
|---|---|---|
| Agrobacterium tumefaciens | At1 | pRSF, N‐terminal 6×‐His affinity tag |
| Agrobacterium tumefaciens | At2 | pRSF, N‐terminal 6×‐His affinity tag |
| Agrobacterium tumefaciens | At3 | pRSF, N‐terminal 6×‐His affinity tag |
| Agrobacterium tumefaciens | At4 | pRSF (modified), C‐terminal GST with 6×‐His affinity tag |
| Caulobacter crescentus | Cc1 | pTXB, C‐terminal chitin‐binding domain fusion |
| Mycobacterium tuberculosis | Mt1 | pRSF, N‐terminal 6×‐His affinity tag |
| Pseudomonas aeruginosa | Pa2 | pTXB, C‐terminal chitin‐binding domain (CBD) fusion |
| Streptococcus pyogenes | Sp1 | pRSF, N‐terminal 6×‐His affinity tag |
| Vibrio cholera | Vc1 | pTXB, C‐terminal chitin‐binding domain fusion |
Only the C‐terminal portion of the toxin is present.
As with other TA system toxins, the sequence conservation among this subfamily is low, while the similarity and thus predicted secondary structure are highly conserved (Figure 1). Note that the clone analyzed for the Vc1 toxin was inadvertently truncated during cloning, containing only the last 34 amino acids of the 111 total (Figure 1, indicated with a gray box at position 76). Using predicted secondary structure as a basis for sequence alignment improves the agreement between sequences, allowing identification of a few highly conserved amino acids (calculated with Stothard, 2000). However, the conserved residues are closely associated with the basis for the fold rather than with a conserved surface or sequence cluster associated with gyrase inhibition.
3.2. Overexpression of ParE toxins yields variable toxicity to Escherichia coli cells
The cloned ParE toxins were induced for expression using equivalent induction strengths and in the same host background E. coli cells, ensuring the presence of equivalent cell signaling and response pathways as well as the absolute lack of cognate antitoxin. The resulting turbidity of growth, as measured by the optical density at 600 nm, revealed essentially no impact on the basis of toxin expression (see Figure A1). While there does appear to be a modest increase in turbidity for samples overexpressing the Sp1, At4, Mt1, and At3 toxins, this variability is not significantly different from control cultures when compared over three independent biological replicates. Similarly, a slight reduction in turbidity for samples treated with the gyrase inhibitor ciprofloxacin is also noted but not statistically significant. However, an issue with this analytical method is the variability in cell shape and size that is known to arise from gyrase inhibition. When DNA gyrase is inhibited, DNA breaks accumulate and can activate an SOS‐type response, which then induces a filamented cell morphology in E. coli (Kreuzer, 2013; Reece & Maxwell, 1991; Williams & Schumacher, 2017). The filamented morphology creates a solution of unequal scattering centers, calling into question the validity of comparing culture turbidity. To address this issue, we proceeded to measure the surviving cell numbers (colony‐forming units, or CFU/ml) as an indicator of the toxicity of each overexpressed toxin molecule. This analysis reveals discrete classes of toxicity among the nine ParE toxin molecules: those with essentially no toxicity out to 22 hr, those with toxicity evident within 4 hr of induction, and those with delayed (10–12 hr after induction) toxicity (Figure 2, Table A2).
Figure 2.
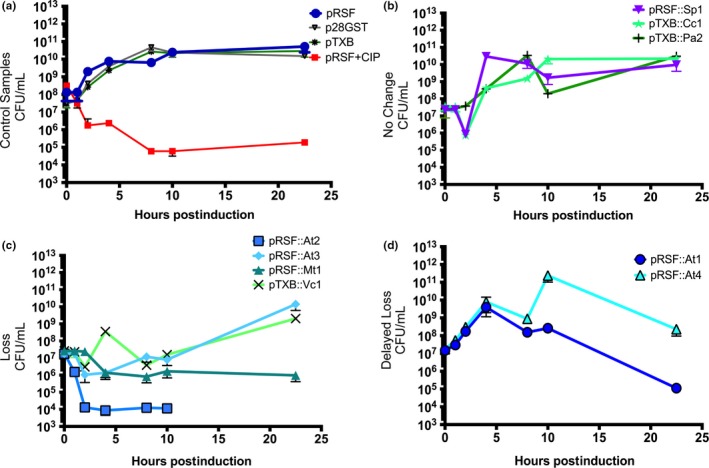
Overexpression of ParE toxins yields variable toxicity to Escherichia coli cells. The colony‐forming units (CFUs) were counted at the indicated time points after induction of ParE toxins. Toxin abbreviations are as in Table 1. (a) Control samples are comprised of the parent vectors (pRSF, pTXB, p28GST) with no inserted toxin genes and with treatment of anti‐gyrase ciprofloxacin (CIP) antibiotic. (b) ParE toxins that do not induce toxicity, (c) ParE toxins that do induce toxicity, and (d) ParE toxins that induce delayed toxicity. Each measurement with standard deviation represents at least three biological replicates, typically measured in duplicate
The control samples (Figure 2a) were comprised of each of the parent vectors with no toxin inserted; these samples grew as expected. There was no impact of the encoded fusion protein (CBD in the pTXB vector, and GST in the p28 parent vector as well as fused to the At4 construct in the pRSF vector, see Table 1) on cell survival, indicating that the toxicity observed arises from the toxins themselves and not the fusion protein(s). Additionally, a control sample was treated with the gyrase‐inhibiting antibiotic ciprofloxacin (CIP), resulting in a dramatic drop in CFU/ml; this serves as a useful comparator for the ParE toxins.
Among the nine ParE toxins tested, three (Sp1, Cc1, and Pa2) exert essentially no toxicity (Figure 2b) and the resulting CFU values closely match those of the parent vector controls. This result is in contrast with the At2, At3, Mt1, and Vc1 toxins, which exert a drop in CFU counts within the first 4 hr of induction (Figure 2c). This drop in cell survival is noteworthy for the particularly toxic At2 toxin, which mediates a 4‐log reduction within the first hour of induction, and a complete loss of recoverable colonies after 10 hr. The At3, Vc1, and Mt1 toxins also trigger a loss of viable cells of approximately 2‐ to 3‐logs. The activity of the Vc1 is unexpected given the truncation to essentially only the C‐terminal third of the protein (see Figure 1a, Table A2). The timing and extent of loss of viability mediated by the Mt1 toxin most closely match that of the control culture treated with CIP, with a gradual decline of approximately 3‐logs over 8 hr followed by a steady population at 104–105 CFU/ml. The At3 and Vc1 toxins mediate a somewhat quicker loss, but interestingly are followed by a partial to essentially full recovery in CFU counts between the 10‐ and 22‐hr samples. Future studies will establish if this recovery arises from an acquired suppressor mutation.
The remaining two ParE toxins, At1 and At4, comprise a category with a delayed loss of viability after approximately 8–10 hr of induction (Figure 2d). The control plasmid p28 contains the same GST affinity tag as the At4 toxin, and it does not exhibit any toxicity. The At4 toxin appears to not affect the growth level until the 22‐hr time point, at which point it returns to roughly an equivalent to the starting density (107–108 cells). The At1 toxin affects growth similarly; however, it mediates a more prominent drop in CFU values, with the 22‐hr sample having equivalent viability to the CIP control.
An obvious explanation for the varied toxicity mediated by ParE toxins is differences in protein expression levels. This was investigated using Western blot analyses to detect accumulation of the incorporated affinity tag over time (Figure A2, Table A2). ParE toxin expression was confirmed for each culture except the two most toxic ParE proteins, At2 and At3, the levels of which were apparently too low for detection based on our strategy (Figure A2b). The Mt1 toxin also mediates noted toxicity, yet it is robustly expressed. The control parent vector pTXB does express the fusion protein (chitin‐binding domain) at comparable levels as the two constructs containing ParE toxins (Cc1 and Vc1, Figure A2a). The expression for the Pa2 toxin is very weak and limited to early time points. However, this parent construct does not cause any changes from normal viability or cell size (Figures 2 and 3), indicating that the observed effects are specific to the presence of each toxin protein. Overall, this indicates that the individual ParE expression levels cannot reconcile the differences noted in culture viability.
Figure 3.
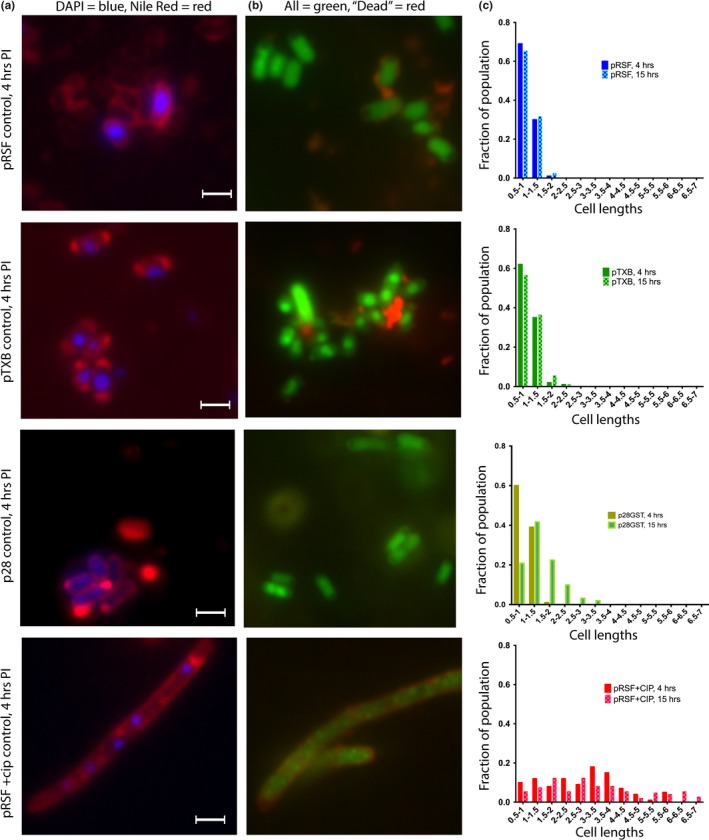
Effect of ParE expression on cell morphology: control samples. Aliquots of cultures were subjected to examination at 4 hr postinduction (images, a, b, scale bar is equal to 1.5 μm) and at 15 hr postinduction. The distribution of cell lengths was measured and is presented in (c). Cells were stained using both DAPI (specific for DNA) and Nile Red (fluorescent in hydrophobic environments, e.g., lipidic membranes) in (a), and with a Live/Dead combination in (b). For the Live/Dead staining in (b), both dyes are DNA intercalators, and while the green fluorophore is membrane‐permeable, the red fluorophore can only stain intercellular contents when the membrane has been damaged. For the vector controls without a ParE gene inserted, cells appear healthy and normal both in morphology and in the distribution of lengths. However, treatment with anti‐gyrase antibacterial ciprofloxacin induces a filamented morphology and multiple foci of intracellular DNA material. Further, accumulation of lipidic material is found along the cell rather than only at the poles when DNA gyrase is inhibited
3.3. All ParE toxins induce cell filamentation to differing extents, even in the absence of overt toxicity
Samples were analyzed by microscopy to assess whether morphological changes occurred as a result of toxin overexpression; each sample was subjected to two different staining protocols. Unfixed cells were incubated with the nucleic acid staining dye DAPI and the lipid‐specific fluorophore Nile Red (panel a in Figures 3, 4, 5, 6). In the second protocol, unfixed cells were incubated with DNA intercalating dyes in a “Live/Dead” stain, wherein one dye (green) is membrane‐permeable while the other (red) can only enter cells with damaged membranes (panel b in Figures 3, 4, 5, 6). Finally, populations of cells were imaged using phase contrast visualization and the length of individual cells was subsequently measured using the ImageJ plug‐in, MicrobeJ (Ducret et al., 2016; Schindelin et al., 2015). These values were then binned and plotted as histograms (panel c in Figures 3, 4, 5, 6), revealing filamentation induced by the ParE toxins (a number of cells in each population are given in Appendix Table A3).
Figure 4.
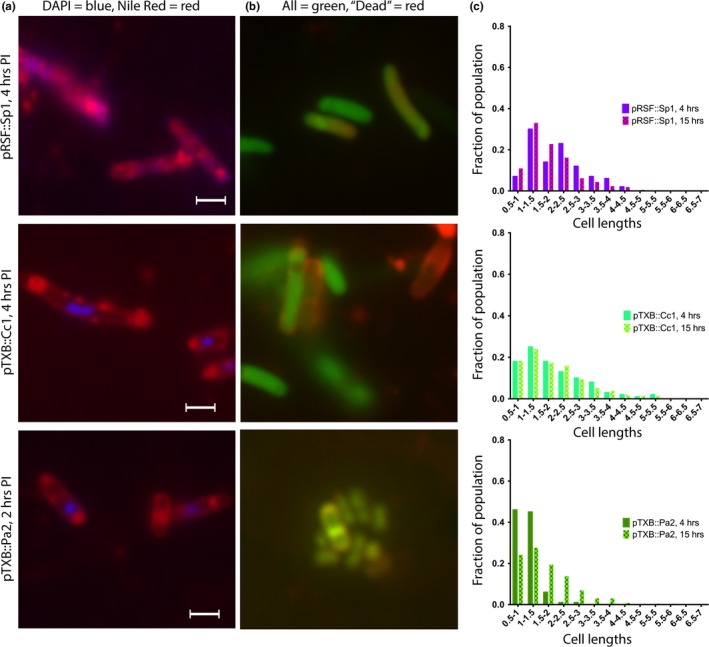
Effect of ParE expression on cell morphology: ParE toxins with no apparent impact on cell survival yet still mediate a filamented morphology. Aliquots of cultures were subjected to examination at 4 hr postinduction (images, a, b, scale bar is equal to 1.5 μm) and at 15 hr postinduction. The distribution of cell lengths was measured and is presented in (c). Cells were stained using both DAPI (specific for DNA) and Nile Red (fluorescent in hydrophobic environments, e.g., lipidic membranes) in (a), and with a Live/Dead combination in (b). For the Live/Dead staining in (b), both dyes are DNA intercalators, and while the green fluorophore is membrane‐permeable, the red fluorophore can only stain intercellular contents when the membrane has been damaged. Such membrane damage or mis‐regulation is apparent by punctate staining along the cells in (a) and by the entry of the red fluor in (b). Further, the cell morphology changes to a filamented distribution despite no impact on the CFU/ml measurements (see Figure 2)
Figure 5.
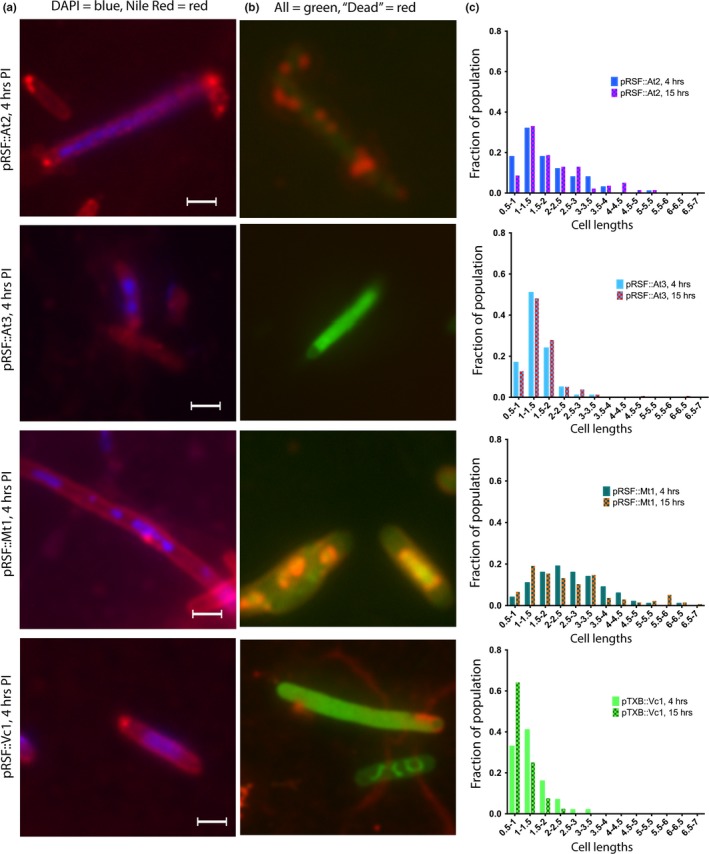
Effect of ParE expression on cell morphology: ParE toxins that mediate a loss in cell viability. Aliquots of cultures were subjected to examination at 4 hr postinduction (images, a, b, scale bar is equal to 1.5 μm) and at 15 hr postinduction. The distribution of cell lengths was measured and is presented in (c). Cells were stained using both DAPI (specific for DNA) and Nile Red (fluorescent in hydrophobic environments, e.g., lipidic membranes) in (a), and with a Live/Dead combination in (b). For the Live/Dead staining in (b), both dyes are DNA intercalators, and while the green fluorophore is membrane‐permeable, the red fluorophore can only stain intercellular contents when the membrane has been damaged. Such membrane damage or mis‐regulation is apparent by punctate staining along the cells in (a) and by the entry of the red fluor in (b). Further, nucleic acid is clearly stained in (b), although not along the entire cell, indicating membrane damage in concert with aberrant DNA replication. The extent of filamentation is greatest with the At2 and Mt1 toxins, which also mediated the most dramatic drop in CFU/ml (see Figure 2)
Figure 6.
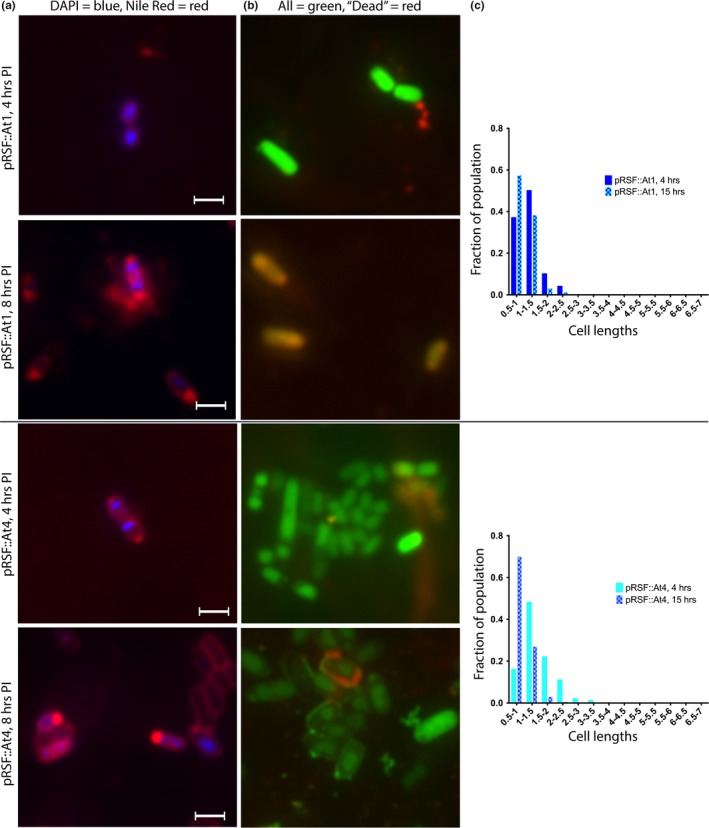
Effect of ParE expression on cell morphology: ParE toxins with a delayed impact on cell survival. Aliquots of cultures were subjected to examination at 4 hr postinduction (images, a, b, scale bar is equal to 1.5 μm) and at 15 hr postinduction. The distribution of cell lengths was measured and is presented in (c). Cells were stained using both DAPI (specific for DNA) and Nile Red (fluorescent in hydrophobic environments, e.g., lipidic membranes) in (a), and with a Live/Dead combination in (b). For the Live/Dead staining in (b), both dyes are DNA intercalators, and while the green fluorophore is membrane‐permeable, the red fluorophore can only stain intercellular contents when the membrane has been damaged. Such membrane damage or mis‐regulation is apparent by punctate staining along the cells in (a) and by the entry of the red fluor in (b)
For the control cultures, DAPI staining reveals generally a single nucleoid in the center of the cell and lipid staining at each pole. In the control samples treated with CIP, multiple DNA foci are visible along the length of the cell, as is some accumulation of additional lipidic material along the length of the filament. Two notable features emerge from the microscopic examinations of ParE toxin expressing cells with the lipid‐specific stain: (a) a lack of visible membrane septation in the resulting filamented cells and (b) the accumulation of lipidic material prominently at each pole as well as numerous aberrant bulges (blebs) along the length of filamented cells (panel a, Figures 3, 4, 5, 6). This is particularly the case for the toxins Sp1 and Cc1, which interestingly have essentially no impact on viability (Figure 2). For these two toxins, the DAPI‐stained nuclear material appears relatively normal in distribution, while the membrane stain clearly shows membrane blebs throughout the cell length (Figure 4). The ParE toxins that mediate a loss of CFU by 4 hr also cause the biggest changes in cell morphology (Figure 5). Nuclear material is seen as multiple discrete foci (Mt1, At3) or as a distended feature (Vc1) spanning the length of a filamented cell (At2). Aberrant membrane blebs are also evident in each sample examined. The two ParE toxins with delayed loss of viability, At1 and At4 (Figure 6), present the most similar staining patterns to that of the control samples (Figure 3), even at an 8‐hr time point. For this category of effects, however, the nucleoid regions appear to be doubled relative to control cultures, while the apparent lipid accumulation is not a prominent feature in these cultures.
The Live/Dead staining protocol results in essentially all cultures containing high levels of fluorescent green‐labeled cells, indicating intact cell membranes, although some isolated cultures also display red signals indicative of membrane disruption. In particular, the At1 cultures at 8 hr postinduction appear mostly as fluorescent red‐labeled cells (Figure 6b), consistent with the loss of CFU delayed to these later time points (Figure 2d). The At4 toxin also exhibits a delayed loss of CFU; however, these cells stain in an unusual pattern featuring compacted internal green signal and, occasionally, a halo of red (potentially periplasmic‐localized nucleic acid as membranes become disrupted; Figure 6b). The most notable staining pattern is for the potent Mt1 and At2 ParE toxins, which have a concentrated and compacted internal red stain with a background of green (Figure 5b). In the case of ParE toxin overexpression, these Live/Dead staining indicators serve as ideal markers of membrane integrity rather than cell death and are consistent with the Nile Red staining results (above) indicating lipid accumulation along the length of cells.
When cultures are examined for the distribution of cell lengths, filamented populations are evident and remarkably stable between the 4‐ and 15‐hr time points measured, with an overall minor broadening of the mean length noted in control empty vectors (Figure 3c). The toxin samples that do not have measurable differences in viability (category “No Change,” Figure 2) still cause filamentation in the case of both Sp1 and Cc1 (Figure 4). However, Pa2 has no effect on CFU and has no visible morphological changes until the 15‐hr time point. Further, Pa2 does not express well (Figure A2a) and so the lower level of morphological changes may be explained by limited protein expression.
Overexpression of the Mt1 and At2 toxins produces prominent changes to the cell population's morphology over the measured time period, consistent with the reduction CFU (Figure 5). The At3 and Vc1 toxins also induce a filamented morphology (Figure 5) but are less potent than Mt1 and At2, consistent with the cell viability measurements (Figure 2).
Both At1 and At4 toxins, comprising the “Delayed Loss” category, also impart a filamented morphology (Figure 6), although the distribution of cell length is restricted to a shorter range as compared to other toxins. Further, while the At1 distribution of cell lengths is relatively stable at the 15‐hr measurement, the At4 toxin induces an increase in the average length of cells from 4‐ to 15‐hr measurements (Figure 6c). These results are of interest as they coincide with a loss of CFU/ml, suggesting that the more filamented cell population at later time points is less viable.
3.4. ParE‐mediated effects recapitulate defects in replication initiation from oriC consistent with inhibition of DNA gyrase
The unwinding at an oriC origin of replication and the accessibility of the dnaA binding sequences are particularly sensitive to gyrase activity (as reported for novobiocin, Samadpour & Merrikh, 2018), such that gyrase inhibition yields multiple abortive cycles of replication initiation. In the previous study, when novobiocin‐inhibited E. coli cells were analyzed using genomic DNA sequencing, the copy number of oriC was in excess to the termini regions. We reasoned that if the ParE toxins were inhibiting DNA gyrase, a similar effect should be evident in genomic DNA copy numbers. Cultures that produced prominent filaments, Mt1 and At3, were subjected to DNA sequencing, as was the Gram‐positive‐derived Sp1, the control vector with no inserted ParE sequence, and the same control sample treated with CIP. The resulting DNA sequencing copy number reveals a marked increase in the oriC sequence in the Mt1‐expressing culture (Figure 7), with relatively equal increases also evident for the At3, Sp1, and CIP‐treated samples as compared to the control vector sample. Further analysis of these datasets was carried out to localize single‐stranded and double‐stranded breaks conserved throughout the sequencing data. This revealed multiple and extensive breaks in the DNA of cells treated with CIP, whereas the DNA integrity with overexpression of ParE toxin appeared to be maintained.
Figure 7.
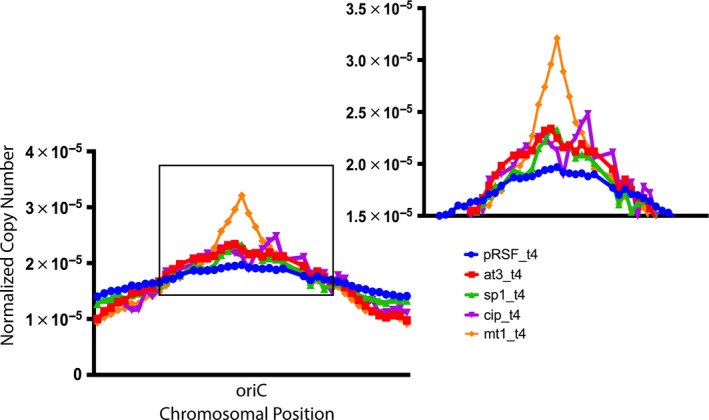
ParE toxin‐mediated inhibition of DNA gyrase results in increased abortive DNA replication, as evidenced by an increased copy number of the oriC sequence relative to the remaining chromosomal sequences. The Mt1 toxin has a prominent increase in the copy number of oriC, while toxins Sp1 and At3 and treatment with CIP produce a more modest yet appreciable increase above the pRSF vector only control. Abbreviations of toxin samples are as given in Table 1. Illumina MiSeq technology was used to sequence the genomes of samples after 4 hr of induction. Essentially, no mutations were noted as a result of toxin exposure, while the CIP‐exposed cells had extensively fragmented genomes (data not shown). The copy number of each read was analyzed to assess progress through DNA replication
4. DISCUSSION
This study was able to distinguish three classes of ParE toxin effectiveness: one with no apparent toxicity, one with potent toxicity, and another with delayed toxicity (see summary, Table A2). Each of these categories of ParE toxins triggers a filamentation of cell morphology, even in the absence of toxicity. Further, there is a direct correlation between the extent of filamentation within the population and the toxic action of individual ParE toxins on cell viability. While none of the tags in the absence of the toxin display toxicity, we cannot rule out an attenuation of Cc1 and Pa2 toxicity imparted by C‐terminal fusions. However, we note that the Vc1 and At4 toxins have larger tags at their C‐termini yet still mediate toxicity, while the Sp1 toxin does not have a larger affinity tag and does not mediate toxicity. A previous study with the Cc1 toxin noted drop in toxicity when a C‐terminal truncation was generated; however, this truncated mutant also had decreased solubility that could account for the observed effect (Dalton & Crosson, 2010). For the ParE toxin constructs, even after CFU counts decreased and in the case of At2 were below detection, filamented cells were still visible in culture up to 15 hr later (Figures 2 and 6). This indicates that even when filamented cells are not culturable, cell lysis is not occurring in ParE‐exposed cultures. This is consistent with the seemingly conflicting results between measures of turbidity and of viability (by CFU counts), wherein intact cells are still present as scattering centers within the solution yet is nonviable when plated in the absence of ParE inducer.
ParE‐induced filamented cell morphologies appear to lack any indications of septation, indicating that cell replication was interrupted before initiation of Z‐ring formation (Figures 4, 5, 6; Mukherjee, Cao, & Lutkenhaus, 1998; Simmons, Foti, Cohen, & Walker, 2008). The finding that nucleic acid is present in multiple discrete foci is consistent with defects during DNA replication caused by DNA gyrase inhibition (Nakanishi et al., 1998). The blebs of lipidic material noted along the inside of cells could be related to the tethering of chromosomes to the inner membrane (Magnan & Bates, 2015; Magnan, Joshi, Barker, Visser, & Bates, 2015) or could arise from effects on the regulation between peptidoglycan biosynthesis and the timing and completion of DNA replication (Harris & Theriot, 2018). Previous studies with the other ParE toxin from M. tuberculosis noted bleb formations visible on the cell surface by scanning electron microscopy, consistent with the current observations (Gupta et al., 2016).
While viability and filamentation are directly correlated, neither of these appears related to the expression level of the ParE proteins (Figure A2). This strongly implies that within each diverse ParE sequence lies a motif that imparts a level of potency. This is supported by the noted toxicity of both the truncated Vc1 clone and the At1 toxin that encodes only the C‐terminal half of the typical ParE sequence (see below). However, the specific “toxicity” feature remains obscure from our assessment based on sequence alignments, as does the likely interface for interaction with the cellular target. We cannot rule out a species‐specific effect, such that the tested ParE toxins may interact differently with the E. coli gyrase in our experimental system than they do with their native host gyrase (Muthuramalingam et al., 2018). In addition, there are reports of different ParE toxins interacting with different portions of DNA gyrase, opening the possibility that the interaction with gyrase may not be conserved throughout the ParE toxin family (Gupta et al., 2016; Yuan et al., 2010).
From the analysis of toxin sequences (Figure 1), it is clear that the “delayed toxicity” class is unique in comprising toxins likely from the RelE subfamily rather than the ParE subfamily, as distinguished on the basis of shorter alpha helices in the N‐terminal region (Muthuramalingam et al., 2018; Sterckx et al., 2016). The At4 toxin is highly homologous to E. coli YoeB, a ribosome‐dependent RNase in the RelE subfamily (Kamada & Hanaoka, 2005; Zhang & Inouye, 2009), and other work in our group has established that the At4 toxin is a potent ribosome‐dependent YoeB RNase (manuscript in preparation). The At1 toxin has an N‐terminal truncation that removes these helices altogether, and it does not contain the canonical amino acids used by the RNase toxins. It is interesting that such a dramatic truncation as found in At1 is still functional, and this result highlights a potentially minimal active unit for this toxin family. It seems likely, then, that the “delayed loss” category of ParE toxins could arise from ribosomal‐dependent RNase activity rather than DNA gyrase inhibition, although placing the At1 toxin in this category is speculative. It is of note, then, that these results imply the two related subfamilies can be distinguished phenotypically by a delayed loss of viability and relatively minor filamentation as compared to the other two categories of ParE toxin.
Studies have established that, among the consequences of changes in gyrase activity, there is an impact on the initiation of replication (Guo, Haakonsen, Zeng, Schumacher, & Laub, 2018; Samadpour & Merrikh, 2018). This has also been demonstrated for E. coli treated with CIP within an infection model (Haugan, Lobner‐Olesen, & Frimodt‐Moller, 2018). Analysis of the integrity and copy number of genomic DNA within ParE‐exposed cells, which was carried out for three of the nine tested toxins, further supports the mode of action as gyrase inhibition. This analysis also highlighted the strong effect of the Mt1 toxin (Figure 7). It also revealed a much more fragmented genome when treated with CIP (data not shown), which is likely related to the relatively low reversibility of CIP‐mediated inhibition of gyrase, whereas it then seems the ParE toxins have a more reversible effect. Overall, this indicates that there are distinguishable effects of gyrase inhibition that are influenced by an inhibitor mode of action.
From these data, we cannot rule out a potential role of correct folding or inclusion body formation from overexpression (Lee et al., 2008). However, the parental vector pTXB has equivalent expression of the chitin‐binding domain fusion protein yet has no toxicity or effect on cell morphology; the same results were found for the GST tag present with the At4 toxin. Further, an analogous phenotype is induced by treatment with CIP, which clearly is not mediated by protein overexpression or inclusion bodies. Finally, studies in yeast cells noted deleterious effects of protein overexpression at a threshold of 15% of the total protein (Eguchi et al., 2018); the ParE toxin expression is clearly quite low in the context of the total culture (Figure A2). In general, there are many cautionary reports of TA system activity, including strain‐to‐strain variation, plasmid copy numbers, inductions levels, and phage contamination (Nikolic, 2018). The current studies were designed to minimize these factors by using a common expression strain for all toxins, as well as the same inducible promoters, yet with somewhat different construct designs to probe for effects of affinity tag identity, location, and selection antibiotic. Based on these considerations, overall the data are most consistent with the observed effects on cell viability and morphology being caused by the direct action of the individual ParE toxins.
5. CONCLUSIONS
This study demonstrates that the potency of individual ParE toxins is variable with respect to the timing of cell death, which is correlated with the extent of filamentation visible in cultures (summarized in Table A2). The physiological role of this chromosomally encoded toxin family remains unknown, as do the molecular interactions with its target. A change in cell morphology has been previously characterized as a survival mechanism of E. coli present in urinary tract infections (French, Cote, Stokes, Truant, & Brown, 2017; Justice, Hunstad, Cegelski, & Hultgren, 2008; Klein, Palarasah, Kolmos, Moller‐Jensen, & Andersen, 2015), and CIP‐induced filaments were found to give rise to antibiotic‐resistant populations (Bos et al., 2015). This survival mechanism is linked to pathway activation in response to DNA breaks, thus promoting error‐prone repair and driving evolution (Recacha et al., 2017; Torres‐Barcelo et al., 1816; Valencia, Esposito, Spira, Blazquez, & Galhardo, 2017). Further studies have identified that the coordination of DNA repair after DNA damage, arising from CIP in this study, can accurately predict the emergence of a persister phenotype (Mok & Brynildsen, 2018). Other outcomes from DNA breaks include an “evolvability” factor intrinsic to DNA repair resulting when transcription and replication collide (Ragheb et al., 2019). Consistent with this idea, ParE toxins also cause increased abortive replication at the E. coli oriC origin, which arises as a direct effect of gyrase inhibition. While chromosomal ParE toxins induce a common phenotypic outcome, the extent is variable and dependent on sequence‐specific features that may encode the key to understanding the physiological function within the context of the native host cell.
CONFLICT OF INTERESTS
None declared.
AUTHOR CONTRIBUTIONS
The study was conceptualized by MM and CRB, investigations were carried out by MM, TM, JRA, FZN, and CRB, methodology and formal analysis were done by FZN and CRB, data curation, funding acquisition, resources, supervision, and project administration were provided by CRB. CRB wrote the original draft, and all authors participated in review and editing.
ETHICS STATEMENT
None required.
ACKNOWLEDGMENTS
Research reported in this publication was supported by an Institutional Development Award (IDeA) from the National Institute of General Medical Sciences of the National Institutes of Health under grant number P20GM103640, and in part through the award for project number HR17‐099 from the Oklahoma Center for the Advancement of Science and Technology, and by start‐up funds provided by the University of Oklahoma. We are grateful to the Protein Production Core facility and the Chemistry and Biochemistry Bioinformatics Core facility at the University of Oklahoma for help with sample preparation and analysis. Microscopy was carried out at the Oklahoma Medical Research Foundation imaging core facility, and with assistance from the Lutter laboratory at Oklahoma State University. We are grateful for pilot experiments on genomic fragmentation carried out in the Whatley laboratory at Gettysburg College, and pilot filamentation imaging by Shivani Dabadi. The content is solely the responsibility of the authors and does not necessarily represent the official views of the National Institutes of Health. The authors declare that they have no conflicts of interest with the contents of this article.
APPENDIX A.
Figure A1.
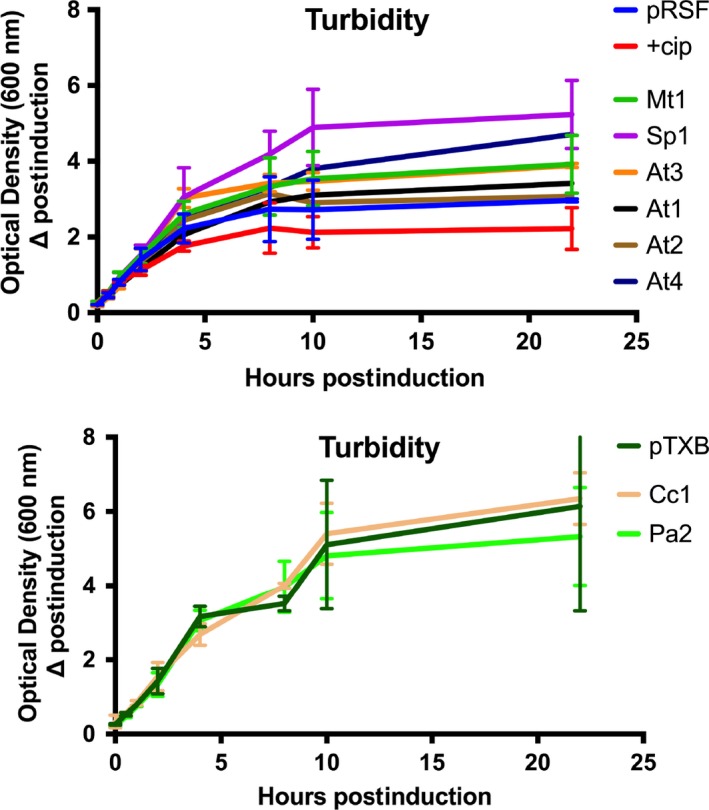
Overexpression of ParE toxins does not produce significant decreases in culture turbidity. Measurements were conducted on at least three biological replicates and are presented as the log of the mean and standard deviation. Upper panel is constructs in the pRSF vector, while lower panel is constructs in the pTXB vector. Turbidity of the modified pET28a vector containing an inserted GST tag was equivalent to the pRSF vector with no insert
Figure A2.
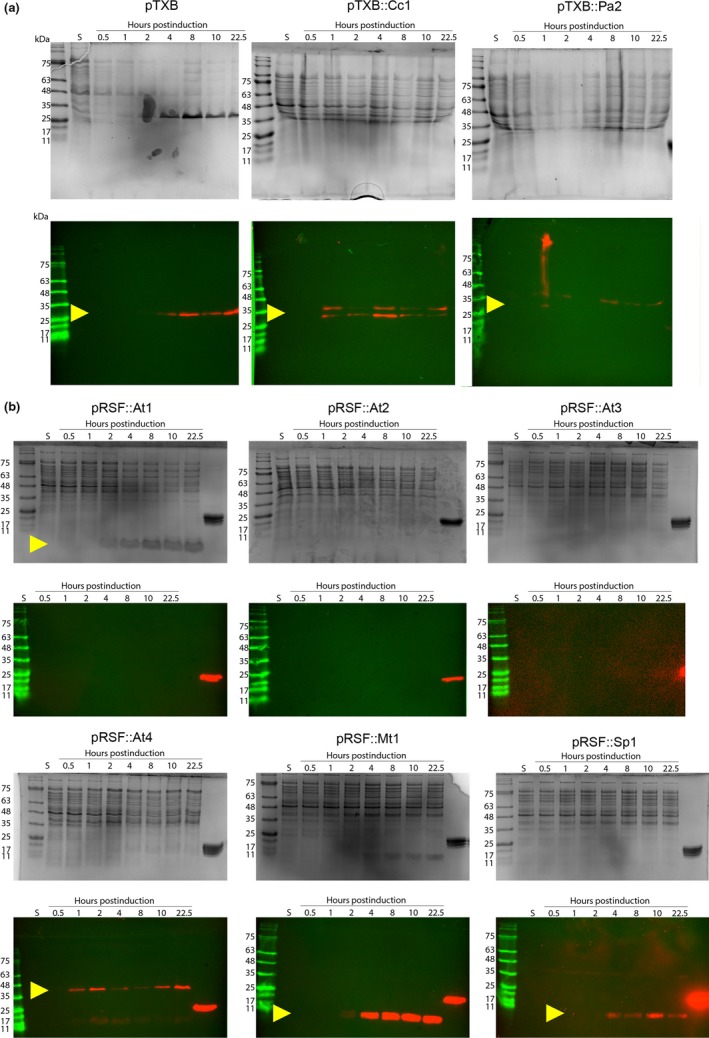
Protein expression levels of ParE toxins vary independent of affinity tag or construct. Cultures were grown in matched LB broth, and (check) total units of optical density were loaded per well. Tris–tricine gels (12%), top panels, were run in duplicate, and the second gel was transferred to nitrocellulose and probed with anti‐chitin (in a) or anti‐His (in b) antibodies, lower panels, to detect protein expression levels. Yellow arrowheads indicate expression of the ParE toxins. The right‐most lane on each gel in (b) was loaded with 5 μg of a His‐tagged control protein to facilitate comparisons. Images are representative from at least three independent biological replicates
Table A1.
Materials used in this work
| Plasmids for overexpression | |
| pRSF‐Duet‐1 (Novagen) | RSF origin, KanR, T7 promoter |
| pTXB1 (NEB) | pMB1 origin, AmpR, T7 promoter |
| p28a (Novagen) | pBR322 origin, KanR, T7 promoter; modified to include GST (see below for seq.) |
| Strain used for overexpression | |
| BL21 DE3 pLysS Escherichia coli |
fhuA2 [lon] ompT gal (λ DE3) [dcm] ∆hsdS λ DE3 = λ sBamHIo ∆EcoRI‐B int::(lacI::PlacUV5::T7 gene1) i21 ∆nin5 |
| Sequences of toxins within expression constructs | |
| Agrobacterium tumefaciens ParE1 (At1) |
Affinity tag: M G S S H H H H H H S Q D P Toxin: M T G V S R H G Y G T G L R S I A Y R D R V I F F R V N N G E L T V M R V L H G H Q D I S A D D F K Q E E N |
| Agrobacterium tumefaciens ParE2 (At2) |
Affinity tag: M G S S H H H H H H S Q D P Toxin: M N N Y R L S T Q A E N E I L D I F L Y G I E R F G L N Q A R L Y K D G M E S C F Q L L G N N P R M G R S A T I V G E G I R R H E H G S H V I F M K L T V P A C S F S P L S M V G A S A A |
| Agrobacterium tumefaciens ParE3 (At3) |
Affinity tag: M G S S H H H H H H S Q D P Toxin: M S D R R I R W T L R A L R R L D E I G A H I E Q D N P A A A A R V I S R I V S A A D M L V E Q P A I G R V G R I K G T R D A V L S D I S Y I I A Y R V G R D I E I L T I I H T S R R W P S A L |
| Agrobacterium tumefaciens ParE4 (At4) |
Toxin: M K L V W T L S S W D D Y E F W Q R T D A R M V E K I N D L I R N A K R T P F A G L G K P E P L K G D M A G Y W S R R I T A E H R F V Y R V S G S G S E Q R L E V I Q C R F H Y Q Fusion tag: G S E F L E V L F Q G P M S P I L G Y W K I K G L V Q P T R L L L E Y L E E K Y E E H L Y E R D E G D K W R N K K F E L G L E F P N L P Y Y I D G D V K L T Q S M A I I R Y I A D K H N M L G G C P K E R A E I S M L E G A V L D I R Y G V S R I A Y S K D F E T L K V D F L S K L P E M L K M F E D R L C H K T Y L N G D H V T H P D F M L Y D A L D V V L Y M D P M C L D A F P K L V C F K K R I E A I P Q I D K Y L K S S K Y I A W P L Q G W Q A T F G G G D H P P K S D L E H H H H H H |
| Caulobacter crescentus ParE1 (Cc1) |
Toxin: M K P Y R L S R R A K A D L D D I W T Y S E Q R W G V E Q A A D Y A R E L Q A T I E M I A E H P G M G Q P D E N L R A G Y R R C A S G S H V V F Y R V G V R V E I I R V L H Q S M N A R A H L G Fusion protein: C I T G D A L V A L P E G E S V R I A D I V P G A R P N S D N A I D L K V L D R H G N P V L A D R L F H S G E H P V Y T V R T V E G L R V T G T A N H P L L C L V D V A G V P T L L W K L I D E I K P G D Y A V I Q R S A F S V D C A G F A R G K P E F A P T T Y T V G V P G L V R F L E A H H R D P D A Q A I A D E L T D G R F Y Y A K V A S V T D A G V Q P V Y S L R V D T A D H A F I T N G F V |
| Mycobacterium tuberculosis ParE1 (Mt1) |
Affinity tag: M G S S H H H H H H S Q D P Toxin: M S S R Y L L S P A A Q A H L E E I W D C T Y D R W G V D Q A E Q Y L R E L Q H A I D R A A A N P R I G R A C D E I R P G Y R K L S A G S H T L F Y R V T G E G T I D V V R V L H Q R M D V D R T S E R P H N A |
| Pseudomonas aeruginosa ParE2 (Pa2) |
Toxin: M S P V V I R F T D T A E Q S I E D Q V H H L A P F Q G E Q A A L Q S V L S L L D E I E E K I S L A P K G Y P V S Q Q A S L L G V L S Y R E H N T G P Y R V F Y E F H E E Q G E V A V I L V L R Q K Q S V E Q Q L I R Y C L V G P I E Fusion protein: C I T G D A L V A L P E G E S V R I A D I V P G A R P N S D N A I D L K V L D R H G N P V L A D R L F H S G E H P V Y T V R T V E G L R V T G T A N H P L L C L V D V A G V P T L L W K L I D E I K P G D Y A V I Q R S A F S V D C A G F A R G K P E F A P T T Y T V G V P G L V R F L E A H H R D P D A Q A I A D E L T D G R F Y Y A K V A S V T D A G V Q P V Y S L R V D T A D H A F I T N G F V |
| Streptococcus pyogenes ParE1 (Sp1) |
Affinity tag: M G S S H H H H H H S Q D P Toxin: M D Y K K Y Q I I Y A P D V L E K L K E I R D Y I S Q N Y S S T S G Q R K M Q I I S D I E K L E V F P E V G F D A D E K Y G S K I S H Y H S T K G Y T L S K D Y I I L Y R I E G E E N R V V I D Y L L P T Q S D Y I K L F K |
| Vibrio cholera ParE1 (Vc1) |
Toxin: M A Y Y T K E A N F I L I V A V L G Q S Q L P Q K H L K Q S R F V S Fusion protein: C I T G D A L V A L P E G E S V R I A D I V P G A R P N S D N A I D L K V L D R H G N P V L A D R L F H S G E H P V Y T V R T V E G L R V T G T A N H P L L C L V D V A G V P T L L W K L I D E I K P G D Y A V I Q R S A F S V D C A G F A R G K P E F A P T T Y T V G V P G L V R F L E A H H R D P D A Q A I A D E L T D G R F Y Y A K V A S V T D A G V Q P V Y S L R V D T A D H A F I T N G F V |
| pET28a modified vector (GST + His affinity tag) |
Vector derived sequence: M G S S H H H H H H S S G L V P R G S H M A S M T G G Q Q M G R G S Fusion tag: E F L E V L F Q G P M S P I L G Y W K I K G L V Q P T R L L L E Y L E E K Y E E H L Y E R D E G D K W R N K K F E L G L E F P N L P Y Y I D G D V K L T Q S M A I I R Y I A D K H N M L G G C P K E R A E I S M L E G A V L D I R Y G V S R I A Y S K D F E T L K V D F L S K L P E M L K M F E D R L C H K T Y L N G D H V T H P D F M L Y D A L D V V L Y M D P M C L D A F P K L V C F K K R I E A I P Q I D K Y L K S S K Y I A W P L Q G W Q A T F G G G D H P P K S D L E H H H H H H |
Table A2.
Summary of toxin‐mediated effects
| Sample | Category | Turbidity | CFU/ml | Protein Exprn. | Cell staining | Filamentation | oriC copy number |
|---|---|---|---|---|---|---|---|
| pRSF/ pTXB/ p28GST | Negative control | Baseline | Baseline | Baseline (pTXB,p28) | Normal | None | Baseline |
| pRSF + CIP | Positive control | − | Loss (complete @6 hr) | ND |
DAPI: Multifoci nucleoids Nile Red: Limited membrane blebs Live/Dead: Green with red halos |
Very prominent | Increased |
| Sp1 | No toxicity | + | NC | Weak |
DAPI: Elongated nucleoids Nile Red: Many membrane blebs Live/Dead: Green with faint red |
Prominent | Increased |
| Cc1 | No toxicity | NC | NC | Baseline |
DAPI: Normal and some multifoci Nile Red: Many membrane blebs Live/Dead: Mix of green and red cells |
Prominent | ND |
| Pa2 | No toxicity | NC | NC | Weak |
DAPI: Normal Nile Red: Many membrane blebs Live/Dead: Normal |
Modest | ND |
| At2 | Toxicity by 4 hr | NC | Loss (complete @2 hr) | No signal |
DAPI: Elongated nucleoids Nile Red: Many membrane blebs Live/Dead: Green with intense compact internal red |
Prominent | ND |
| At3 | Toxicity by 4 hr | + | Loss (lowest @2 hr) | No signal |
DAPI: Multifoci nucleoids Nile Red: Membrane blebs Live/Dead: Normal |
Somewhat prominent | Increased |
| Mt1 | Toxicity by 4 hr | + | Loss (complete @2 hr) | Strong |
DAPI: Multifoci and elongated nucleoids Nile Red: Membrane blebs Live/Dead: Green with intense compact internal red |
Prominent | Very high |
| Vc1 | Toxicity by 4 hr | NC | Loss (lowest @2 hr) | Baseline |
DAPI: Elongated nucleoids Nile Red: Membrane blebs Live/Dead: Normal |
Somewhat prominent | ND |
| At1 | Delayed toxicity (by 10 hr) | NC | Delayed loss (Starts after 10 hr) | Weak |
DAPI: Normal, many 2 foci Nile Red: Normal Live/Dead: Green 4 hr, red 8 hr |
Very modest | ND |
| At4 | Delayed toxicity (by 10 hr) | + | Delayed loss (Starts after 10 hr) | Weak |
DAPI: Normal, many 2 foci Nile Red: Normal Live/Dead: Green 4 hr, Compact green with red halo 8 hr |
Very modest | ND |
Abbreviations: NC, no change; ND, no data.
Table A3.
Total number of cells in each measured population used to determine filamentation lengths
| 4 hr | 15 hr | |
|---|---|---|
| pTXB | 258 | 929 |
| pRSF | 459 | 1,722 |
| P28GST | 140 | 504 |
| pRSF + CIP | 103 | 146 |
| Sp1 | 122 | 439 |
| Cc1 | 208 | 213 |
| Pa2 | 437 | 232 |
| At2 | 74 | 139 |
| At3 | 136 | 158 |
| Mt1 | 80 | 136 |
| At1 | 141 | 733 |
| At4 | 176 | 1,529 |
Ames JR, Muthuramalingam M, Murphy T, Najar FZ, Bourne CR. Expression of different ParE toxins results in conserved phenotypes with distinguishable classes of toxicity. MicrobiologyOpen. 2019;8:e902 10.1002/mbo3.902
Ames and Muthuramalingam equally contributed to this work.
DATA AVAILABILITY STATEMENT
The genomic datasets generated and analyzed during the current study are available at NCBI Bioproject accession number PRJNA548376 with BioSample accession codes SAMN12024304 (sample CIP), SAMN12024305 (sample Sp1), SAMN12024306 (sample At3), SAMN12024307 (sample Mt1), and SAMN12024308 (sample pRSF). Additional microscopic images, clones, and other materials are available from the corresponding author on request.
REFERENCES
- Anantharaman, V. , & Aravind, L. New connections in the prokaryotic toxin‐antitoxin network: Relationship with the eukaryotic nonsense‐mediated RNA decay system. Genome Biology 2003, 4(12):R81–R81.15. [DOI] [PMC free article] [PubMed] [Google Scholar]
- Andersen, S. B. , Ghoul, M. , Griffin, A. S. , Petersen, B. , Johansen, H. K. , & Molin, S. (2017). Diversity, prevalence, and longitudinal occurrence of type II toxin‐antitoxin systems of Pseudomonas aeruginosa infecting cystic fibrosis lungs. Frontiers in Microbiology, 8, 1180 10.3389/fmicb.2017.01180 [DOI] [PMC free article] [PubMed] [Google Scholar]
- Biasini, M. , Bienert, S. , Waterhouse, A. , Arnold, K. , Studer, G. , Schmidt, T. , … Schwede, T. (2014). SWISS‐MODEL: Modelling protein tertiary and quaternary structure using evolutionary information. Nucleic Acids Research, 42(Web Server issue), W252–W258. 10.1093/nar/gku340 [DOI] [PMC free article] [PubMed] [Google Scholar]
- Blower, T. R. , Salmond, G. P. , & Luisi, B. F. (2011). Balancing at survival's edge: The structure and adaptive benefits of prokaryotic toxin‐antitoxin partners. Current Opinion in Structural Biology, 21(1), 109–118. 10.1016/j.sbi.2010.10.009 [DOI] [PubMed] [Google Scholar]
- Bos, J. , Zhang, Q. , Vyawahare, S. , Rogers, E. , Rosenberg, S. M. , & Austin, R. H. (2015). Emergence of antibiotic resistance from multinucleated bacterial filaments. Proceedings of the National Academy of Sciences of the United States of America, 112(1), 178–183. 10.1073/pnas.1420702111 [DOI] [PMC free article] [PubMed] [Google Scholar]
- Bushnell, B. (2014). BBMap: A fast, accurate, splice‐aware aligner. [Google Scholar]
- Cheverton, A. M. , Gollan, B. , Przydacz, M. , Wong, C. T. , Mylona, A. , Hare, S. A. , & Helaine, S. (2016). A Salmonella toxin promotes persister formation through acetylation of tRNA. Molecular Cell, 63(1), 86–96. 10.1016/j.molcel.2016.05.002 [DOI] [PMC free article] [PubMed] [Google Scholar]
- Cho, J. , Carr, A. N. , Whitworth, L. , Johnson, B. , & Wilson, K. S. (2017). MazEF toxin‐antitoxin proteins alter Escherichia coli cell morphology and infrastructure during persister formation and regrowth. Microbiology, 163(3), 308–321. 10.1099/mic.0.000436 [DOI] [PubMed] [Google Scholar]
- Coussens, N. P. , & Daines, D. A. (2016). Wake me when it's over – Bacterial toxin‐antitoxin proteins and induced dormancy. Experimental Biology and Medicine, 241(12), 1332–1342. 10.1177/1535370216651938 [DOI] [PMC free article] [PubMed] [Google Scholar]
- Dalton, K. M. , & Crosson, S. (2010). A conserved mode of protein recognition and binding in a ParD‐ParE toxin‐antitoxin complex. Biochemistry, 49(10), 2205–2215. 10.1021/bi902133s [DOI] [PMC free article] [PubMed] [Google Scholar]
- Dao‐Thi, M. H. , Van Melderen, L. , De Genst, E. , Buts, L. , Ranquin, A. , Wyns, L. , & Loris, R. (2004). Crystallization of CcdB in complex with a GyrA fragment. Acta Crystallographica Section D, Biological Crystallography, 60(Pt 6), 1132–1134. 10.1107/S0907444904007814 [DOI] [PubMed] [Google Scholar]
- De Jonge, N. , Simic, M. , Buts, L. , Haesaerts, S. , Roelants, K. , Garcia‐Pino, A. , … Loris, R. (2012). Alternative interactions define gyrase specificity in the CcdB family. Molecular Microbiology, 84(5), 965–978. 10.1111/j.1365-2958.2012.08069.x [DOI] [PubMed] [Google Scholar]
- Ducret, A. , Quardokus, E. M. , & Brun, Y. V. (2016). MicrobeJ, a tool for high throughput bacterial cell detection and quantitative analysis. Nature Microbiology, 1(7), 16077 10.1038/nmicrobiol.2016.77 [DOI] [PMC free article] [PubMed] [Google Scholar]
- Eguchi, Y. , Makanae, K. , Hasunuma, T. , Ishibashi, Y. , Kito, K. , & Moriya, H. (2018). Estimating the protein burden limit of yeast cells by measuring the expression limits of glycolytic proteins. Elife, 7, e34595 10.7554/eLife.34595 [DOI] [PMC free article] [PubMed] [Google Scholar]
- Fiebig, A. , Castro Rojas, C. M. , Siegal‐Gaskins, D. , & Crosson, S. (2010). Interaction specificity, toxicity and regulation of a paralogous set of ParE/RelE‐family toxin‐antitoxin systems. Molecular Microbiology, 77(1), 236–251. 10.1111/j.1365-2958.2010.07207.x [DOI] [PMC free article] [PubMed] [Google Scholar]
- French, S. , Cote, J. P. , Stokes, J. M. , Truant, R. , & Brown, E. D. (2017). Bacteria getting into shape: Genetic determinants of E. coli morphology. MBio, 8(2), e01977‐16. [DOI] [PMC free article] [PubMed] [Google Scholar]
- Guo, M. S. , Haakonsen, D. L. , Zeng, W. , Schumacher, M. A. , & Laub, M. T. (2018). A Bacterial Chromosome structuring protein binds overtwisted DNA to stimulate type II topoisomerases and enable DNA replication. Cell, 175(2), 583–597 e523. 10.1016/j.cell.2018.08.029 [DOI] [PMC free article] [PubMed] [Google Scholar]
- Gupta, M. , Nayyar, N. , Chawla, M. , Sitaraman, R. , Bhatnagar, R. , & Banerjee, N. (2016). The chromosomal parDE2 toxin‐antitoxin system of Mycobacterium tuberculosis H37Rv: Genetic and functional characterization. Frontiers in Microbiology, 7, 886 10.3389/fmicb.2016.00886 [DOI] [PMC free article] [PubMed] [Google Scholar]
- Handel, N. , Hoeksema, M. , Freijo Mata, M. , Brul, S. , & Ter Kuile, B. H. (2015). Effects of stress, reactive oxygen species, and the SOS Response on de novo acquisition of antibiotic resistance in Escherichia coli . Antimicrobial Agents and Chemotherapy, 60(3), 1319–1327. [DOI] [PMC free article] [PubMed] [Google Scholar]
- Harms, A. , Maisonneuve, E. , & Gerdes, K. (2016). Mechanisms of bacterial persistence during stress and antibiotic exposure. Science, 354(6318), aaf4268 10.1126/science.aaf4268 [DOI] [PubMed] [Google Scholar]
- Harms, A. , Stanger, F. V. , Scheu, P. D. , de Jong, I. G. , Goepfert, A. , Glatter, T. , … Dehio, C. (2015). Adenylylation of gyrase and topo IV by FicT toxins disrupts bacterial DNA topology. Cell Reports, 12(9), 1497–1507. 10.1016/j.celrep.2015.07.056 [DOI] [PubMed] [Google Scholar]
- Harris, L. K. , & Theriot, J. A. (2018). Surface area to volume ratio: A natural variable for bacterial morphogenesis. Trends in Microbiology, 26(10), 815–832. 10.1016/j.tim.2018.04.008 [DOI] [PMC free article] [PubMed] [Google Scholar]
- Haugan, M. S. , Lobner‐Olesen, A. , & Frimodt‐Moller, N. (2018). Comparative activity of ceftriaxone, ciprofloxacin and gentamicin as a function of bacterial growth rate probed by Escherichia coli chromosome replication in the mouse peritonitis model. Antimicrobial Agents and Chemotherapy, 63(2), e02133–18. [DOI] [PMC free article] [PubMed] [Google Scholar]
- Hayes, F. , & Kedzierska, B. (2014). Regulating toxin‐antitoxin expression: Controlled detonation of intracellular molecular timebombs. Toxins, 6(1), 337–358. 10.3390/toxins6010337 [DOI] [PMC free article] [PubMed] [Google Scholar]
- Jensen, R. B. , Grohmann, E. , Schwab, H. , Diaz‐Orejas, R. , & Gerdes, K. (1995). Comparison of ccd of F, parDE of RP4, and parD of R1 using a novel conditional replication control system of plasmid R1. Molecular Microbiology, 17(2), 211–220. 10.1111/j.1365-2958.1995.mmi_17020211.x [DOI] [PubMed] [Google Scholar]
- Jiang, Y. , Pogliano, J. , Helinski, D. R. , & Konieczny, I. (2002). ParE toxin encoded by the broad‐host‐range plasmid RK2 is an inhibitor of Escherichia coli gyrase. Molecular Microbiology, 44(4), 971–979. 10.1046/j.1365-2958.2002.02921.x [DOI] [PubMed] [Google Scholar]
- Justice, S. S. , Hunstad, D. A. , Cegelski, L. , & Hultgren, S. J. (2008). Morphological plasticity as a bacterial survival strategy. Nature Reviews Microbiology, 6(2), 162–168. 10.1038/nrmicro1820 [DOI] [PubMed] [Google Scholar]
- Kamada, K. , & Hanaoka, F. (2005). Conformational change in the catalytic site of the ribonuclease YoeB toxin by YefM antitoxin. Molecular Cell, 19(4), 497–509. 10.1016/j.molcel.2005.07.004 [DOI] [PubMed] [Google Scholar]
- Kedzierska, B. , & Hayes, F. (2016). Emerging roles of toxin‐antitoxin modules in bacterial pathogenesis. Molecules, 21(6), E790 10.3390/molecules21060790 [DOI] [PMC free article] [PubMed] [Google Scholar]
- Klein, K. , Palarasah, Y. , Kolmos, H. J. , Moller‐Jensen, J. , & Andersen, T. E. (2015). Quantification of filamentation by uropathogenic Escherichia coli during experimental bladder cell infection by using semi‐automated image analysis. Journal of Microbiological Methods, 109, 110–116. 10.1016/j.mimet.2014.12.017 [DOI] [PubMed] [Google Scholar]
- Kreuzer, K. N. (2013). DNA damage responses in prokaryotes: Regulating gene expression, modulating growth patterns, and manipulating replication forks. Cold Spring Harbor Perspectives in Biology, 5(11), a012674 10.1101/cshperspect.a012674 [DOI] [PMC free article] [PubMed] [Google Scholar]
- Lee, K. K. , Jang, C. S. , Yoon, J. Y. , Kim, S. Y. , Kim, T. H. , Ryu, K. H. , & Kim, W. (2008). Abnormal cell division caused by inclusion bodies in E. coli; increased resistance against external stress. Microbiological Research, 163(4), 394–402. 10.1016/j.micres.2008.03.004 [DOI] [PubMed] [Google Scholar]
- Lewis, K. (2010). Persister cells. Annual Review of Microbiology, 64, 357–372. 10.1146/annurev.micro.112408.134306 [DOI] [PubMed] [Google Scholar]
- Li, H. , & Durbin, R. (2010). Fast and accurate long‐read alignment with Burrows‐Wheeler transform. Bioinformatics, 26(5), 589–595. 10.1093/bioinformatics/btp698 [DOI] [PMC free article] [PubMed] [Google Scholar]
- Magnan, D. , & Bates, D. (2015). Regulation of DNA replication initiation by chromosome structure. Journal of Bacteriology, 197(21), 3370–3377. 10.1128/JB.00446-15 [DOI] [PMC free article] [PubMed] [Google Scholar]
- Magnan, D. , Joshi, M. C. , Barker, A. K. , Visser, B. J. , & Bates, D. (2015). DNA replication initiation is blocked by a distant chromosome‐membrane attachment. Current Biology, 25(16), 2143–2149. 10.1016/j.cub.2015.06.058 [DOI] [PMC free article] [PubMed] [Google Scholar]
- Makarova, K. S. , Wolf, Y. I. , & Koonin, E. V. (2009). Comprehensive comparative‐genomic analysis of type 2 toxin‐antitoxin systems and related mobile stress response systems in prokaryotes. Biology Direct, 4, 19–56. 10.1186/1745-6150-4-19 [DOI] [PMC free article] [PubMed] [Google Scholar]
- Mok, W. W. K. , & Brynildsen, M. P. (2018). Timing of DNA damage responses impacts persistence to fluoroquinolones. Proceedings of the National Academy of Sciences of the United States of America, 115(27), E6301–E6309. 10.1073/pnas.1804218115 [DOI] [PMC free article] [PubMed] [Google Scholar]
- Mukherjee, A. , Cao, C. , & Lutkenhaus, J. (1998). Inhibition of FtsZ polymerization by SulA, an inhibitor of septation in Escherichia coli . Proceedings of the National Academy of Sciences of the United States of America, 95(6), 2885–2890. 10.1073/pnas.95.6.2885 [DOI] [PMC free article] [PubMed] [Google Scholar]
- Muthuramalingam, M. , White, J. C. , & Bourne, C. R. (2016). Toxin‐antitoxin modules are pliable switches activated by multiple protease pathways. Toxins, 8(7), 214–229. 10.3390/toxins8070214 [DOI] [PMC free article] [PubMed] [Google Scholar]
- Muthuramalingam, M. , White, J. C. , Murphy, T. , Ames, J. R. , & Bourne, C. R. (2018). The toxin from a ParDE toxin‐antitoxin system found in Pseudomonas aeruginosa offers protection to cells challenged with anti‐gyrase antibiotics. Molecular Microbiology, 111(2), 441–454. [DOI] [PMC free article] [PubMed] [Google Scholar]
- Nakanishi, A. , Oshida, T. , Matsushita, T. , Imajoh‐Ohmi, S. , & Ohnuki, T. (1998). Identification of DNA gyrase inhibitor (GyrI) in Escherichia coli . The Journal of Biological Chemistry, 273(4), 1933–1938. [DOI] [PubMed] [Google Scholar]
- Nikolic, N. (2018). Autoregulation of bacterial gene expression: Lessons from the MazEF toxin‐antitoxin system. Current Genetics, 65(1), 133–138. 10.1007/s00294-018-0879-8 [DOI] [PMC free article] [PubMed] [Google Scholar]
- Norton, J. P. , & Mulvey, M. A. (2012). Toxin‐antitoxin systems are important for niche‐specific colonization and stress resistance of uropathogenic Escherichia coli . PLoS Path, 8(10), e1002954 10.1371/journal.ppat.1002954 [DOI] [PMC free article] [PubMed] [Google Scholar]
- Pandey, D. P. , & Gerdes, K. (2005). Toxin‐antitoxin loci are highly abundant in free‐living but lost from host‐associated prokaryotes. Nucleic Acids Research, 33(3), 966–976. 10.1093/nar/gki201 [DOI] [PMC free article] [PubMed] [Google Scholar]
- Park, S. J. , Son, W. S. , & Lee, B. J. (2013). Structural overview of toxin‐antitoxin systems in infectious bacteria: A target for developing antimicrobial agents. Biochimica et Biophysica Acta, 1843(6), 1155–1167. 10.1016/j.bbapap.2013.02.027 [DOI] [PubMed] [Google Scholar]
- Peters, J. M. , Colavin, A. , Shi, H. , Czarny, T. L. , Larson, M. H. , Wong, S. , … Gross, C. A. (2016). A comprehensive, CRISPR‐based functional analysis of essential genes in bacteria. Cell, 165(6), 1493–1506. 10.1016/j.cell.2016.05.003 [DOI] [PMC free article] [PubMed] [Google Scholar]
- Pettersen, E. F. , Goddard, T. D. , Huang, C. C. , Couch, G. S. , Greenblatt, D. M. , Meng, E. C. , & Ferrin, T. E. (2004). UCSF Chimera–a visualization system for exploratory research and analysis. Journal of Computational Chemistry, 25(13), 1605–1612. 10.1002/jcc.20084 [DOI] [PubMed] [Google Scholar]
- Quinlan, A. R. , & Hall, I. M. (2010). BEDTools: A flexible suite of utilities for comparing genomic features. Bioinformatics, 26(6), 841–842. 10.1093/bioinformatics/btq033 [DOI] [PMC free article] [PubMed] [Google Scholar]
- Ragheb, M. N. , Thomason, M. K. , Hsu, C. , Nugent, P. , Gage, J. , Samadpour, A. N. , … Merrikh, H. (2019). Inhibiting the evolution of antibiotic resistance. Molecular Cell, 73(1), 157–165 e155. 10.1016/j.molcel.2018.10.015 [DOI] [PMC free article] [PubMed] [Google Scholar]
- Recacha, E. , Machuca, J. , Díaz de Alba, P. , Ramos‐Güelfo, M. , Docobo‐Pérez, F. , Rodriguez‐Beltrán, J. , … Rodríguez‐Martínez, J. M. (2017). Quinolone resistance reversion by targeting the SOS response. MBio, 8(5), e00971–17 10.1128/mBio.00971-17 [DOI] [PMC free article] [PubMed] [Google Scholar]
- Reece, R. J. , & Maxwell, A. (1991). DNA gyrase: Structure and function. Critical Reviews in Biochemistry and Molecular Biology, 26(3–4), 335–375. 10.3109/10409239109114072 [DOI] [PubMed] [Google Scholar]
- Robert, X. , & Gouet, P. (2014). Deciphering key features in protein structures with the new ENDscript server. Nucleic Acids Research, 42(Web Server issue), W320–W324. 10.1093/nar/gku316 [DOI] [PMC free article] [PubMed] [Google Scholar]
- Roberts, R. C. , Strom, A. R. , & Helinski, D. R. (1994). The parDE operon of the broad‐host‐range plasmid RK2 specifies growth inhibition associated with plasmid loss. Journal of Molecular Biology, 237(1), 35–51. 10.1006/jmbi.1994.1207 [DOI] [PubMed] [Google Scholar]
- Samadpour, A. N. , & Merrikh, H. (2018). DNA gyrase activity regulates DnaA‐dependent replication initiation in Bacillus subtilis . Molecular Microbiology, 108(2), 115–127. [DOI] [PMC free article] [PubMed] [Google Scholar]
- Schindelin, J. , Rueden, C. T. , Hiner, M. C. , & Eliceiri, K. W. (2015). The ImageJ ecosystem: An open platform for biomedical image analysis. Molecular Reproduction and Development, 82(7–8), 518–529. 10.1002/mrd.22489 [DOI] [PMC free article] [PubMed] [Google Scholar]
- Schureck, M. A. , Repack, A. , Miles, S. J. , Marquez, J. , & Dunham, C. M. (2016). Mechanism of endonuclease cleavage by the HigB toxin. Nucleic Acids Research, 44(16), 7944–7953. 10.1093/nar/gkw598 [DOI] [PMC free article] [PubMed] [Google Scholar]
- Sevin, E. W. , & Barloy‐Hubler, F. (2007). RASTA‐Bacteria: A web‐based tool for identifying toxin‐antitoxin loci in prokaryotes. Genome Biology, 8(8), R155 10.1186/gb-2007-8-8-r155 [DOI] [PMC free article] [PubMed] [Google Scholar]
- Shah, D. , Zhang, Z. , Khodursky, A. , Kaldalu, N. , Kurg, K. , & Lewis, K. (2006). Persisters: A distinct physiological state of E. coli . BMC Microbiology, 6, 53. [DOI] [PMC free article] [PubMed] [Google Scholar]
- Shao, Y. , Harrison, E. M. , Bi, D. , Tai, C. , He, X. , Ou, H.‐Y. , … Deng, Z. (2011). TADB: A web‐based resource for Type 2 toxin‐antitoxin loci in bacteria and archaea. Nucleic Acids Research, 39(Database issue), D606–D611. 10.1093/nar/gkq908 [DOI] [PMC free article] [PubMed] [Google Scholar]
- Sia, E. A. , Roberts, R. C. , Easter, C. , Helinski, D. R. , & Figurski, D. H. (1995). Different relative importances of the par operons and the effect of conjugal transfer on the maintenance of intact promiscuous plasmid RK2. Journal of Bacteriology, 177(10), 2789–2797. 10.1128/jb.177.10.2789-2797.1995 [DOI] [PMC free article] [PubMed] [Google Scholar]
- Simmons, L. A. , Foti, J. J. , Cohen, S. E. , & Walker, G. C. (2008). The SOS regulatory network. EcoSal Plus, 3(1). 10.1128/ecosalplus.5.4.3 [DOI] [PubMed] [Google Scholar]
- Sobecky, P. A. , Easter, C. L. , Bear, P. D. , & Helinski, D. R. (1996). Characterization of the stable maintenance properties of the par region of broad‐host‐range plasmid RK2. Journal of Bacteriology, 178(7), 2086–2093. 10.1128/jb.178.7.2086-2093.1996 [DOI] [PMC free article] [PubMed] [Google Scholar]
- Song, S. , & Wood, T. K. (2018). Post‐segregational killing and phage inhibition are not mediated by cell death through toxin/antitoxin systems. Frontiers in Microbiology, 9, 814 10.3389/fmicb.2018.00814 [DOI] [PMC free article] [PubMed] [Google Scholar]
- Sprenger, H. , Kienesberger, S. , Pertschy, B. , Pöltl, L. , Konrad, B. , Bhutada, P. , … Zechner, E. L. (2017). Fic proteins of Campylobacter fetus subsp. venerealis form a network of functional toxin‐antitoxin systems. Frontiers in Microbiology, 8, 1965 10.3389/fmicb.2017.01965 [DOI] [PMC free article] [PubMed] [Google Scholar]
- Sterckx, Y. G. , Jove, T. , Shkumatov, A. V. , Garcia‐Pino, A. , Geerts, L. , De Kerpel, M. , … Loris, R. (2016). A unique hetero‐hexadecameric architecture displayed by the Escherichia coli O157 PaaA2‐ParE2 antitoxin‐toxin complex. Journal of Molecular Biology, 428(8), 1589–1603. 10.1016/j.jmb.2016.03.007 [DOI] [PubMed] [Google Scholar]
- Stothard, P. (2000). The sequence manipulation suite: JavaScript programs for analyzing and formatting protein and DNA sequences. BioTechniques, 28(6), 1102–1104. 10.2144/00286ir01 [DOI] [PubMed] [Google Scholar]
- Torres‐Barcelo, C. , Kojadinovic, M. , Moxon, R. , & MacLean, R. C. (1816). The SOS response increases bacterial fitness, but not evolvability, under a sublethal dose of antibiotic. Proc Biol Sci, 2015(282), 20150885 10.1098/rspb.2015.0885 [DOI] [PMC free article] [PubMed] [Google Scholar]
- Valencia, E. Y. , Esposito, F. , Spira, B. , & Blazquez, J. , & Galhardo, R. (2017). Ciprofloxacin‐mediated mutagenesis is suppressed by subinhibitory concentrations of amikacin in Pseudomonas aeruginosa . Antimicrobial Agents and Chemotherapy, 61(3), e02107‐16 10.1128/AAC.02107-16 [DOI] [PMC free article] [PubMed] [Google Scholar]
- Van Acker, H. , Sass, A. , Dhondt, I. , Nelis, H. J. , & Coenye, T. (2014). Involvement of toxin‐antitoxin modules in Burkholderia cenocepacia biofilm persistence. Pathogens and Disease, 71(3), 326–335. [DOI] [PubMed] [Google Scholar]
- Van Melderen, L. , Bernard, P. , & Couturier, M. (1994). Lon‐dependent proteolysis of CcdA is the key control for activation of CcdB in plasmid‐free segregant bacteria. Molecular Microbiology, 11(6), 1151–1157. 10.1111/j.1365-2958.1994.tb00391.x [DOI] [PubMed] [Google Scholar]
- Williams, A. B. , & Schumacher, B. (2017). DNA damage responses and stress resistance: Concepts from bacterial SOS to metazoan immunity. Mechanisms of Ageing and Development, 165(Pt A), 27–32. 10.1016/j.mad.2016.09.007 [DOI] [PMC free article] [PubMed] [Google Scholar]
- Williams, J. J. , & Hergenrother, P. J. (2012). Artificial activation of toxin‐antitoxin systems as an antibacterial strategy. Trends in Microbiology, 20(6), 291–298. 10.1016/j.tim.2012.02.005 [DOI] [PMC free article] [PubMed] [Google Scholar]
- Xie, Y. , Wei, Y. , Shen, Y. , Li, X. , Zhou, H. , Tai, C. , … Ou, H. Y. (2018). TADB 2.0: An updated database of bacterial type II toxin‐antitoxin loci. Nucleic Acids Research, 46(D1), D749–D753. 10.1093/nar/gkx1033 [DOI] [PMC free article] [PubMed] [Google Scholar]
- Yuan, J. , Sterckx, Y. , Mitchenall, L. A. , Maxwell, A. , Loris, R. , & Waldor, M. K. (2010). Vibrio cholerae ParE2 poisons DNA gyrase via a mechanism distinct from other gyrase inhibitors. The Journal of Biological Chemistry, 285(51), 40397–40408. [DOI] [PMC free article] [PubMed] [Google Scholar]
- Zhang, Y. , & Inouye, M. (2009). The inhibitory mechanism of protein synthesis by YoeB, an Escherichia coli toxin. The Journal of Biological Chemistry, 284(11), 6627–6638. [DOI] [PMC free article] [PubMed] [Google Scholar]
Associated Data
This section collects any data citations, data availability statements, or supplementary materials included in this article.
Data Availability Statement
The genomic datasets generated and analyzed during the current study are available at NCBI Bioproject accession number PRJNA548376 with BioSample accession codes SAMN12024304 (sample CIP), SAMN12024305 (sample Sp1), SAMN12024306 (sample At3), SAMN12024307 (sample Mt1), and SAMN12024308 (sample pRSF). Additional microscopic images, clones, and other materials are available from the corresponding author on request.