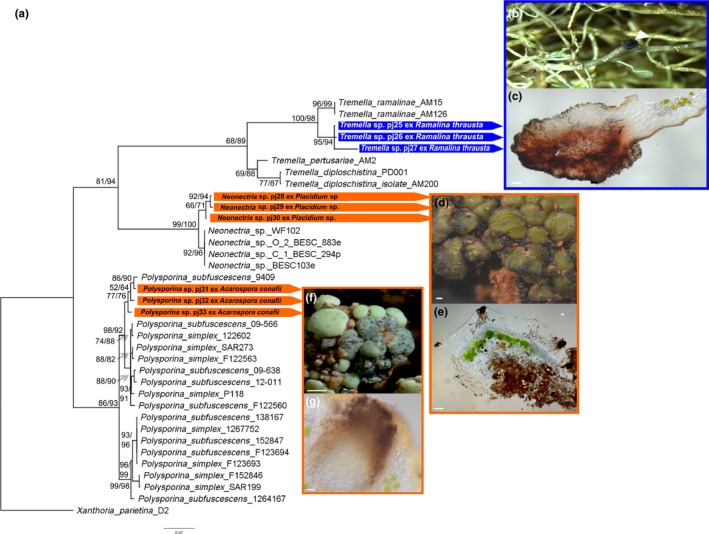
Figure 4.

Phylogenetic tree of the lichenicolous fungi rooted to Xanthoria parietina KJ027708.1 and micrographs. (a) ITS maximum‐likelihood tree of the photobionts. Numbers at nodes represent the ML bootstrap support (values ≥ 50%) and second the posterior probabilities from the Bayesian analysis (values ≥ 50%). The scale indicates the numbers of substitutions per site and generated sequences are connected by color code to the corresponding micrographs (orange = terricolous lichens; blue = epiphytic lichens). Micrographs show the gall of Tremella sp. attached to R. thrausta (white triangle, b) and as thin section of the same gall (c). Neonectria sp. is shown on top of the thallus of Placidium sp. (d) and within the epinecral layer of the lichen (e). The infected thalli of Acarospora conafii are shown in (f) and Polysporina sp. within the pycnidia of the lichen in (g)
