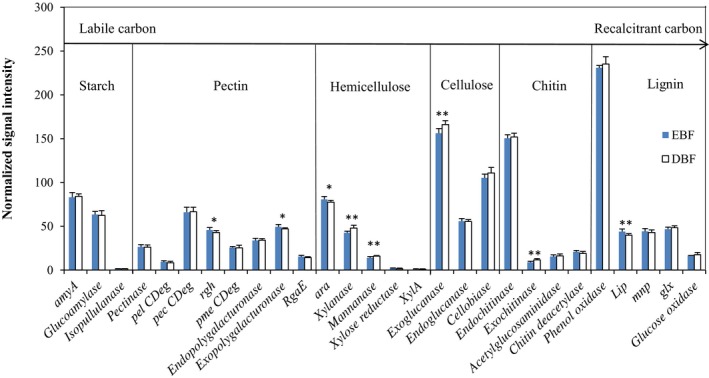
Figure 2.

The normalized average signal intensity of key gene categories involved in C degradation. The signal intensity of each gene is an average of eight samples after transferring into logarithm and dividing by the mean value of each slide. Each bar is presented as mean and standard error (n = 8). Significant differences are denoted by *(p < 0.05) or **(p < 0.01) above corresponding bars
