

SUMMARY
We screen ion channels and transporters throughout the genome to identify those required by human melanoma cells but not by normal human melanocytes. We discover that Mucolipin-1 (MCOLN1), which encodes the lysosomal cation channel TRPML1, is preferentially required for the survival and proliferation of melanoma cells. Loss of MCOLN1/TRPML1 function impairs the growth of patient-derived melanomas in culture and in xenografts but does not affect the growth of human melanocytes. TRPML1 expression and macropinocytosis are elevated in melanoma cells relative to melanocytes. TRPML1 is required in melanoma cells to negatively regulate MAPK pathway and mTORC1 signaling. TRPML1-deficient melanoma cells exhibit decreased survival, proliferation, tumor growth, and macropinocytosis, as well as serine depletion and proteotoxic stress. All of these phenotypes are partially or completely rescued by mTORC1 inhibition. Melanoma cells thus increase TRPML1 expression relative to melanocytes to attenuate MAPK and mTORC1 signaling, to sustain macropinocytosis, and to avoid proteotoxic stress.
In Brief
Kasitinon et al. conduct an in vivo short hairpin RNA (shRNA) screen of ion channels/transporters and identify TRPML1, a lysosomal cation channel, as preferentially required by melanoma cells. TRPML1 negatively regulates MAPK and mTORC1 signaling to maintain protein homeostasis, to sustain macropinocytosis, and to promote the survival and proliferation of melanoma cells.
Graphical Abstract
INTRODUCTION
Ion channels and transporters maintain ion gradients that enable the transport of metabolites across membranes and regulate diverse aspects of cellular physiology (Clapham, 2003; Pardo and Stühmer, 2014). Gain-of-function mutations or amplified expression of ion channels/transporters can drive cancer cell proliferation or disease progression (Beuschlein et al., 2013; Choi et al., 2011; Mu et al., 2003; Scholl et al., 2013; Takahashi et al., 2018). Cancer cells depend upon ion channels/transporters to regulate many cellular processes including intracellular calcium levels (Choi et al., 2011), pH (Webb et al., 2011), oxidative stress (Takahashi et al., 2018), mitochondrial function (McCormack et al., 1990), proliferation (Pardo and Stühmer, 2014), and cellular migration (Pardo and Stühmer, 2014). Consequently, ion channels/transporters have been explored as potential therapeutic targets (Fraser and Pardo, 2008; Monteith et al., 2007).
Endosomes and lysosomes are signaling hubs (Perera and Zoncu, 2016; Settembre et al., 2013). Activated receptors accumulate and signal in endosomes, where adaptor proteins localize signaling molecules (Di Fiore and De Camilli, 2001). Defects in endosome or lysosome function can alter the activation of signal transduction pathways, including the phosphoinositide 3-kinase (PI3K) and mitogen-activated protein kinase (MAPK) pathways (Inamura et al., 2018; Kawashima et al., 2009). Endosome and lysosome function are regulated by cation channels in their membranes, including TRPML1 (Calcraft et al., 2009; Cang et al., 2013; Venkatachalam et al., 2015). TRPML1, which is encoded by the gene MCOLN1, mediates the release of calcium (Ca2+), and potentially other cations, from lysosomes (Dong et al., 2010). It regulates multiple aspects of endolysosomal trafficking, phagocytosis, and the fusion of phagosomes with lysosomes (Dayam et al., 2015; Samie et al., 2013). Loss of MCOLN1 causes mucolipidosis type IV, a disease marked by defects in lysosomal storage and autophagy (Chen et al., 1998). The release of Ca2+ by TRPML1 also activates calcineurin, which promotes the activation of TFEB (Medina et al., 2015; Shen et al., 2012), a master regulator of lysosome biogenesis (Sardiello et al., 2009; Settembre et al., 2011), and calmodulin, which promotes mammalian target of rapamycin complex 1 (mTORC1) activation (Li et al., 2016). TRPML1 promotes MAPK pathway activation in head and neck cancer cells (Jung et al., 2019) and TORC1 activation in Drosophila cells (Wong et al., 2012) while reducing MAPK and PI3K pathway activation in astrocytes (Weinstock et al., 2018).
mTORC1 promotes cellular proliferation by activating anabolic pathways, such as protein synthesis, and by inactivating catabolic pathways, such as autophagy (Saxton and Sabatini, 2017; Valvezan and Manning, 2019). mTORC1 is hyperactivated in some cells with lysosomal storage disorders (Bartolomeo et al., 2017). mTORC1 promotes the growth and proliferation of cancer cells, though it can inhibit the proliferation of amino acid-starved cells by suppressing macropinocytosis, the lysosome-mediated catabolism of proteins taken up from outside the cell (Palm et al., 2015). Macropinocytosis is promoted by MAPK pathway activation and can be an important source of amino acids in cancer cells (Bar-Sagi and Feramisco, 1986; Commisso et al., 2013; Kamphorst et al., 2015; Palm et al., 2015). Indeed, cancer cells with MAPK pathway activation depend on autophagy for metabolic homeostasis (Guo et al., 2016; Poillet-Perez et al., 2018).
Melanoma cells are particularly sensitive to the dysregulation of calcium homeostasis (Eskiocak et al., 2016). Combined inhibition of the ATP1A1 sodium/potassium (Na+/K+) transporter and of the MAPK pathway dysregulates intracellular pH, mitochondrial Ca2+ levels, and mitochondrial function, leading to melanoma cell death (Eskiocak et al., 2016). A clinical trial testing digoxin (an ATP1A1 inhibitor) and trametinib (a mitogen-activated protein kinase [MEK] inhibitor) in patients with advanced, refractory BRAF wild-type melanoma yielded a 20% response rate (Frankel et al., 2017). To test whether there are other ion channels/transporters on which melanoma cells preferentially depend, we performed an in vivo screen. We found that TRPML1 is required by melanoma cells but not normal melanocytes. Surprisingly, TRPML1 promoted tumor formation by negatively regulating the MAPK pathway and mTORC1 signaling to sustain macropinocytosis and to promote protein homeostasis.
RESULTS
Melanoma Cells Preferentially Require MCOLN1
To identify ion channels/transporters on which melanoma cells preferentially depend, we performed an in vivo drop-out screen of a library of short hairpin RNAs (shRNAs) in xenografted melanomas. The library contained 2,589 shRNAs against 572 genes that encode ion channels/transporters, with 3 to 7 shRNAs per gene (Table S1). We infected melanomas from three patients (M214, M481, and M491) with 27 pools of shRNAs (~100 shRNAs per pool), then transplanted the infected cells subcutaneously into NOD-SCID-Il2rg−/− (NSG) mice, allowed tumors to form, and sequenced to compare the abundance of shRNAs in the tumors versus input cells (Figure 1A). Each pool included two scrambled negative control shRNAs and three positive control shRNAs against a gene known to be required by melanoma cells (EIF3A) (Dong and Zhang, 2006). The scrambled negative control shRNAs did not significantly change in abundance in tumors as compared to input cells (Figures 1B–1D) while the positive control shRNAs against EIF3A were significantly depleted (Figures 1B–1D). Based on our criteria (Figure S1A), we identified shRNAs against 40 genes that were significantly depleted in tumors as compared to input cells, suggesting these gene products were required by melanoma cells (Figure S1B).
Figure 1. An In Vivo shRNA Screen Identified MCOLN1 as Being Preferentially Required by Melanoma Cells.

(A) Melanoma cells from three patients (M214, M481, and M491) were transduced with 27 pools of shRNAs targeting ion channels and transporters throughout the human genome. 100,000 infected cells were subcutaneously transplanted into each of 4 NSG mice per pool (324 NSG mice total).
(B–D) In the primary screen of 2,589 shRNAs, shRNAs targeting MCOLN1 (red) were significantly depleted in tumors relative to input cells and in tumors relative to scrambled negative control shRNAs (black) in M214 (B), M481 (C), and M491 (D). Positive control shRNAs against EIF3A (blue) were also significantly depleted.
(E–G) In the secondary screen of 210 shRNAs, shRNAs targeting MCOLN1 (red) were significantly depleted in tumors relative to input cells and in tumors relative to scrambled negative control shRNAs (black) in M214 (E), M481 (F), and M491 (G). Positive control shRNAs against EIF3A (blue) were also significantly depleted.
(H–J) Growth of subcutaneous tumors in mice transplanted with M214 (H), M481 (I), and M491 (J) expressing scrambled control shRNA (black) or two shRNAs against MCOLN1 (red and blue). The data represent mean ± SD from one representative experiment (of two performed) with 5 mice per shRNA per melanoma.
(K) Western blot analysis of TRPML1 and β-actin in melanoma cells expressing two shRNAs against MCOLN1 versus scrambled negative control shRNA. The numbers (1–4) represent tumors from four replicate mice per treatment. The blot reflects one representative experiment (of two performed).
(L) Growth in culture of primary human melanocytes from three donors (hMEL1, hMEL2, and hMEL3) expressing scrambled control shRNA (black) versus two shRNAs against MCOLN1 (red and blue). The data represent mean ± SD from two independent experiments with 3 replicate cultures per melanocyte line per experiment.
Statistical significance was assessed using Kruskal-Wallis tests followed by Dunn’s multiple comparisons tests (B–G), one-way ANOVA or Kruskal-Wallis tests followed by Dunnett’s or Dunn’s multiple comparisons tests, respectively, for the last time points measured (H–J), or one-way ANOVA followed by Dunnett’s multiple comparisons test (L); ns, not significant; *p < 0.05; **p < 0.01; ***p < 0.001.
See also Figure S1.
We performed a secondary screen using 210 shRNAs against the 40 candidate genes, divided into 18 pools (~12 shRNAs per pool). Again, the scrambled negative control shRNAs did not significantly change in abundance in tumors as compared to input cells (Figures 1E–1G), while the positive control shRNAs against EIF3A were significantly depleted (Figures 1E–1G). From this secondary screen, we identified shRNAs against 15 genes that were significantly depleted in the tumors as compared to input cells using the same criteria as in the primary screen (Figures S1A and S1B). We found a significant correlation between the results of the primary and secondary screens (Figure S1C).
All four shRNAs targeting MCOLN1 were significantly depleted in tumors relative to input cells in the primary (Figures 1B–1D) and secondary (Figures 1E–1G) screens. In screens for essential genes, MCOLN1 was not required for the survival of chronic myelogenous leukemia (CML) cells or Burkitt’s lymphoma cells (Blomen et al., 2015; Wang et al., 2015), raising the possibility it is preferentially required by melanoma cells. To test this, we infected melanoma cells from three patients with two shRNAs that efficiently knocked down MCOLN1/TRPML1 (Figure 1K) or scrambled control shRNA, then injected the cells subcutaneously in NSG mice. Both shRNAs against MCOLN1 significantly decreased the growth of tumors relative to control shRNA in all three melanomas (Figures 1H–1J). However, neither shRNA against MCOLN1 significantly affected the growth of melanocytes from three donors (Figure 1L). MCOLN1 is thus required by melanoma cells but not normal melanocytes. Consistent with this, MCOLN1 was more highly expressed by melanoma cells than melanocytes (Figure 2A).
Figure 2. Loss of MCOLN1/TRPML1 Impaired Melanoma Cell Survival In Vitro and In Vivo.

(A) Western blot analysis of TRPML1 and β-actin in melanoma cells derived from 7 patients (melanoma patient-derived xenografts [PDXs]: M214, M405, M481, M491, UT10, M528, and M597) and normal melanocytes derived from 3 donors (hMEL). The blot reflects one representative experiment of two performed.
(B–D) Western blot analysis of TRPML1 and b-actin in parental cells (P) from three melanomas (A375 cell line (B), and M214 (C) and M481 (D) patient-derived melanomas) as well as in 3 clones per melanoma in which MCOLN1 had been deleted using CRISPR. The blot reflects one representative experiment (of two performed) per melanoma.
(E–G) Growth in culture of parental cells (black) versus MCOLN1-deficient clones (red, blue, and green) in A375 (E), M214 (F), and M481 (G).
(H and I) Frequencies of activated caspase 3/7+ cells (H) and Ki-67+ cells (I) among cultured parental cells versus MCOLN1-deficient clones.
(J–L) Growth of subcutaneous tumors in mice transplanted with parental cells versus MCOLN1-deficient clones in A375 (J), M214 (K), and M481 (L). Data show mean ± SD from one representative experiment (of two performed) with 5 mice per clone.
(M and N) Frequencies of activated caspase 3/7+ cells (M) and Ki-67+ cells (N) in subcutaneous tumors grown from parental cells versus MCOLN1-deficient clones. Data represent mean ± SD from two independent experiments with 5 mice per clone per melanoma per experiment.
Statistical significance was assessed using one-way ANOVA or Welch’s one-way ANOVA followed by Dunnett’s or Dunnett’s T3 multiple comparisons tests, respectively, for the last time point measured (E–G and J–L), or one-way ANOVAs followed by Dunnett’s multiple comparisons tests (H and I, M and N). Mean ± SD from two independent experiments with 3 replicate cultures per clone per experiment (E)–(I). ns, not significant; **p < 0.01; ***p < 0.001.
See also Figures S2 and S3.
To independently assess whether MCOLN1/TRPML1 is required by melanoma cells, we deleted MCOLN1 from melanoma cells using CRISPR. We generated three independent clones of MCOLN1-deficient melanoma cells from each of a melanoma cell line (A375) and two patient-derived melanomas (M214 and M481; Figure S2A). In each case, the MCOLN1-deficient clones had a 34-base pair deletion in exon 2, causing a frameshift mutation. Compared to parental cells, the MCOLN1-deficient clones had little MCOLN1 mRNA (Figures S2B–S2D) and no detectable TRPML1 protein (Figures 2B–2D).
All of the MCOLN1-deficient melanoma cells grew significantly more slowly in culture as compared to parental cells (Figures 2E–2G), exhibiting significantly higher frequencies of activated caspase 3/7+ cells (Figure 2H) and significantly lower frequencies of Ki-67+ proliferating cells (Figure 2I). MCOLN1 overexpression in the MCOLN1-deficient cells rescued the growth of these cells in culture (Figures S2E–S2G), demonstrating that their poor growth reflected a loss of MCOLN1/TRPML1 function rather than off-target mutations. After xenografting subcutaneously in NSG mice, all of the MCOLN1-deficient clones formed tumors that grew significantly more slowly as compared to parental cells (Figures 2J–2L). The MCOLN1-deficient tumors always contained significantly higher frequencies of activated caspase 3/7+ cells (Figure 2M) and significantly lower frequencies of Ki-67+ proliferating cells (Figure 2N) as compared to tumors formed by parental cells. MCOLN1/TRPML1 thus promoted the survival and proliferation of human melanoma cells in vitro and in vivo.
These observations may be relevant to patients as melanomas with above-average MCOLN1 expression are associated with significantly worse survival as compared to melanomas with below-average MCOLN1 expression (Figure S3).
Increased MAPK and mTORC1 Signaling
Given that TRPML1 localizes to endosomal/lysosomal membranes (Venkatachalam et al., 2015), which serve as signaling hubs (Perera and Zoncu, 2016; Settembre et al., 2013), we tested whether loss of MCOLN1/TRPML1 affected MAPK and PI3K pathway activation. MCOLN1-deficient melanomas consistently exhibited increased ERK (MAPK1), TSC2, and S6K (RPS6KB1) phosphorylation, and sometimes exhibited increased AKT phosphorylation, as compared to parental melanoma cells (Figures 3A–3C). Overexpression of MCOLN1 in the MCOLN1-deficient melanomas rescued the increases in ERK and S6K phosphorylation (Figures S2H–S2J).
Figure 3. MCOLN1/TRPML1 Deficiency Activated MAPK and mTORC1 Signaling, and MEK Inhibition Blocked the Increase in ERK and mTORC1 Signaling in MCOLN1-Deficient Melanoma Cells.

(A–C) Western blots of p-ERK1/2 (T202/Y204), ERK1/2, p-Akt (S473), Akt, p-S6K (T389), S6K, and b-actin in cultured parental cells (P) or MCOLN1-deficient cells from A375 (A), M214 (B), or M481 (C) melanomas.
(D–F) Western blots of p-ERK1/2, ERK1/2, p-TSC2 (S664), TSC2, p-S6K, S6K, and β-actin in cultured parental cells or MCOLN1-deficient clones from A375 (D), M214 (E), and M481 (F) treated with DMSO (−) or 5 nM trametinib (MEKi; +).
(G–I) Western blots of p-MET (Y1234/1235), MET, p-ERBB3 (Y1289), ERBB3, p-ERK1/2, ERK1/2, p-S6K, S6K, and b-actin in cultured parental cells or MCOLN1-deficient cells from A375 (G), M214 (H), and M481 (I).
All blots reflect one representative experiment (of two performed) per melanoma.
See also Figure S5.
We treated MCOLN1-deficient and parental melanoma cells with the MEK inhibitor, trametinib. Trametinib blocked the increases in ERK, TSC2, and S6K phosphorylation in MCOLN1-deficient clones (Figures 3D–3F), suggesting that the increase in mTORC1 signaling was caused by the phosphorylation and inactivation of TSC2 by the MAPK pathway, as has been observed (Johannessen et al., 2005; Ma et al., 2005; Shaw and Cantley, 2006).
To assess why the MAPK pathway was more highly activated in MCOLN1-deficient as compared to parental melanoma cells, we examined the levels of phosphorylated MET and ERBB3. MET and ERBB3 are tyrosine kinase receptors that are highly expressed by melanoma cells, signal through the MAPK pathway, and promote melanoma cell proliferation (Chin, 2003; Trusolino et al., 2010; Ueno et al., 2008). Activation of these receptors by ligand binding leads to their phosphorylation and internalization into endosomes, where they signal by activating ERKs, until the endosomes fuse with lysosomes and the receptors are degraded (Citri and Yarden, 2006; Trusolino et al., 2010). Phosphorylated MET and ERBB3 levels were consistently elevated in MCOLN1-deficient as compared to parental melanoma cells (Figures 3G–3I). This suggested that MCOLN1 deficiency may increase MAPK pathway activation at least partly by increasing receptor signaling, perhaps as a consequence of altered endosome trafficking or fusion with lysosomes.
To test whether there was altered endosome trafficking in MCOLN1-deficient melanoma cells, we assessed the colocalization of MET and ERBB3 with the endosomal and lysosomal markers, Rab7 and LAMP1 (Rink et al., 2005). MCOLN1-deficient cells showed significantly increased MET (Figures 4A–4D) and ERBB3 (Figures S4A–S4D) colocalization with Rab7 relative to parental cells, suggesting that MET and ERBB3 accumulate in endosomes. Although MCOLN1-deficient cells exhibited a perinuclear accumulation of MET and ERBB3, we observed no significant increase in MET or ERBB3 colocalization with LAMP1 relative to parental cells (Figures 4E–4H and S4E–S4H). These data suggest that MCOLN1-deficient cells exhibited increased MAPK pathway activation due to defects in endosome trafficking or lysosomal fusion.
Figure 4. MET Accumulates in Endosomes in MCOLN1-Deficient Cells.

(A–C) Colocalization of MET with the endosomal marker, Rab7, in parental versus MCOLN1-deficient cells from A375 (A), M214 (B), and M481 (C) melanomas.
(D) Manders colocalization coefficients reporting the fraction of MET staining that co-localized with Rab7 staining.
(E–G) Colocalization of MET with the lysosomal marker, LAMP1, in parental versus MCOLN1-deficient cells from A375 (E), M214 (F), and M481 (G) melanomas.
(H) Manders colocalization coefficients reporting the fraction of MET staining that co-localized with LAMP1 staining.
All data represent mean ± SD from two independent experiments with 3 quantified cells per clone per experiment. Statistical significance was assessed using unpaired two-tailed t tests; ns, not significant; *p < 0.05; ***p < 0.001. Scale bars represent 10μm.
See also Figure S4.
To test whether pharmacological inhibition of endolysosomal fusion phenocopies the effects of MCOLN1 deficiency, we treated cultured melanoma cells with bafilomycin A1, an inhibitor of endosomal and lysosomal fusion (Yamamoto et al., 1998). Bafilomycin A1 treatment phenocopied MCOLN1/TRPML1 deficiency, increasing the levels of multiple receptor tyrosine kinases, activating MAPK and mTORC1 signaling, and inhibiting the expansion of the number of melanoma cells in culture (Figures S5A–S5F). These data suggest that TRPML1 promotes the survival and proliferation of melanoma cells by promoting normal endolysosomal function.
To test whether mTOR activation contributed to the poor proliferation and survival of MCOLN1-deficient melanoma cells, we treated MCOLN1-deficient and parental melanoma cells with the mTOR inhibitor, Torin1 (Thoreen et al., 2009). We used a relatively low concentration of Torin1 (5nM), that blocked the increase in S6K phosphorylation in MCOLN1-deficient cells without completely eliminating mTORC1 signaling (Figures 5A–5C). Torin1 treatment completely, or nearly completely, rescued the growth of MCOLN1-deficient cells in culture (Figures 5D–5F). Torin1 also rescued the growth of bafilomycin A1-treated melanoma cells in culture (Figures S5D–S5F).
Figure 5. mTORC1 Inhibition Rescued the Growth of MCOLN1-Deficient Cells.

(A–C) Western blots of p-Akt (S473), Akt, p-S6K (T389), S6K, and β-actin in cultured parental cells or MCOLN1-deficient clones from A375 (A), M214 (B), and M481 (C) treated with DMSO (−) or 5 nM Torin1 (+). The blot reflects one representative experiment (of three performed) per melanoma.
(D–F) Growth in culture of parental cells (P; black) versus MCOLN1-deficient clones (red, blue, and green) from A375 (D), M214 (E), and M481 (F) treated with DMSO control (solid bars) or 5 nM Torin1 (striped bars) for 21 days. Torin1 treatment significantly rescued the growth of MCOLN1-deficient clones. The data represent mean ± SD from two experiments with 3 replicate cultures per clone per experiment.
(G–I) Growth of subcutaneous tumors in mice transplanted with parental or MCOLN1-deficient cells from A375 (G), M214 (H), and M481 (I) and treated with DMSO control (Ctrl; solid lines) or 5 mg/kg/day Rapamycin (Rapa; dotted lines). The data represent mean ± SD from one representative experiment (of two performed) with 5 mice per clone.
(J–L) Frequency of activated caspase 3/7+ cells in subcutaneous tumors grown from parental cells or MCOLN1-deficient clones from A375 (J), M214 (K), and M481 (L) treated with DMSO control (solid bars) or rapamycin (striped bars). These data represent mean ± SD from two independent experiments with 4 to 5 mice per clone per experiment.
Statistical significance was assessed using two-way ANOVAs followed by Sidak’s and Dunnett’s multiple comparisons tests (D–F), two-way ANOVAs followed by Dunnett’s multiple comparisons tests for the last time points measured (G–I), or Welch’s one-way ANOVAs or one-way ANOVAs followed by Tamhane’s T2, Dunnett’s T3, or Dunnett’s or Sidak’s multiple comparisons tests (J–L); ns, not significant; *p < 0.05; **p < 0.01; ***p < 0.001.
To test if increased mTORC1 activation contributed to the poor growth of MCOLN1-deficient melanomas in vivo, we transplanted MCOLN1-deficient and parental melanoma clones subcutaneously in NSG mice. Once the tumors became palpable, we treated half of the mice daily with the mTORC1 inhibitor rapamycin. Rapamycin did not significantly affect the growth of tumors from parental lines but completely or nearly completely rescued the growth of MCOLN1-deficient tumors (Figures 5G–5I). Rapamycin treatment also rescued the increase in cell death observed in MCOLN1-deficient tumors (Figures 5J–5L). Therefore, MCOLN1/TRPML1 promoted tumor growth and the survival of melanoma cells by negatively regulating mTORC1 signaling.
TRPML1 Promotes Proteostasis
mTORC1 activation promotes protein synthesis by increasing ribosome biogenesis and mRNA translation (Ma and Blenis, 2009; Saxton and Sabatini, 2017). We tested whether MCOLN1-deficient melanoma cells had increased protein synthesis as compared to parental cells by measuring the rate of O-propargyl-puromycin (OP-Puro) incorporation into cultured cells (Liu et al., 2012; Signer et al., 2014). MCOLN1-deficient melanoma cells exhibited significantly increased OP-Puro incorporation relative to parental cells, and this increase was blocked by treatment with Torin1 (Figures 6A–6C). This suggested that TRPML1 negatively regulates protein synthesis in melanoma cells by negatively regulating mTOR signaling.
Figure 6. MCOLN1/TRPML1 Deficiency Increased Protein Synthesis and Proteotoxic Stress as a Result of mTORC1 Activation.

(A–C) Relative rate of incorporation of a pulse of OP-Puro in cultured parental cells (P; black) versus MCOLN1-deficient clones (red, blue, and green) from A375 (A), M214 (B), and M481 (C) treated with DMSO control (solid bars) or 5 nM Torin1 (striped bars). Data represent mean ± SD from two independent experiments with 3 replicate cultures per treatment per clone per experiment.
(D–I) Intracellular protein aggregates were visualized by staining with Proteostat dye (D–F) and then quantified (G–I) in parental cells (black) versus MCOLN1-deficient clones (red) treated with DMSO control (solid bars) or 5 nM Torin1 (striped bars). Data represent mean ± SD from two independent experiments with 3 replicate cultures per treatment per clone per experiment.
(J–L) Western blot analysis of BiP, p-eIF2α (S51), total eIF2α, ATF4, CHOP, p-IRE1α (S724), total IRE1α, and β-actin in cultured parental cells or MCOLN1-deficient cells from A375 (J), M214 (K), and M481 (L) treated with DMSO (−) or 5 nM Torin1 (+). The blot reflects one representative experiment (of two performed) per melanoma. Statistical significance was assessed using two-way ANOVAs followed by Sidak’s and Dunnett’s multiple comparisons tests (A–C) or two-way ANOVAs followed by Sidak’s multiple comparisons tests (G–I); ns, not significant; *p < 0.05; **p < 0.01; ***p < 0.001. Scale bars represent 10μm.
See also Figure S6.
To test whether the increased protein synthesis in MCOLN1-deficient melanoma cells contributed to their impaired growth, we treated MCOLN1-deficient and parental melanoma cells with a low dose of the protein synthesis inhibitor, puromycin. Treatment with puromycin blocked the increase in protein synthesis in MCOLN1-deficient cells (Figures S6A–S6C) and partially rescued the increase in cell death observed in these cells (Figures S6G–S6I) as well as their growth in culture (Figures S6D–S6F).
To better understand the mechanism by which increased protein synthesis led to cell death, we tested whether the MCOLN1-deficient melanoma cells experienced proteotoxic stress. We first assessed intracellular protein aggregation using Proteostat dye, which fluoresces upon binding to protein aggregates (Shen et al., 2011). MCOLN1-deficient melanoma cells exhibited increased Proteostat staining as compared to parental cells, and this difference was rescued by Torin1 treatment (Figures 6D–6I). MCOLN1-deficient cells also exhibited increased levels of BiP (HSPA5), increased phosphorylation of EIF2α (EIF2S1) and IRE1α (ERN1), and increased expression of ATF4 and CHOP (DDIT3), all consistent with the activation of an unfolded protein response (Walter and Ron, 2011). Treatment with Torin1 partially or completely rescued all of these changes (Figures 6J–6L). This suggested that MCOLN1-deficient melanoma cells experience proteotoxic stress as a consequence of increased mTORC1 signaling.
To test if clearing misfolded proteins could rescue the growth of MCOLN1-deficient cells, we treated with a proteasome activator, PD169316, a p38 MAPK (MAPK14) inhibitor that increases 26S proteasome (SEM1) activity (Leestemaker et al., 2017). Treatment with PD169316 reduced the accumulation of protein aggregates in the MCOLN1-deficient cells (Figures S6J–S6L) and partially rescued their growth in culture (Figures S6M–S6O). Therefore, MCOLN1-deficiency impaired the growth of melanoma cells partly by increasing protein synthesis and inducing proteotoxic stress.
TRPML1 Promotes Macropinocytosis and Serine Homeostasis
Given that MCOLN1-deficiency impairs endolysosomal trafficking, phagocytosis, and the fusion of phagosomes with lysosomes (Dayam et al., 2015; Samie et al., 2013) and that mTORC1 signaling can inhibit macropinocytosis (Kamphorst et al., 2015; Palm et al., 2015), we tested if MCOLN1 was necessary for macropinocytosis by melanoma cells. Using a self-quenching albumin that fluoresces upon degradation, DQ-BSA, we found melanoma cells engaged in significantly more macropinocytosis than melanocytes under the same culture conditions, even in medium not depleted for amino acids (Figure S7). MCOLN1-deficient cells exhibited significantly less macropinocytosis as compared to parental cells (Figures 7A–7D), and treatment with trametinib (Figures 7A and 7C) or Torin1 (Figures 7B and 7D) partially or completely rescued the reduction in macropinocytosis. MCOLN1/TRPML1 thus promoted macropinocytosis in melanoma cells partly by negatively regulating MAPK and mTOR signaling.
Figure 7. MCOLN1/TRPML1 Deficiency Impairs Macropinocytosis and Depletes Serine.

(A–D) Macropinocytosis of extracellular protein was measured in cultured parental cells (black) or MCOLN1-deficient clones (red) treated with either DMSO control (solid bars) versus 5 nM trametinib (MEKi; striped bars) (A and C) or DMSO control (solid bars) versus 5 nM Torin1 (striped bars) (B and D) by incubating cells with DQ-BSA for 6 h, followed by confocal imaging. The data represent mean ± SD from two independent experiments with 3 replicate cultures per treatment per clone per experiment.
(E and F) Relative intracellular serine levels in cultured cells (E) or subcutaneous tumors (F) formed by parental cells versus MCOLN1-deficient cells treated with DMSO control (solid bars), Torin1 (E; striped bars), or rapamycin (F; striped bars). The data reflect two independent experiments with 3 replicate cultures per clone per treatment per experiment (E) or 5 mice per clone per treatment per experiment (F).
(G–I) Growth of parental versus MCOLN1-deficient cells from A375 (G), M214 (H), and M481 (I) in cultures containing 0.4 mM L-serine (solid bars) or 2 mM L-serine (striped bars) for 21 days. These data represent mean ± SD from two independent experiments with 3 replicate cultures per treatment per clone per experiment.
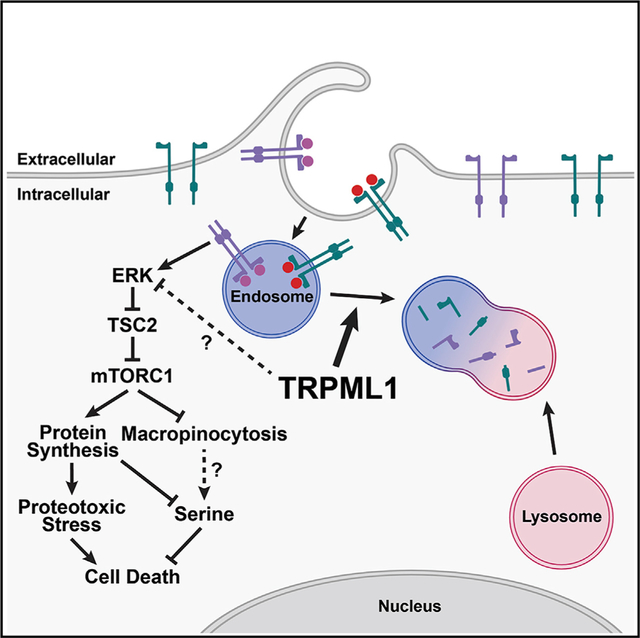
(J) Model of TRPML1 function in melanoma cells.
Statistical significance was assessed using one-way ANOVA or Welch’s one-way ANOVA followed by Sidak’s or Tamhane’s T2 multiple comparisons tests (C and F) or two-way ANOVAs followed by Sidak’s and/or Dunnett’s multiple comparisons tests (D, E, and G–I); ns, not significant; *p < 0.05; **p < 0.01; ***p < 0.001. Scale bars represent 10μm.
See also Figure S7.
We wondered if the increased protein synthesis and decreased macropinocytosis in MCOLN1-deficient melanoma cells would affect amino acid homeostasis. To test this, we performed metabolomics in parental and MCOLN1-deficient melanoma cells, with and without Torin1 treatment in culture. The only metabolite that was significantly depleted in cultured MCOLN1-deficient melanoma cells from all three lines and rescued by Torin1 treatment was serine (Figure 7E). Serine is required for protein, nucleotide, lipid, and glutathione synthesis (Locasale, 2013), and cells can use antiporters to exchange serine for other amino acids (DeNicola et al., 2015). Metabolomic analysis of subcutaneous tumors grown from parental and MCOLN1-deficient melanoma cells confirmed that serine was depleted in MCOLN1-deficient tumors in vivo and that rapamycin treatment rescued this serine depletion (Figure 7F; Table S2). Supplementation of the culture medium with increased L-serine (2 versus 0.4 mM in normal medium) did not significantly affect the growth of parental cells but rescued the growth of MCOLN1-deficient cells (Figures 7G–7I). MCOLN1/ TRPML1 thus promoted the maintenance of intracellular serine levels by negatively regulating mTORC1 signaling, reducing protein synthesis, and increasing macropinocytosis (Figure 7J).
DISCUSSION
Our data suggest that melanoma cells increase TRPML1 expression relative to normal melanocytes (Figure 2A) and that TRPML1 promotes tumor formation by negatively regulating MAPK and mTORC1 signaling (Figures 3A–3C). Our findings suggest that TRPML1 does this by regulating endolysosomal trafficking and fusion, but there could also be additional mechanisms by which TRPML1 inhibits ERK signaling. While cancer cells depend upon the activation of oncogenic signaling pathways, activation of these pathways can have deleterious consequences that impair proliferation and survival (Bartkova et al., 2006; Braig et al., 2005; Chen et al., 2005; Evan et al., 1992; Peterson et al., 2009). Melanoma cells almost always exhibit MAPK pathway activation (Nazarian et al., 2010) but appear to upregulate TRPML1 to avoid overactivation. The increased MAPK pathway and mTORC1 activation in TRPML1-deficient melanoma cells reduced macropinocytosis, increased protein synthesis, depleted serine, and induced proteostatic stress.
TRPML1 is also required for the proliferation of head and neck cancer cells with HRAS mutations (Jung et al., 2019). However, in contrast to our results, MCOLN1/TRPML1 deficiency reduced MAPK pathway activation in those cells by attenuating HRAS clustering. In melanoma, TRPML1 deficiency increased MAPK pathway activation. Increased MAPK and PI3K pathway activation was also observed in astrocytes from Mcoln1-deficient mice, though it is unclear whether this reflected a cell-autonomous effect of TRPML1 deficiency or increased levels of inflammatory cytokines (Weinstock et al., 2018). The opposite results in different cell types may reflect distinct effects of TRPML1 on HRAS signaling, which is not mutated in melanoma (Hodis et al., 2012), or other differences between cells.
It is striking that melanoma cells increased both macropinocytosis (Figure S7) and TRPML1 expression (Figure 2A) relative to normal melanocytes, even in the absence of amino acid starvation. MCOLN1/TRPML1-deficient melanoma cells exhibited serine depletion that contributed to their poor growth in culture (Figures 7E–7I). The increased protein synthesis (Figures 6A–6C) and decreased macropinocytosis (Figures 7A–7D) in MCOLN1-deficient cells may have caused the serine depletion. Serine may also be more sensitive to depletion because amino acid-starved cells sometimes exchange serine for other amino acids (DeNicola et al., 2015). Nonetheless, it is also possible that MCOLN1 deficiency impaired serine biosynthesis. The dependence of melanoma cells upon TRPML1 to attenuate MAPK/mTORC1 signaling, to sustain macropinocytosis, and to prevent proteotoxic stress reveals a new vulnerability.
STAR★METHODS
LEAD CONTACT AND MATERIALS AVAILABILITY
The TRPML1-GFP plasmid generated in this study has been deposited to Addgene. Further information and requests for resources and reagents should be directed to and will be fulfilled by the Lead Contact, Sean Morrison (sean.morrison@utsouthwestern.edu).
EXPERIMENTAL MODEL AND SUBJECT DETAILS
Melanoma specimen collection and enzymatic dissociation
Melanoma specimens were obtained with informed consent from all patients according to protocols approved by the Institutional Review Board of the University of Michigan Medical
School (IRBMED approvals HUM00050754 and HUM00050085) and the University of Texas Southwestern Medical Center (IRB approval 102010–051). The M214 and M481 melanoma specimens were obtained from male patients and M491 was obtained from a female patient. Single cell suspensions were obtained by mechanically dissociating tumors, enzymatically digesting in 200 U/ml collagenase IV (Worthington), DNase (50 U/ml) and 5 mM CaCl2 for 20 min at 37°C, and filtering through a 40-μm cell strainer.
Mouse studies and xenograft assays
All mouse experiments were performed according to protocols approved by the
Institutional Animal Care and Use Committee at UT Southwestern Medical Center (protocol 2016–101360). Melanoma cell suspensions were prepared for injection in 50μl of L15 medium containing 1 mg/ml bovine serum albumin, 1% penicillin/streptomycin, and 10 mM HEPES (pH 7.4), and 25% high-protein Matrigel (Fisher Scientific). Subcutaneous injections were performed in the flanks of NOD.CB17-Prkdcscid Il2rgtm1Wjl/SzJ (NSG) mice. Four to eight-week-old NSG mice were transplanted with 100 melanoma cells subcutaneously unless otherwise specified. Mouse cages were randomized between treatments (mice within the same cage received the same treatment). Both male and female mice were used. Subcutaneous tumor diameters were measured weekly with calipers until any tumor in the mouse cohort reached 2.5 cm in its largest diameter. At that point, all mice in the cohort were killed for analysis.
For in vivo treatment with mTOR inhibitor, the mice were administered rapamycin (LC Laboratories) by oral gavage beginning when the subcutaneous tumors became palpable (5 mg/kg/day in 200 μL of 0.5% hydroxypropyl methyl cellulose with 0.2% Tween80 and 1% DMSO). Tumor growth was monitored weekly with a caliper. Mice were killed for analysis by the time the primary tumor reached 2.5 cm in its largest diameter, or when the mice exhibited signs of distress, whenever was earlier.
Primary melanoma cell cultures
A375 (ATCC; CRL-1619; female), M214 (female), M481 (male), and M491 (male) melanoma cells and melanocytes from three donors (hMEL1 (ATCC; PCS-200–013), hMEL2 (Invitrogen; C-024–5C), hMEL3 (Lonza; CC-2586)) were cultured in tissue-culture-treated plates (Corning) with high-glucose DMEM (GIBCO), 10% fetal bovine serum (FBS; Gemini) and 1% penicillin/streptomycin (Fisher). The sex of the melanocyte donors was not available. All cultures were incubated at 37°C in 5% CO2 and constant humidity. Cells were passaged for 1 to 3 months and used for experiments. All cell lines tested negative for Mycoplasma using the MycoAlert detection kit (Lonza), and the identities of all cell lines were verified using short tandem repeat (STR) profiling in March 2019. To assess the effects of Torin1 (Tocris), Puromycin (Sigma), PD169316 (Sigma), or L-serine (Sigma) on the growth of cells, 1000 parental or MCOLN1-deficient cells were added to each well of a 24-well plate. The small molecules were added 24 hours later, then the cells were counted using a hemocytometer (Hausser Scientific) after 7, 14, or 21 days. The medium was changed every 3–4 days. To assess the effect of bafilomycin A1 (Sigma) and/or Torin1 on melanoma cells (Figure S5), 100,000 melanoma cells were added to each well of a 6-well plate and the drugs were added 24 hours later. After another 48 hours, the cells were counted and protein lysates were collected.
CRISPR editing of MCOLN1 in melanoma cells
Single guide RNAs (sgRNAs) targeting exon 2 of human MCOLN1 were designed using publicly available tools (https://zlab.bio/guide-design-resources):
MCOLN1 sgRNA #1 5′ – TCGCCGTCGTCTCAAATACT – 3′
MCOLN1 sgRNA #2 5′ – TGCGACAAGTTTCGAGCCAA– 3′
The sgRNAs were cloned into the U6-driven Cas9 expression vector (pX458-pSpCas9(BB)-2A-GFP; 48318, Addgene) (Ran et al., 2013). sgRNA insertion was confirmed by Sanger sequencing.
Approximately 100,000 – 500,000 melanoma cells were plated in tissue-culture-treated 6-well plates in DMEM plus 10% FBS and 1% penicillin/streptomycin. 1 μg of each of the two sgRNA constructs was co-transfected into the melanoma cells using polyjet (SignaGen) according to the manufacturer’s instructions. After 36–48 hours, GFP+ cells were flow cytometrically isolated and allowed to recover for 24–48 hours in DMEM plus 10% FBS and 1% penicillin/streptomycin. Single cells were then plated in tissue-culture-treated 96-well plates in Prime-XV tumorsphere medium (Irvine Scientific) supplemented with 2 U/ml Heparin (Sigma), 0.1 μg/ml Hydrocortisone (Sigma), 2% B27 (Thermo Fisher), 1 μM StemRegenin 1 (StemCell Technologies, Inc.), 10% charcoal stripped FBS (Thermo Fisher), 10 μg/ml Bovine Pituitary Extract (BPE; Lonza), 10 ng/ml recombinant human IL-8 (CXCL8; Peprotech), 20 ng/ml recombinant human GRO-α/MGSA (CXCL1; Peprotech), and 25 ng/ml recombinant human HGF (Peprotech). Genomic DNA was isolated from individual clones with QuickExtract (Epicenter), and clones were screened and sequenced for MCOLN1 deletions.
METHOD DETAILS
qPCR
For quantitative reverse transcription PCR (qPCR), RNA from 100,000 melanoma cells was extracted (QIAGEN) and reverse transcribed into cDNA using SuperScript III (Invitrogen). qPCR was performed using a Roche LightCycler480. The primers used for qPCR analysis for MCOLN1 were: 5′- CTGATGCTGCAAGTGGTCAAG-3′ (Forward) and 5′- GGTGTTCTCTTCCCGGAATGTC-3′ (Reverse).
Antibody staining and flow cytometry
All melanomas expressed DsRed and luciferase (Piskounova et al., 2015). All antibody labeling was performed for 20 min on ice, followed by washing with HBSS and centrifugation at 200×g for 5 min. Cells were stained with directly-conjugated antibodies against mouse CD45 (75–0451-U100; 30-F11-violetFluor450; Tonbo), mouse CD31 (48-0311-82; 390-eFluor450; eBiosciences), mouse Ter119 (75–5921-U100; TER-119-violetFluor450; Tonbo) and human HLA-A, B, C (555555; G46–2.6-APC; BD Biosciences). Human melanoma cells were identified and isolated as cells that were positive for DsRed and HLA and negative for mouse CD45, CD31, and Ter119. Cells were resuspended in 4’,6-diamidino-2-phenylindole (DAPI; 1 μg/ml; Sigma) to eliminate dead cells from sorts and analyses. Cells were analyzed or sorted on a FACS Fusion cell sorter (Becton Dickinson), a FACS Aria II SORP cell sorter (Becton Dickinson), or a FACS Canto RUO cell analyzer (Becton Dickinson).
For flow cytometric analysis of activated Cas3/7 staining, cultured melanoma cells were trypsinized with a 0.25% trypsin solution (Fisher) or tumors were enzymatically dissociated as described above. Equal numbers of melanoma cells (500,000–2,000,000) were loaded with 1 μM CellEvent Caspase-3/7 Green in HBSS (Ca2+- and Mg2+-free). Cells were stained for 15–30 min at 37°C. Staining was assessed by flow cytometry, gating on live melanoma cells (positive for human HLA and DsRed and negative for DAPI and mouse CD45/CD31/Ter119).
Ki-67 staining to evaluate proliferation
To assess Ki-67 staining in cultured cells, melanoma cells were grown in 8-well Lab-Tek II Chamber Slides (Thermo). Cells were washed with cold PBS and fixed in 4% paraformaldehyde (Fisher) for 15 min at room temperature. For in vivo experiments, tumor specimens were fixed in 4% paraformaldehyde overnight at 4°C, cryoprotected in 30% sucrose (Sigma) overnight, and frozen in OCT (Fisher). Sections (10 μm) were cut using a cryostat. Cells or tissue sections were permeabilized with PBS supplemented with 0.05% Triton X-100 for 5 min, washed with PBS, and blocked in 5% goat serum (JacksonImmuno) in PBS for 1 hour at room temperature. Cells or tissue sections were then stained with anti-Ki67 antibody (M7240, Dako, 1:100) overnight at 4°C, washed in PBS, stained with secondary antibody (Alexa Fluor 488-AffiniPure F(ab’)2 Fragment goat anti-mouse IgG; Life Technologies; 1:1000) for 1 hour in the dark at room temperature, washed again in PBS, stained with 1 μg/ml DAPI, and mounted with Fluoromount-G (SouthernBiotech) for confocal imaging.
Lentiviral shRNA library transduction
Lentiviral shRNA constructs against ion channels and transporters from throughout the human genome were assembled from multiple sources. The GIPZ Human Ion Channel shRNA library (1,881 shRNAs; Dharmacon, RHS6045) was supplemented with two custom libraries comprised of shRNAs targeting channels and transporters that were not included in the Ion Channel shRNA library (301 shRNAs from Dharmacon and 393 shRNAs from the pGIPZ shRNAmir library from Dharmacon).
For MCOLN1 knockdown, Dharmacon shRNA clones V3LHS_338980 and V2LHS_249668 were used. For MCOLN1 overexpression, the human MCOLN1 open reading frame (HsCD00732386, DNAsu) was cloned into a lentiviral expression construct (pLOC-tRFP-IRES-tGFP; Dharmacon) using the In-Fusion HD cloning system (Clontech). The MCOLN1 gain and loss-of-function constructs were verified by Sanger sequencing.
For virus production, 0.9 mg of the appropriate plasmid along with 1 μg of helper plasmids (0.4 μg pMD2.G and 0.6 mg of psPAX2) were transfected into 293T cells using polyjet. The viral supernatants were collected 48 hours after transfection and filtered through a 0.45 mm filter. Freshly dissociated melanoma cells (300,000 to 1,000,000) were infected with viral supernatants supplemented with 10 μg/ml polybrene (Sigma) for 4 to 6 hours and cultured in DMEM plus 10% FBS and 1% penicillin/streptomycin for 48 hours to allow GFP expression. DsRed+/GFP+ cells were sorted and transplanted into NSG mice to assess tumor growth.
In vivo shRNA screens
shRNA drop-out screens were conducted as previously described (Gargiulo et al., 2014). For the primary screen, a library of 2,589 shRNAs was divided into 27 pools of ~100 shRNAs/pool. Two negative control scrambled shRNAs (Dharmacon, RHS4349 and RHS4346) and three positive control shRNAs targeting EIF3A (Dharmacon, V2LHS_23910, V2LHS_23911, and V2LHS_23913) were spiked into each pool to serve as internal controls. For each pool, shRNA lentivirus was produced in 293T cells as described above, and 5–10 million freshly dissociated melanoma cells from each of three patients (M214, M481, and M491) were transduced. After 48 hours in culture, GFP+ cells were sorted. We have previously demonstrated that at least 1 in 4 human melanoma cells form tumors after subcutaneous transplantation into NSG mice (Quintana et al., 2008). Based on this, 100,000 GFP+ melanoma cells were subcutaneously injected into each of 4 NSG mice per shRNA pool per melanoma so that an average of 1,000 melanoma cells would express each shRNA in each pool injected into a single mouse in the primary screen, and that at least 250 melanoma cells expressing each shRNA would have an opportunity to contribute to each tumor. Once the tumors reached 1.0 – 1.5 cm in diameter, they were surgically excised, and genomic DNA was isolated (Zymo) from equal numbers of input cells and tumor cells. Two aliquots of 100,000 cells per pool per melanoma were analyzed to quantify shRNA abundance among input cells. shRNA barcodes were PCR amplified. The resulting PCR products were purified by gel extraction (QIAGEN) and sequenced using a NextSeq 500 (Illumina) to compare the abundance of each shRNA in the input cells as compared to the tumors.
Sequencing results were analyzed as previously described (Gargiulo et al., 2014). Raw sequences were trimmed using cutadapt (Martin, 2011) and mapped using Bowtie 2 (Langmead and Salzberg, 2012). Raw reads for each shRNA were normalized to the total number of reads in the corresponding sample. t tests were performed on the log2-transformed counts with multiple comparisons adjustments to compare the normalized abundance of each shRNA in the input cells as compared to tumors.
For the secondary screen, 210 shRNAs targeting the 40 candidate genes identified in the primary screen were assembled into a new library, which was then divided into 18 pools of ~17 shRNAs each (including 2 negative and 3 positive control shRNAs, as described above, in each pool). Virus production, transduction, and sorting of melanoma cells were performed as described above. 10,000 GFP+ cells were subcutaneously injected into each of 3 NSG mice per pool per melanoma so that an average of nearly 600 melanoma cells would express each shRNA upon injection into each mouse, and that approximately 150 melanoma cells expressing each shRNA would have an opportunity to contribute to the formation of each tumor. Three aliquots of 100,000 cells per pool per melanoma were analyzed as input cells. Genomic DNA isolation, barcode amplification, and sequencing were performed as described above.
Western blot analysis
For culture experiments, melanoma cells were grown adherently, washed with PBS, and directly lysed in the culture dishes using RIPA Buffer (Cell Signaling Technology) or Triton lysis buffer (50 mM Tris HCl, pH 7.4, 150 mM NaCl, 1 mM EDTA, 1% Triton X-100) supplemented with phenylmethylsulphonyl fluoride (Sigma) and protease and phosphatase inhibitor cocktail (Roche). For in vivo experiments, tumors were surgically excised and snap frozen in liquid nitrogen. Tumor samples were lysed in lysis buffer in 1.7 mL Eppendorf tubes with disposable pestles (Kontes). The bicinchoninic acid (BCA) protein assay (Thermo) was used to quantify protein concentrations. Equal amounts of protein (5–20 μg) were loaded into each lane and separated on 4%–20% polyacrylamide tris glycine SDS gels (BioRad), then transferred to polyvinylidene difluoride (PVDF; BioRad) membranes. Membranes were blocked for 1 hour at room temperature with 5% bovine serum albumin (BSA) in TBS supplemented with 0.1% Tween20 (TBST) and then incubated with primary antibodies overnight at 4°C. Membranes were then washed and incubated with horseradish peroxidase conjugated secondary antibody (Cell Signaling Technology) for 1h at room temperature, then washed again. Signals were developed using Clarity Western ECL Substrate (BioRad) or SuperSignal West (Thermo Fisher). Blots were sometimes stripped using Restore stripping buffer (Thermo Fisher) and re-stained with other primary antibodies.
Colocalization studies
For analysis of colocalization between receptor tyrosine kinases (MET and ERBB3) and late endosomal or lysosomal markers (Rab7 and LAMP1, respectively), 10,000 to 30,000 melanoma cells were plated in 8-well Lab-Tek II Chamber Slides (Thermo). Cells were washed with cold PBS and fixed in 4% paraformaldehyde (Fisher) for 15 min at room temperature, permeabilized with PBS supplemented with 0.05% Triton X-100 for 5 min, washed with PBS, and blocked in 5% donkey serum (JacksonImmuno) in PBS for 1 hour at room temperature. Cells or tissue sections were then co-stained with either rabbit anti-MET (8198, Cell Signaling, 1:200) or rabbit anti-ERBB3 (12708, Cell Signaling, 1:200) combined with mouse anti-Rab7 (95746, Cell Signaling, 1:100) or mouse anti-LAMP1 (sc-20011, Santa Cruz, 1:100) primary antibodies overnight at 4°C. The next day, cells were washed in PBS, stained with secondary antibodies (Alexa Fluor 488 donkey anti-rabbit IgG and Alexa Fluor 647 donkey anti-mouse IgG; Life Technologies; 1:1000) for 1 hour at room temperature, washed again in PBS, stained with 1 μg/ml DAPI, and mounted with Fluoromount-G (SouthernBiotech) for confocal imaging.
Randomly selected melanoma cells were imaged using Z stacks with a 40× objective and 2048 × 2048 pixel resolution on a Zeiss LSM780 Inverted confocal microscope. Deconvolution of the Z stack images was performed using the Bitplane Imaris v7.7.2 and AutoQuant X3 softwares. Background was subtracted from each image using Imaris v7.7.2. Colocalization was assessed in individual cells using the Imaris surface function and a 3D colocalization analysis was performed using the Imaris Coloc tool. Manders colocalization coefficients were used to quantify the degree of colocalization of two fluorophores per cell (Dunn et al., 2011; Manders et al., 1993).
Measurement of the rate of protein synthesis
For analysis of the rate of protein synthesis in culture, 100,000 – 500,000 melanoma cells were plated in 12-well tissue-culture-treated plates containing DMEM plus 10% FBS and 1% penicillin/streptomycin. When specified, cells were cultured for 24 hours in 5 nM Torin1 or 0.5 ng/ml puromycin prior to addition of OP-Puromycin to assess the rate of protein synthesis. 50 μM OP-Puromycin (Medchem Source) was added to the culture medium for 30 minutes. Cells were washed twice in cold PBS, trypsinized, and centrifuged at 300×g for 5 minutes to pellet. The cells were resuspended in 250 μl of 1% paraformaldehyde (Affymetrix) in PBS for 15 min on ice. Cell were then washed in PBS, and permeabilized in 100 μl of PBS supplemented with 3% FBS and 0.1% saponin (Sigma) for 5 min at room temperature. The azide-alkyne cycloaddition to quantify OP-Puro incorporation into nascent peptides was performed using the Click-iT Cell Reaction Buffer Kit (Thermo Fisher) with azide conjugated to Alexa Fluor 555 (Life Technologies) at 5 mM final concentration. After the 30 min azide-alkyne cycloaddition reaction, the cells were washed twice in PBS supplemented with 3% FBS and 0.1% saponin, then resuspended in PBS with 1 μg/ml DAPI and analyzed by flow cytometry.
Measurement of protein aggregation
Protein aggregation was measured with the Proteostat Aggresome Detection Kit (Enzo). Melanoma cells were plated in 8-well Lab-Tek II Chamber Slides (Thermo) in DMEM plus 10% FBS and 1% penicillin/streptomycin. When specified, cells were cultured for 24 hours in 5 nM Torin1 or 5 μM PD169316 proteosome activator before being fixed. Cells were washed with PBS, fixed in 4% formaldehyde (Fisher) for 30 min at room temperature, washed twice with PBS, permeabilized in 1X Assay Buffer (Enzo) supplemented with 0.5% Triton X-100 and 3mM EDTA, pH 8.0, for 30 min at 4°C, and washed twice with PBS. Cells were then stained with the Proteostat Dual Detection Reagent (Enzo) for 30 min in the dark at room temperature. Cells were carefully washed twice in PBS, stained with 1 μg/ml DAPI, and mounted with Flouromount-G for confocal imaging. Protein aggregation was quantified by calculating the integrated signal density per cell in randomly chosen fields of view throughout each sample using ImageJ.
Measurement of macropinocytosis in culture by imaging of live cells
As previously described (Palm et al., 2015), melanoma cells or human melanocytes were plated in 8-well chamber slides (Ibidi) containing DMEM plus 10% FBS and 1% penicillin/streptomycin. When specified, cells were pre-treated with 5 nM Torin1 or trametinib (Selleckchem) for 24 hours before addition of DQ-BSA (0.3 mg/ml DQ Green BSA; Thermo) to the culture medium to quantify macropinocytosis. Cells were imaged after 5–6 hours of incubation with DQ-BSA using a Zeiss LSM780 Inverted confocal microscope. One hour before imaging, 0.2 μg/ml Hoechst 33342 (Thermo) was added to visualize nuclei. Cellular degradation of fluorescently labeled albumin was determined by calculating the integrated signal density per cell in randomly chosen fields of view throughout each sample using ImageJ.
LC-MS/MS metabolomic analysis
Cultured melanoma cells or subcutaneous tumor fragments were homogenized using pestles in 1.7 mL Eppendorf tubes in ice-cold 80:20 methanol:water (vol:vol) and vortexed vigorously. The supernatant was collected into fresh Eppendorf tubes after a 15 min centrifugation at 17,000×g at 4°C and placed directly into autosampler vials for analysis by LC/MS without drying in a speed-vac. Metabolite measurements were carried out on a Thermo Scientific (Bremen, Germany) QExactive HF-X hybrid quadrupole orbitrap high resolution mass spectrometer (HRMS) coupled to a Vanquish UHPLC. Chromatographic separation of metabolites was achieved using a Millipore (Burlington, MA) ZIC-pHILIC column (5 μm, 2.1 × 150 mm) with a binary solvent system of 10 mM ammonium acetate in water, pH 9.8 (Solvent A) and acetonitrile (Solvent B) with a constant flow rate of 0.25 ml/minute. For gradient separation, the column was equilibrated with 90% Solvent B. After injection, the gradient proceeded as follows: 0–15 minutes linear ramp from 90% B to 30% B; 15–18 minutes isocratic flow of 30% B; 18–19 minutes linear ramp from 30% B to 90% B; 19–27 minutes of column regeneration with isocratic flow of 90% B. HRMS data were acquired with two different methods. Individual samples were acquired with an HRMS full scan (precursor ion only) switching between positive and negative polarities. Polarity-switching HRMS full scan data were acquired with a resolving power of 60,000 FWHM and a mass range of 50–750 Daltons; the AGC target was set to 106 and a maximum injection time of 100 ms. Pooled samples, which were used for structural verification of the identity of metabolite peaks, were generated from an equal mixture of all individual samples and were analyzed using individual positive- and negative polarity data-dependent high-resolution tandem mass spectrometry (ddHRMS/MS) for high confidence metabolite identification. For ddHRMS/MS methods, precursor ion scans were acquired at a resolving power of 60,000 FWHM, with a mass range of 50–750 Daltons. The Automated Gate Control (AGC) target value was set to 106, with a maximum injection time of 100 ms. Product ion spectra were acquired at a resolving power of 15,000 FWHM without a fixed mass range. The AGC target value was set to 2 × 10⁵ with a maximum injection time of 150 ms. Data dependent parameters were set to acquire the top 10 ions with a dynamic exclusion of 15 s and a mass tolerance of 5 ppm. Isotope exclusion was turned on and the normalized collision energy was set to a constant value of 30. Settings remained the same in both polarities.
QUANTIFICATION AND STATISTICAL ANALYSIS
Statistical Methods
Generally, multiple melanomas derived from different patients or cell lines were tested in multiple independent experiments performed on different days. Mice were allocated to experiments randomly and samples processed in an arbitrary order, but formal randomization techniques were not used. Prior to analyzing the statistical significance of differences among treatments, we tested whether data were normally distributed and whether variances were similar among treatments. To test for normality, we performed the Shapiro–Wilk tests when 3 ≤ n < 20 samples or the D’Agostino tests when n ≥ 20 samples. To test whether variability significantly differed among treatments, we performed F-tests (for experiments with two treatments) or Levene’s median tests (for experiments with more than two treatments). When the data were not significantly deviated from normality (p ≥ 0.01) and variability not significantly differed among treatments (p ≥ 0.05), we performed parametric tests such as Student’s t tests (for experiments with two treatments) or one-way ANOVAs (for experiments with more than two treatments) on the original data. When the data were not significantly deviated from normality, but variability significantly differed among treatments, we performed parametric tests with the Welch’s method for variance adjustment. When the data were significantly deviated from normality, we log2-transformed the data and tested again for normality and variability. If the transformed data no longer significantly deviated from normality, we then performed parametric tests with or without the Welch’s method for variance adjustment on the transformed data. If the log2-transformation was not possible or the transformed data still significantly deviated from normality, we performed non-parametric tests on the non-transformed data. Ratio data were always log2-transformed before any statistical tests were performed. Statistical tests were always two-tailed when this option was applicable. For experiments with two factors and data significantly deviated from normality, we reduced the factors to one when no appropriate non-parametric, two-way statistical tests were available.
To assess the enrichment of shRNAs in the input cells as compared to tumors in the shRNA screen, we performed multiple unpaired, two-tailed t tests on the log2-transformed, total-count normalized data (Gargiulo et al., 2014). To assess differences in tumor growth or cell growth in culture, we performed one-way or two-way ANOVAs on the last time point measured. To assess the difference between survival curves, we performed the Mantel-Cox’s log-rank test. To assess the reproducibility of shRNA screen experiments, we performed the Spearman’s correlation test. To assess the difference between two groups comprised of multiple different melanoma or melanocyte lines, we performed the two-tailed, nested t test. When applicable, multiple-comparisons adjustments were always performed after statistical tests.
All statistical analyses were performed with Graphpad Prism 8 or R 3.5.1 with the stats, fBasics and car packages. All data represent mean ± standard deviation. No data were excluded. Mice sometimes died during experiments, presumably due to the growth of metastatic tumors. In those instances, data that had already been collected from those mice in interim analyses were included (such as subcutaneous tumor growth measurements over time).
DATA AND CODE AVAILABILITY
Original data for the shRNA screens are available on Mendeley Data (https://doi.org/10.17632/ndxtvbg4ty.1).
Supplementary Material
KEY RESOURCES TABLE
| REAGENT or RESOURCE | SOURCE | IDENTIFIER |
|---|---|---|
| Antibodies | ||
| Anti-Mouse CD31 (PECAM-1) eFluor 450 | eBiosciences | Cat# 48-0311-82, RRID:AB_10598807 |
| Anti-Mouse TER-119 violetFluor450 | Tonbo | Cat# 75-5921, RRID:AB_2621967 |
| Anti-Mouse CD45, violetFluor450 | Tonbo | Cat# 75-0451, RRID:AB_2621947 |
| Anti-human HLA-ABC, APC | BD Pharmigen | Cat# 555555, RRID:AB_398603 |
| Goat anti-mouse IgG, Alexa Fluor 488-conjugated | ThermoFisher Scientific | Cat# A-11029, RRID:AB_138404 |
| Donkey anti-rabbit IgG, Alexa Fluor 488-conjugated | Jackson ImmunoResearch | Cat# 711-546-152, RRID:AB_2340619 |
| Donkey anti-mouse IgG, Alexa Fluor 647-conjugated | Jackson ImmunoResearch | Cat# 715-605-150, RRID:AB_2340862 |
| Anti-Ki-67 | Agilent | Cat# M7240, RRID:AB_2142367 |
| Anti-Rab7 | Cell Signaling | Cat# 95746, RRID:AB_2800252 |
| Anti-LAMP-1 | Santa Cruz | Cat# sc-20011, RRID:AB_626853 |
| Anti-rabbit IgG, HRP-linked | Cell Signaling | Cat# 7074, RRID:AB_2099233 |
| Anti-mouse IgG, HRP-linked | Cell Signaling | Cat# 7076, RRID:AB_330924 |
| Anti-MCOLN1 | Sigma | Cat# AV35307, RRID:AB_1853643 |
| Anti-phospho-ERK1/2 | Cell Signaling | Cat# 4370, RRID:AB_2315112 |
| Anti-ERK1/2 | Cell Signaling | Cat# 4695, RRID:AB_390779 |
| Anti-phospho-Akt | Cell Signaling | Cat# 4060, RRID:AB_2315049 |
| Anti-Akt | Cell Signaling | Cat# 4691, RRID:AB_915783 |
| Anti-phospho-p70 S6 kinase | Cell Signaling | Cat# 9234, RRID:AB_2269803 |
| Anti-p70 S6 kinase | Cell Signaling | Cat# 2708, RRID:AB_390722 |
| Anti-phospho-MET | Cell Signaling | Cat# 3077, RRID:AB_2143884 |
| Anti-MET | Cell Signaling | Cat# 8198, RRID:AB_10858224 |
| Anti-phospho-ERBB3 | Cell Signaling | Cat# 2842, RRID:AB_11178795 |
| Anti-ERBB3 | Cell Signaling | Cat# 12708, RRID:AB_2721919 |
| Anti-BiP | Cell Signaling | Cat# 3177, RRID:AB_2119845 |
| Anti-phospho-eIF2α | Cell Signaling | Cat# 3398, RRID:AB_2096481 |
| Anti-eIF2α | Cell Signaling | Cat# 5324, RRID:AB_10692650 |
| Anti-ATF4 | Cell Signaling | Cat# 11815, RRID:AB_2616025 |
| Anti-CHOP | Cell Signaling | Cat# 5554, RRID:AB_10694399 |
| Anti-phospho-IRE1α | Invitrogen | Cat# PA1-16927, RRID:AB_2262241 |
| Anti-IRE1α | Cell Signaling | Cat# 3294, RRID:AB_823545 |
| Anti-β-actin | Cell Signaling | Cat# 8457, RRID:AB_10950489 |
| Bacterial and Virus Strains | ||
| DH5α Competent E. coli | Generated in-lab | N/A |
| Stbl3 Competent E. coli | Generated in-lab | N/A |
| Biological Samples | ||
| Patient-derived melanoma xenografts (PDX) | Eskiocak et al., 2016; Piskounova et al., 2015; Quintana et al., 2008 | N/A |
| Adult human melanocytes | ATCC | Cat# PCS-200-013 |
| Adult human melanooytes | Invitrogen | Cat# C-024-5C |
| Adult human melanocytes | Lonza | Cat# CC-2586 |
| Chemicals, Peptides, and Recombinant Proteins | ||
| Trametinib (GSK1120212) | Selleckchem | Cat# S2673, CAS:871700-17-3 |
| Torin1 | Tocris | Cat# 4247, CAS:1222998-36-8 |
| Rapamycin (Sirolimus) | LC Laboratories | Cat# R-5000, CAS:53123-88-9 |
| Bafilomycin A1 | Sigma Aldrich | Cat# B1793, CAS:88899-55-2 |
| O-propargyl-puromycin (OP Puromycin) | Medchem Source | Cat# JA-1024, CAS: 1416561-90-4 |
| Puromycin dihydroohloride | Sigma Aldrich | Cat# P8833, CAS:58-58-2 |
| PD169316 | Sigma Aldrich | Cat# P9248, CAS:152121-53-4 |
| DQ-BSA Green | Fisher Scientific | Cat# D12050 |
| L-serine | Sigma Aldrich | Cat# S4500, CAS:56-45-1 |
| DMEM, high glucose | Fisher Scientific | Cat# 11965118 |
| Foundation B fetal bovine serum (FBS) | Gemini | Cat# 900-208 |
| Penicillin/Streptomycin solution | Fisher | Cat# 15140-122 |
| Collagenase Type IV | Worthington | Cat# LS004189 |
| DNase I from bovine pancreas | Sigma Aldrich | Cat# D4527, CAS:9003-98-9 |
| Calcium chloride | Sigma Aldrich | Cat# C5670, CAS: 10043-52-4 |
| Superscript III Reverse Transcriptase | Thermo Fisher | Cat# 18080044 |
| Polyjet | SignaGen | Cat# SL100688 |
| Prime-XV Tumorsphere SFM | Irvine Scientific | Cat# 91130 |
| Heparin sodium salt | Sigma Aldrich | Cat# H3149, CAS:9041-08-1 |
| Hydrocortisone | Sigma Aldrich | Cat# H0135, CAS:50-23-7 |
| B-27 | Thermo Fisher | Cat# 17504044 |
| StemRegenin 1 | StemCell Technologies, Inc. | Cat# 72344, CAS:1227633-49-9 |
| Charcoal stripped FBS | Thermo Fisher | Cat# 12676011 |
| Bovine Pituitary Extract (BPE) | Lonza | Cat# CC-4009 |
| Recombinant human IL-8 (CXCL8) | Peprotech | Cat# 200-08M |
| Recombinant human GRO-α/MGSA (CXCL1) | Peprotech | Cat# 300-11 |
| Recombinant human HGF | Peprotech | Cat# 100-39H |
| QuickExtract | Epicenter | Cat# QE09050 |
| Leibovitz L-15 | Life Technologies | Cat# 21083-027 |
| 1M HEPES | Life Technologies | Cat# 15630-080 |
| Bovine Serum Albumin | Sigma Aldrich | Cat# A7906, CAS:9048-46-8 |
| Corning Matrigel Matrix - High | Fisher Scientific | Cat# 354248 |
| (Hydroxypropyl)methyl cellulose | Sigma Aldrich | Cat# H7509, CAS:9004-65-3 |
| Tween 80 | Sigma Aldrich | Cat# P1754, CAS:9005-65-6 |
| Dimethyl sulfoxide (DMSO) | Sigma Aldrich | Cat# D4540, CAS:67-68-5 |
| HBSS w/o phenol red, Ca and Mg | Fisher Scientific | Cat# MT21022CV |
| Phosphate Buffered Saline (PBS), 1X | VWR | Cat# 45000-446 |
| 4’,6-diamidino-2-phenylindole (DAPI) | Sigma Aldrich | Cat# D8417, CAS:28718-90-3 |
| 0.25% Trypsin | Fisher Scientific | Cat# SH3004201 |
| 4% Parafomaldehyde in PBS | Fisher Scientific | Cat# AAJ19943K2, CAS:30525-89-4 |
| Sucrose | Sigma Aldrich | Cat# S0389, CAS:57-50-1 |
| FB OCT Compound CLR | Fisher Scientific | Cat# 23-730-571 |
| Triton X-100 | Sigma Aldrich | Cat# T8787, CAS:9002-93-1 |
| Normal Goat serum | Jackson ImmunoResearch | Cat# 005-000-121 |
| Normal Donkey serum | Jackson ImmunoResearch | Cat# 017-000-121 |
| Fluoromount-G | Fisher Scientific | Cat# OB100-01 |
| In-Fusion HD Cloning Plus | Clontech | Cat# 638909 |
| Hexadimethrine bromide (polybrene) | Sigma Aldrich | Cat# 107689, CAS:28728-55-4 |
| ZR-96 Quick-gDNA | Zymo Research | Cat# D3011 |
| QIAquick Gel Extraction Kit | QIAGEN | Cat# 28704 |
| QIAprep Spin Miniprep Kit | QIAGEN | Cat# 27106 |
| RIPA Buffer (10X) | Cell Signaling | Cat# 9806S |
| Tris Base | Fisher Scientific | Cat# BP152, CAS:77-86-1 |
| Hydrochloric Acid | Fisher Scientific | Cat# A144SI-212, CAS:7646-01-0 |
| Sodium Chloride | Research Products International | Cat# S23020, CAS:7647-14-5 |
| EDTA, pH 8.0 | Thermo Fisher | Cat# AM9260G, CAS:6381-92-6 |
| 10X Tris/Glycine/SDS Buffer | BioRad | Cat# 161-0732 |
| Tween 20 | Sigma | Cat# P1379, CAS:9005-64-5 |
| Clarity Western ECL Substrate | BioRad | Cat# 170-5061 |
| SuperSignal West Femto Maximum | Thermo Scientific | Cat# 34095 |
| Restore Western Blot Stripping Buffer | Thermo Fisher | Cat# 21059 |
| Saponin | Sigma Aldrich | Cat# 47036, CAS:8047-15-2 |
| Alexa Fluor 555 Azide | Thermo Fisher | Cat# A20012 |
| Hoechst 33342 | Thermo Fisher | Cat# 62249, CAS:23491-52-3 |
| Methanol, Optima LC/MS Grade | Fisher Scientific | Cat# A456, CAS:67-56-1 |
| Ammonium Acetate, Optima LC/MS Grade | Fisher Scientific | Cat# A11450, CAS:631 −61 −8 |
| Acetonitrile, Optima LC/MS Grade | Fisher Scientific | Cat# A955, CAS:75-05-8 |
| Critical Commercial Assays | ||
| CellEvent Caspase-3/7 Green | Thermo Fisher | Cat# C10423 |
| Click-iT Cell Reaction Buffer Kit | Thermo Fisher | Cat# C10276 |
| Proteostat Aggresome Detection Kit | Enzo | Cat# ENZ-51023 |
| Pierce BCA Protein Assay Kit | Thermo Fisher | Cat# 23227 |
| MycoAlert Detection Kit | Lonza | Cat# LT07-218 |
| Deposited Data | ||
| Analyzed shRNA screen data | This paper | https://doi.org/10.17632/ndxtvbg4ty.1 |
| Experimental Models: Cell Lines | ||
| A375 melanoma cell line | ATCC | Cat# CRL-1619, RRID:CVCL_0132 |
| HEK293T cell line | ATCC | Cat# CRL-3216, RRID:CVCL_0063 |
| Experimental Models: Organisms/Strains | ||
| NOD.CB17-Prkdcscid Il2rgtm1Wjl/SzJ (NSG) mice | The Jackson Laboratory | Cat# 005557 |
| Oligonucleotides | ||
| MCOLN1_E2_sgRNA_1_F: AAACTCGCCGTCGTC TCAAATACTC | This paper | N/A |
| MCOLN1_E2_sgRNAJ_R:CACCGAGTATTTGAG ACGACGGCGA | This paper | N/A |
| MCOLN1_E2_sgRNA_2_F: AAACTGCGACAAGTTT CGAGCCAAC | This paper | N/A |
| MCOLN1_E2_sgRNA_2_R: CACCGTTGGCTCGAA ACTTGTCGCA | This paper | N/A |
| MCOLN1_qPCR_F:CTGATGCTGCAAGTGGTCAAG | This paper | N/A |
| MCOLN1_qPCR_R:GGTGTTCTCTTCCCGGAATGTC | This paper | N/A |
| MCOLN1 _pLOC_F: ggtaccgagctcggatccATGACAGC CCCGGCGGG | This paper | N/A |
| MCOLN1 _pLOC_R: cccggttcattagctagcTCAATTCA CCAGCAGCG | This paper | N/A |
| Recombinant DNA | ||
| pLOC-MCOLN1 | Generated in-lab | N/A |
| pLOC-RFP | Dharmacon | Cat# OHS5832 |
| pSpCas9(BB)-2A-GFP (PX458) | Addgene | Cat# 48318, RRID:Addgene_48138 |
| pANT7_cGST_MCOLN1 | DNASU | Clone# HsCD00732386 |
| psPAX2 | Addgene | Cat# 12260, RRID:Addgene_12260 |
| pMD2.G | Addgene | Cat# 12259, RRID:Addgene_12259 |
| Software and Algorithms | ||
| BD FACSDiva 8.0 | BD Biosciences | http://www.bdbiosciences.com/in/instruments/software/facsdiva/ |
| FlowJo V10 | BD Biosciences | https://www.flowjo.com/ |
| Zeiss ZEN 2.3 | Zeiss | https://www.zeiss.com/microscopy/us/products/microscope-software/zen.html |
| AutoQuant X3 | Media Cybernetics | http://www.mediacy.com/autoquantx3 |
| lmaris V7.7.2 | Bitplane | http://www.bitplane.com/imaris77.aspx |
| Analyst v1.6.3 | SCIEX | https://sciex.com/products/software/analyst-software |
| XCalibur 4.1.50 | Thermo Scientific | https://www.thermofisher.com/order/catalog/product/OPTON-30487 |
| Multiquant v2.1.1 | SCIEX | https://sciex.com/products/software/multiquant-software |
| Compound Discoverer 3.0 | Thermo Scientific | https://www.thermofisher.com/us/en/home/industrial/mass-spectrometry/liquid-chromatography-mass-spectrometry-Ic-ms/lc-ms-software/multi-omics-data-analysis/compound-discoverer-software.html |
| Trace Finder 4.1 | Thermo Scientific | https://www.thermofisher.com/order/catalog/product/OPTON-30626 |
| Prism 8 | Graphpad | https://www.graphpad.com/scientific-software/prism/ |
| R 3.5.1 | R-Project | https://www.r-project.org/ |
| Stats package | RDocumentation | https://www.rdocumentation.org/packages/stats/versions/3.5.3 |
| fBasics package | R-Project | https://cran.r-project.org/web/packages/fBasics/index.html |
| Car package | R-Project | https://cran.r-project.org/web/packages/car/index.html |
| Cutadapt | Martin, 2011 | https://cutadapt.readthedocs.io/en/stable/ |
| Bowtie 2 | Langmead and Salzberg, 2012 | http://bowtie-bio.sourceforge.net/bowtie2/index.shtml |
| Other | ||
| shRNA-Non-targeting | Dharmacon | Cat# RHS4349 |
| shRNA-Non-targeting | Dharmacon | Cat# RHS4346 |
| Ion Channel GIPZ shRNA library | Dharmacon | Cat# RHS6045 |
| Custom GIPZ shRNA library | Dharmacon | Ref# SO-2439595G |
| shRNA-EIF3A | Dharmacon | Cat# RHS4430-200163810 |
| shRNA-EIF3A | Dharmacon | Cat# RHS4430-200198846 |
| shRNA-EIF3A | Dharmacon | Cat# RHS4430-99293356 |
| 4–20% polyacrylamide tris glycine SDS gel | BioRad | Cat# 4561095 |
| Trans-Blot Turbo Mini Transfer kit, PVDF | BioRad | Cat# 1704272 |
Highlights.
TRPML1 is preferentially required for the survival and proliferation of melanoma cells
TRPML1 negatively regulates MAPK and mTORC1 signaling in melanoma cells
Macropinocytosis is upregulated in melanoma cells as compared to normal melanocytes
TRPML1 promotes protein homeostasis and sustains macropinocytosis in melanoma cells
ACKNOWLEDGMENTS
S.J.M. is a Howard Hughes Medical Institute investigator, the Mary McDermott Cook Chair in Pediatric Genetics, the Kathryn and Gene Bishop Distinguished Chair in Pediatric Research, the director of the Hamon Laboratory for Stem Cells and Cancer, and a Cancer Prevention and Research Institute of Texas scholar. The research was supported by the Howard Hughes Medical Institute, the Cancer Prevention and Research Institute of Texas (RP170114, RP170633, and RP180778), and the Once Upon a Time Foundation. S.Y.K. and D.B. were each supported by Ruth L. Kirschstein National Research Service Award Predoctoral Fellowships from the National Cancer Institute (F30 CA216885 and F31 CA239330). A.T. was supported by the Leopoldina Fellowship Program (LPDS2016–16) of the German National Academy of Sciences. We thank Jian Xu for sequencing, as well as N. Loof of the Moody Foundation Flow Cytometry Facility and K. Luby-Phelps and A. Bugde of the Live Cell Imaging Facility at UT Southwestern. We also thank the UT Southwestern BioHPC (high-performance computing) cluster. The graphic in Figure 1A and the graphical abstract were created using BioRender.
Footnotes
SUPPLEMENTAL INFORMATION
Supplemental Information can be found online at https://doi.org/10.1016/j.celrep.2019.07.086.
DECLARATION OF INTERESTS
The authors declare no competing interests.
REFERENCES
- Bar-Sagi D, and Feramisco JR (1986). Induction of membrane ruffling and fluid-phase pinocytosis in quiescent fibroblasts by ras proteins. Science 233, 1061–1068. [DOI] [PubMed] [Google Scholar]
- Bartkova J, Rezaei N, Liontos M, Karakaidos P, Kletsas D, Issaeva N, Vassiliou LV, Kolettas E, Niforou K, Zoumpourlis VC, et al. (2006). Oncogene-induced senescence is part of the tumorigenesis barrier imposed by DNA damage checkpoints. Nature 444, 633–637. [DOI] [PubMed] [Google Scholar]
- Bartolomeo R, Cinque L, De Leonibus C, Forrester A, Salzano AC, Monfregola J, De Gennaro E, Nusco E, Azario I, Lanzara C, et al. (2017). mTORC1 hyperactivation arrests bone growth in lysosomal storage disorders by suppressing autophagy. J. Clin. Invest 127, 3717–3729. [DOI] [PMC free article] [PubMed] [Google Scholar]
- Beuschlein F, Boulkroun S, Osswald A, Wieland T, Nielsen HN, Lichtenauer UD, Penton D, Schack VR, Amar L, Fischer E, et al. (2013). Somatic mutations in ATP1A1 and ATP2B3 lead to aldosterone-producing adenomas and secondary hypertension. Nat. Genet 45, 440–444, e1–e2. [DOI] [PubMed] [Google Scholar]
- Blomen VA, Májek P, Jae LT, Bigenzahn JW, Nieuwenhuis J, Staring J, Sacco R, van Diemen FR, Olk N, Stukalov A, et al. (2015). Gene essentiality and synthetic lethality in haploid human cells. Science 350, 1092–1096. [DOI] [PubMed] [Google Scholar]
- Braig M, Lee S, Loddenkemper C, Rudolph C, Peters AH, Schlegelberger B, Stein H, Dörken B, Jenuwein T, and Schmitt CA (2005). Oncogene-induced senescence as an initial barrier in lymphoma development. Nature 436, 660–665. [DOI] [PubMed] [Google Scholar]
- Calcraft PJ, Ruas M, Pan Z, Cheng X, Arredouani A, Hao X, Tang J, Rietdorf K, Teboul L, Chuang KT, et al. (2009). NAADP mobilizes calcium from acidic organelles through two-pore channels. Nature 459, 596–600. [DOI] [PMC free article] [PubMed] [Google Scholar]
- Cang C, Zhou Y, Navarro B, Seo YJ, Aranda K, Shi L, Battaglia-Hsu S, Nissim I, Clapham DE, and Ren D (2013). mTOR regulates lysosomal ATP-sensitive two-pore Na(+) channels to adapt to metabolic state. Cell 152, 778–790. [DOI] [PMC free article] [PubMed] [Google Scholar]
- Chen CS, Bach G, and Pagano RE (1998). Abnormal transport along the lysosomal pathway in mucolipidosis, type IV disease. Proc. Natl. Acad. Sci. USA 95, 6373–6378. [DOI] [PMC free article] [PubMed] [Google Scholar]
- Chen Z, Trotman LC, Shaffer D, Lin HK, Dotan ZA, Niki M, Koutcher JA, Scher HI, Ludwig T, Gerald W, et al. (2005). Crucial role of p53-dependent cellular senescence in suppression of Pten-deficient tumorigenesis. Nature 436, 725–730. [DOI] [PMC free article] [PubMed] [Google Scholar]
- Chin L (2003). The genetics of malignant melanoma: lessons from mouse and man. Nat. Rev. Cancer 3, 559–570. [DOI] [PubMed] [Google Scholar]
- Choi M, Scholl UI, Yue P, Björklund P, Zhao B, Nelson-Williams C, Ji W, Cho Y, Patel A, Men CJ, et al. (2011). K+ channel mutations in adrenal aldosterone-producing adenomas and hereditary hypertension. Science 331, 768–772. [DOI] [PMC free article] [PubMed] [Google Scholar]
- Citri A, and Yarden Y (2006). EGF-ERBB signalling: towards the systems level. Nat. Rev. Mol. Cell Biol 7, 505–516. [DOI] [PubMed] [Google Scholar]
- Clapham DE (2003). TRP channels as cellular sensors. Nature 426, 517–524. [DOI] [PubMed] [Google Scholar]
- Commisso C, Davidson SM, Soydaner-Azeloglu RG, Parker SJ, Kamphorst JJ, Hackett S, Grabocka E, Nofal M, Drebin JA, Thompson CB, et al. (2013). Macropinocytosis of protein is an amino acid supply route in Ras-transformed cells. Nature 497, 633–637. [DOI] [PMC free article] [PubMed] [Google Scholar]
- Dayam RM, Saric A, Shilliday RE, and Botelho RJ (2015). The Phosphoinositide-Gated Lysosomal Ca(2+) Channel, TRPML1, Is Required for Phagosome Maturation. Traffic 16, 1010–1026. [DOI] [PubMed] [Google Scholar]
- DeNicola GM, Chen PH, Mullarky E, Sudderth JA, Hu Z, Wu D, Tang H, Xie Y, Asara JM, Huffman KE, et al. (2015). NRF2 regulates serine biosynthesis in non-small cell lung cancer. Nat. Genet 47, 1475–1481. [DOI] [PMC free article] [PubMed] [Google Scholar]
- Di Fiore PP, and De Camilli P (2001). Endocytosis and signaling. an inseparable partnership. Cell 106, 1–4. [DOI] [PubMed] [Google Scholar]
- Dong XP, Shen D, Wang X, Dawson T, Li X, Zhang Q, Cheng X, Zhang Y, Weisman LS, Delling M, and Xu H (2010). PI(3,5)P(2) controls membrane trafficking by direct activation of mucolipin Ca(2+) release channels in the endolysosome. Nat. Commun 1, 38. [DOI] [PMC free article] [PubMed] [Google Scholar]
- Dong Z, and Zhang JT (2006). Initiation factor eIF3 and regulation of mRNA translation, cell growth, and cancer. Crit. Rev. Oncol. Hematol 59, 169–180. [DOI] [PubMed] [Google Scholar]
- Dunn KW, Kamocka MM, and McDonald JH (2011). A practical guide to evaluating colocalization in biological microscopy. Am. J. Physiol. Cell Physiol 300, C723–C742. [DOI] [PMC free article] [PubMed] [Google Scholar]
- Eskiocak U, Ramesh V, Gill JG, Zhao Z, Yuan SW, Wang M, Vandergriff T, Shackleton M, Quintana E, Johnson TM, et al. (2016). Synergistic effects of ion transporter and MAP kinase pathway inhibitors in melanoma. Nat. Commun 7, 12336. [DOI] [PMC free article] [PubMed] [Google Scholar]
- Evan GI, Wyllie AH, Gilbert CS, Littlewood TD, Land H, Brooks M, Waters CM, Penn LZ, and Hancock DC (1992). Induction of apoptosis in fibroblasts by c-myc protein. Cell 69, 119–128. [DOI] [PubMed] [Google Scholar]
- Frankel AE, Eskiocak U, Gill JG, Yuan S, Ramesh V, Froehlich TW, Ahn C, and Morrison SJ (2017). Digoxin Plus Trametinib Therapy Achieves Disease Control in BRAF Wild-Type Metastatic Melanoma Patients. Neoplasia 19, 255–260. [DOI] [PMC free article] [PubMed] [Google Scholar]
- Fraser SP, and Pardo LA (2008). Ion channels: functional expression and therapeutic potential in cancer. Colloquium on Ion Channels and Cancer. EMBO Rep. 9, 512–515. [DOI] [PMC free article] [PubMed] [Google Scholar]
- Gargiulo G, Serresi M, Cesaroni M, Hulsman D, and van Lohuizen M (2014). In vivo shRNA screens in solid tumors. Nat. Protoc 9, 2880–2902. [DOI] [PubMed] [Google Scholar]
- Guo JY, Teng X, Laddha SV, Ma S, Van Nostrand SC, Yang Y, Khor S, Chan CS, Rabinowitz JD, and White E (2016). Autophagy provides metabolic substrates to maintain energy charge and nucleotide pools in Ras-driven lung cancer cells. Genes Dev. 30, 1704–1717. [DOI] [PMC free article] [PubMed] [Google Scholar]
- Hodis E, Watson IR, Kryukov GV, Arold ST, Imielinski M, Theurillat JP, Nickerson E, Auclair D, Li L, Place C, et al. (2012). A landscape of driver mutations in melanoma. Cell 150, 251–263. [DOI] [PMC free article] [PubMed] [Google Scholar]
- Inamura N, Kito M, Go S, Kishi S, Hosokawa M, Asai K, Takakura N, Takebayashi H, Matsuda J, and Enokido Y (2018). Developmental defects and aberrant accumulation of endogenous psychosine in oligodendrocytes in a murine model of Krabbe disease. Neurobiol. Dis 120, 51–62. [DOI] [PubMed] [Google Scholar]
- Johannessen CM, Reczek EE, James MF, Brems H, Legius E, and Cichowski K (2005). The NF1 tumor suppressor critically regulates TSC2 and mTOR. Proc. Natl. Acad. Sci. USA 102, 8573–8578. [DOI] [PMC free article] [PubMed] [Google Scholar]
- Jung J, Cho K-J, Naji AK, Clemons KN, Wong CO, Villanueva M, Gregory S, Karagas NE, Tan L, Liang H, et al. (2019). HRAS-driven cancer cells are vulnerable to TRPML1 inhibition. EMBO Rep. 20, e46685. [DOI] [PMC free article] [PubMed] [Google Scholar]
- Kamphorst JJ, Nofal M, Commisso C, Hackett SR, Lu W, Grabocka E, Vander Heiden MG, Miller G, Drebin JA, Bar-Sagi D, et al. (2015). Human pancreatic cancer tumors are nutrient poor and tumor cells actively scavenge extracellular protein. Cancer Res. 75, 544–553. [DOI] [PMC free article] [PubMed] [Google Scholar]
- Kawashima N, Tsuji D, Okuda T, Itoh K, and Nakayama K (2009). Mechanism of abnormal growth in astrocytes derived from a mouse model of GM2 gangliosidosis. J. Neurochem 111, 1031–1041. [DOI] [PubMed] [Google Scholar]
- Langmead B, and Salzberg SL (2012). Fast gapped-read alignment with Bowtie 2. Nat. Methods 9, 357–359. [DOI] [PMC free article] [PubMed] [Google Scholar]
- Leestemaker Y, de Jong A, Witting KF, Penning R, Schuurman K, Rodenko B, Zaal EA, van de Kooij B, Laufer S, Heck AJR, et al. (2017). Proteasome Activation by Small Molecules. Cell Chem. Biol 24, 725–736.e7. [DOI] [PubMed] [Google Scholar]
- Li RJ, Xu J, Fu C, Zhang J, Zheng YG, Jia H, and Liu JO (2016). Regulation of mTORC1 by lysosomal calcium and calmodulin. eLife 5, e19360. [DOI] [PMC free article] [PubMed] [Google Scholar]
- Liu J, Xu Y, Stoleru D, and Salic A (2012). Imaging protein synthesis in cells and tissues with an alkyne analog of puromycin. Proc. Natl. Acad. Sci. USA 109, 413–418. [DOI] [PMC free article] [PubMed] [Google Scholar]
- Locasale JW (2013). Serine, glycine and one-carbon units: cancer metabolism in full circle. Nat. Rev. Cancer 13, 572–583. [DOI] [PMC free article] [PubMed] [Google Scholar]
- Ma L, Chen Z, Erdjument-Bromage H, Tempst P, and Pandolfi PP (2005). Phosphorylation and functional inactivation of TSC2 by Erk implications for tuberous sclerosis and cancer pathogenesis. Cell 121, 179–193. [DOI] [PubMed] [Google Scholar]
- Ma XM, and Blenis J (2009). Molecular mechanisms of mTOR-mediated translational control. Nat. Rev. Mol. Cell Biol 10, 307–318. [DOI] [PubMed] [Google Scholar]
- Manders EMM, Verbeek FJ, and Aten JA (1993). Measurement of colocalization of objects in dual-colour confocal images. J. Microsc 169, 375–382. [DOI] [PubMed] [Google Scholar]
- Martin M (2011). Cutadapt removes adapter sequences from high-throughput sequencing reads. EMBnetjournal 17, 10–12. [Google Scholar]
- McCormack JG, Halestrap AP, and Denton RM (1990). Role of calcium ions in regulation of mammalian intramitochondrial metabolism. Physiol. Rev 70, 391–425. [DOI] [PubMed] [Google Scholar]
- Medina DL, Di Paola S, Peluso I, Armani A, De Stefani D, Venditti R, Montefusco S, Scotto-Rosato A, Prezioso C, Forrester A, et al. (2015). Lysosomal calcium signalling regulates autophagy through calcineurin and TFEB. Nat. Cell Biol 17, 288–299. [DOI] [PMC free article] [PubMed] [Google Scholar]
- Monteith GR, McAndrew D, Faddy HM, and Roberts-Thomson SJ (2007). Calcium and cancer: targeting Ca2+ transport. Nat. Rev. Cancer 7, 519–530. [DOI] [PubMed] [Google Scholar]
- Mu D, Chen L, Zhang X, See LH, Koch CM, Yen C, Tong JJ, Spiegel L, Nguyen KC, Servoss A, et al. (2003). Genomic amplification and oncogenic properties of the KCNK9 potassium channel gene. Cancer Cell 3, 297–302. [DOI] [PubMed] [Google Scholar]
- Nazarian R, Shi H, Wang Q, Kong X, Koya RC, Lee H, Chen Z, Lee MK, Attar N, Sazegar H, et al. (2010). Melanomas acquire resistance to B-RAF(V600E) inhibition by RTK or N-RAS upregulation. Nature 468, 973–977. [DOI] [PMC free article] [PubMed] [Google Scholar]
- Palm W, Park Y, Wright K, Pavlova NN, Tuveson DA, and Thompson CB (2015). The Utilization of Extracellular Proteins as Nutrients Is Suppressed by mTORC1. Cell 162, 259–270. [DOI] [PMC free article] [PubMed] [Google Scholar]
- Pardo LA, and Stühmer W (2014). The roles of K(+) channels in cancer. Nat. Rev. Cancer 14, 39–48. [DOI] [PubMed] [Google Scholar]
- Perera RM, and Zoncu R (2016). The Lysosome as a Regulatory Hub. Annu. Rev. Cell Dev. Biol 32, 223–253. [DOI] [PMC free article] [PubMed] [Google Scholar]
- Peterson TR, Laplante M, Thoreen CC, Sancak Y, Kang SA, Kuehl WM, Gray NS, and Sabatini DM (2009). DEPTOR is an mTOR inhibitor frequently overexpressed in multiple myeloma cells and required for their survival. Cell 137, 873–886. [DOI] [PMC free article] [PubMed] [Google Scholar]
- Piskounova E, Agathocleous M, Murphy MM, Hu Z, Huddlestun SE, Zhao Z, Leitch AM, Johnson TM, DeBerardinis RJ, and Morrison SJ (2015). Oxidative stress inhibits distant metastasis by human melanoma cells. Nature 527, 186–191. [DOI] [PMC free article] [PubMed] [Google Scholar]
- Poillet-Perez L, Xie X, Zhan L, Yang Y, Sharp DW, Hu ZS, Su X, Maganti A, Jiang C, Lu W, et al. (2018). Autophagy maintains tumour growth through circulating arginine. Nature 563, 569–573. [DOI] [PMC free article] [PubMed] [Google Scholar]
- Quintana E, Shackleton M, Sabel MS, Fullen DR, Johnson TM, and Morrison SJ (2008). Efficient tumour formation by single human melanoma cells. Nature 456, 593–598. [DOI] [PMC free article] [PubMed] [Google Scholar]
- Ran FA, Hsu PD, Wright J, Agarwala V, Scott DA, and Zhang F (2013). Genome engineering using the CRISPR-Cas9 system. Nat. Protoc 8, 2281–2308. [DOI] [PMC free article] [PubMed] [Google Scholar]
- Rink J, Ghigo E, Kalaidzidis Y, and Zerial M (2005). Rab conversion as a mechanism of progression from early to late endosomes. Cell 122, 735–749. [DOI] [PubMed] [Google Scholar]
- Samie M, Wang X, Zhang X, Goschka A, Li X, Cheng X, Gregg E, Azar M, Zhuo Y, Garrity AG, et al. (2013). A TRP channel in the lysosome regulates large particle phagocytosis via focal exocytosis. Dev. Cell 26, 511–524. [DOI] [PMC free article] [PubMed] [Google Scholar]
- Sardiello M, Palmieri M, di Ronza A, Medina DL, Valenza M, Gennarino VA, Di Malta C, Donaudy F, Embrione V, Polishchuk RS, et al. (2009). A gene network regulating lysosomal biogenesis and function. Science 325, 473–477. [DOI] [PubMed] [Google Scholar]
- Saxton RA, and Sabatini DM (2017). mTOR Signaling in Growth, Metabolism, and Disease. Cell 169, 361–371. [DOI] [PubMed] [Google Scholar]
- Scholl UI, Goh G, Stölting G, de Oliveira RC, Choi M, Overton JD, Fonseca AL, Korah R, Starker LF, Kunstman JW, et al. (2013). Somatic and germline CACNA1D calcium channel mutations in aldosterone-producing adenomas and primary aldosteronism. Nat. Genet 45, 1050–1054. [DOI] [PMC free article] [PubMed] [Google Scholar]
- Settembre C, Di Malta C, Polito VA, Garcia Arencibia M, Vetrini F, Erdin S, Erdin SU, Huynh T, Medina D, Colella P, et al. (2011). TFEB links autophagy to lysosomal biogenesis. Science 332, 1429–1433. [DOI] [PMC free article] [PubMed] [Google Scholar]
- Settembre C, Fraldi A, Medina DL, and Ballabio A (2013). Signals from the lysosome: a control centre for cellular clearance and energy metabolism. Nat. Rev. Mol. Cell Biol 14, 283–296. [DOI] [PMC free article] [PubMed] [Google Scholar]
- Shaw RJ, and Cantley LC (2006). Ras, PI(3)K and mTOR signalling controls tumour cell growth. Nature 441, 424–430. [DOI] [PubMed] [Google Scholar]
- Shen D, Coleman J, Chan E, Nicholson TP, Dai L, Sheppard PW, and Patton WF (2011). Novel cell- and tissue-based assays for detecting misfolded and aggregated protein accumulation within aggresomes and inclusion bodies. Cell Biochem. Biophys 60, 173–185. [DOI] [PMC free article] [PubMed] [Google Scholar]
- Shen D, Wang X, Li X, Zhang X, Yao Z, Dibble S, Dong XP, Yu T, Lieberman AP, Showalter HD, and Xu H (2012). Lipid storage disorders block lysosomal trafficking by inhibiting a TRP channel and lysosomal calcium release. Nat. Commun 3, 731. [DOI] [PMC free article] [PubMed] [Google Scholar]
- Signer RA, Magee JA, Salic A, and Morrison SJ (2014). Haematopoietic stem cells require a highly regulated protein synthesis rate. Nature 509, 49–54. [DOI] [PMC free article] [PubMed] [Google Scholar]
- Takahashi N, Chen HY, Harris IS, Stover DG, Selfors LM, Bronson RT, Deraedt T, Cichowski K, Welm AL, Mori Y, et al. (2018). Cancer Cells Co-opt the Neuronal Redox-Sensing Channel TRPA1 to Promote Oxidative-Stress Tolerance. Cancer Cell 33, 985–1003.e7. [DOI] [PMC free article] [PubMed] [Google Scholar]
- Thoreen CC, Kang SA, Chang JW, Liu Q, Zhang J, Gao Y, Reichling LJ, Sim T, Sabatini DM, and Gray NS (2009). An ATP-competitive mammalian target of rapamycin inhibitor reveals rapamycin-resistant functions of mTORC1. J. Biol. Chem 284, 8023–8032. [DOI] [PMC free article] [PubMed] [Google Scholar]
- Trusolino L, Bertotti A, and Comoglio PM (2010). MET signalling: principles and functions in development, organ regeneration and cancer. Nat. Rev. Mol. Cell Biol 11, 834–848. [DOI] [PubMed] [Google Scholar]
- Ueno Y, Sakurai H, Tsunoda S, Choo MK, Matsuo M, Koizumi K, and Saiki I (2008). Heregulin-induced activation of ErbB3 by EGFR tyrosine kinase activity promotes tumor growth and metastasis in melanoma cells. Int. J. Cancer 123, 340–347. [DOI] [PubMed] [Google Scholar]
- Valvezan AJ, and Manning BD (2019). Molecular logic of mTORC1 signalling as a metabolic rheostat. Nature Metabolism 1, 321–333. [DOI] [PMC free article] [PubMed] [Google Scholar]
- Venkatachalam K, Wong CO, and Zhu MX (2015). The role of TRPMLs in endolysosomal trafficking and function. Cell Calcium 58, 48–56. [DOI] [PMC free article] [PubMed] [Google Scholar]
- Walter P, and Ron D (2011). The unfolded protein response: from stress pathway to homeostatic regulation. Science 334, 1081–1086. [DOI] [PubMed] [Google Scholar]
- Wang T, Birsoy K, Hughes NW, Krupczak KM, Post Y, Wei JJ, Lander ES, and Sabatini DM (2015). Identification and characterization of essential genes in the human genome. Science 350, 1096–1101. [DOI] [PMC free article] [PubMed] [Google Scholar]
- Webb BA, Chimenti M, Jacobson MP, and Barber DL (2011). Dysregulated pH: a perfect storm for cancer progression. Nat. Rev. Cancer 11, 671–677. [DOI] [PubMed] [Google Scholar]
- Weinstock L, Furness AM, Herron S, Smith SS, Sankar S, DeRosa SG, Gao D, Mepyans ME, Scotto Rosato A, Medina DL, et al. (2018). Fingolimod Phosphate Inhibits Astrocyte Inflammatory Activity in Mucolipidosis IV. Hum. Mol. Genet 27, 2725–2738. [DOI] [PMC free article] [PubMed] [Google Scholar]
- Wong C-O, Li R, Montell C, and Venkatachalam K (2012). Drosophila TRPML is required for TORC1 activation. Curr. Biol 22, 1616–1621. [DOI] [PMC free article] [PubMed] [Google Scholar]
- Yamamoto A, Tagawa Y, Yoshimori T, Moriyama Y, Masaki R, and Tashiro Y (1998). Bafilomycin A1 prevents maturation of autophagic vacuoles by inhibiting fusion between autophagosomes and lysosomes in rat hepatoma cell line, H-4-II-E cells. Cell Struct. Funct 23, 33–42. [DOI] [PubMed] [Google Scholar]
Associated Data
This section collects any data citations, data availability statements, or supplementary materials included in this article.
Supplementary Materials
Data Availability Statement
Original data for the shRNA screens are available on Mendeley Data (https://doi.org/10.17632/ndxtvbg4ty.1).