

Abstract
There are more than 30 distinct types of mammalian retinal ganglion cells, each sensitive to different features of the visual environment. In rabbit retina, they can be grouped into four classes according to their morphology and stratification of their dendrites in the inner plexiform layer (IPL). The goal of this study was to describe the synaptic inputs to one type of Class IV ganglion cell, the third member of the sparsely branched Class IV cells (SB3). One cell of this type was partially reconstructed in a retinal connectome developed using automated transmission electron microscopy (ATEM). It had slender, relatively straight dendrites that ramify in the sublamina a of the IPL. The dendrites of the SB3 cell were always postsynaptic in the IPL, supporting its identity as a ganglion cell. It received 29% of its input from bipolar cells, a value in the middle of the range for rabbit retinal ganglion cells studied previously. The SB3 cell typically received only one synapse per bipolar cell from multiple types of presumed OLL bipolar cells; reciprocal synapses from amacrine cells at the dyad synapses were infrequent. In a few instances, the bipolar cells presynaptic to the SB3 ganglion cell also provided input to an amacrine cell presynaptic to the ganglion cell. There was apparently no crossover inhibition from narrow-field ON amacrine cells. Most of the amacrine cell inputs were from axons and dendrites of GABAergic amacrine cells, likely providing inhibitory input from outside the classical receptive field.
Keywords: Neural circuits, Interneuron, Projection neuron, Synapse, Electron microscopy
Introduction
Ganglion cells are the projection neurons of the retina, conveying visual information to the brain via their axons in the optic nerve. According to a recent survey, there are more than 30 distinct types of mammalian retinal ganglion cells, each sensitive to different features of the visual environment, and these can be grouped according to their morphology (Sanes & Masland, 2015). One such group has very fine dendrites that are long and straight and branch infrequently, and as a result, the dendritic arbor is relatively large but very sparse. Neurons with this general morphology have been termed “gamma” cells in cat retina (Boycott & Wässle, 1974). Ganglion cells with similar morphologies have also been described in other studies of cat retina (Kolb et al., 1981; Stanford, 1987), in primate retina (Rodieck & Watanabe, 1993; Yamada et al., 2005), and in rabbit retina (Pu & Amthor, 1990). While sharing some morphological features with M1 and M2 melanopsin-containing, intrinsically photosensitive ganglion cells (ipRGCs) (Hughes et al., 2016), this third type of sparsely branched cell is different from M1 and M2 cells. Recent studies in mouse retina suggest that some sparsely branched, non-ipRGCs have interesting receptive field properties that place them in the family of orientation-selective ganglion cells (Baden et al., 2016).
Here we describe, for the first time, the detailed morphology and synaptic inputs to a very sparsely branched ganglion cell in rabbit retina with dendrites broadly stratified in sublamina a of the IPL that we have named SB3. This study was performed using the retinal connectome RC1 developed using automated transmission electron microscopy in the Marc Laboratory at the University of Utah (Marc et al., 2013). We found that the SB3 ganglion cell receives dendritic inputs from an array of bipolar cell types, and perisomatic, as well as dendritic amacrine cell inputs that point to visual signals from well outside the conventional receptive field, inputs consistent with membership in the group of more complex ganglion cells.
Materials and methods
Connectome
The retinal layers included in the 16.5 terabyte RC1 connectome were the distal GCL, IPL, and proximal inner nuclear layer (INL). Images were captured at a resolution of ≈2 nm per pixel, and the final volume resides on an SQL Database server at the University of Utah, accessible at http://prometheus.med.utah.edu/. The volume was reassembled into a cohesive digital volume using the NCR Toolset (Publicly available at http://sci.utah.edu/software. html). The 33 μm × 0.25 mm volume of tissue used for RC1 was obtained from the retina of a light-adapted female Dutch Belted rabbit (Anderson et al., 2009, 2011a,b; Lauritzen et al., 2013, 2016; Marc et al., 2013,2014). This approach has a number of advantages when compared with early reconstructions of serial electron microscopic images and with other, modern approaches to connectomics. The resolution of the images is higher than those generated by scanning electron microscopy, which is used for some other connectomes, and it is possible to identify profiles of sectioned neurons based on their characteristic ultrastructure (Marc et al., 2013).
The volume was centered approximately 3 mm ventral to the visual streak. Tissue was processed for ATEM as described previously, with each section being approximately 70 nm in thickness. The image area of each slice was acquired using 950–1100 image tiles with a 15% overlap. The captured images used to create the RC1 connectome contained common TEM imperfections as well as a 350–400 nm wedge-shaped gap due to block refacing (Anderson et al., 2011a).
Annotation and reconstruction
Cells were annotated by hand using the Viking viewer for connectomics, developed by Dr. James Anderson in the Laboratory of Dr. Robert Marc [University of Utah; http://prometheus.med.utah.edu/~marclab/marclab_2011_Connectomes_index.html; (Anderson et al., 2011a,b]. The cells described here can be viewed in the RC1 connectome. To annotate cells, circular disks were placed at the center of mass of the profile on each section in which it appeared, allowing for approximate three-dimensional renderings of the annotated cells. Some cells could not be fully reconstructed due to processes exiting the volume, tissue artifacts, or difficulty tracing very thin processes. Conventional synapses, synaptic ribbons, gap junctions, and postsynaptic densities were annotated within Viking using the open curve function.
The reconstructed ganglion cell soma was located in the GCL. Although its axon was not included in the volume, its identity as a ganglion cell was confirmed because it was always postsynaptic in the IPL. The presynaptic cells were identified by their characteristic morphology and ultrastructure. Axon terminals of bipolar cells were filled with synaptic vesicles and made ribbon synapses. Processes of GABAergic amacrine cells were typically straight, varicose, and electron lucent. Processes of glycinergic amacrine cells had more complex trajectories and were more electron dense (Lauritzen et al., 2016).
Several programs were used to view reconstructions and circuitry diagrams, including Tulip software developed by the University of Bordeaux, France (http://tulip.labri.fr/), the Viz suite of web-based programs (based on GraphViz API at http://graphviz.org/, developed by AT&T Research, Middletown, NJ), VikingPlot developed by the Marc Laboratory at the University of Utah (http://prometheus.med.utah.edu/~marclab/index.html), and VikingView developed by the University of Utah Scientific Computing and Imaging Institute (https://www.sci.utah.edu/).
SBFSEM-tools, a program to provide three-dimensional images of the annotated cells, is described here for the first time. Images were prepared using an open-source MATLAB (MathWorks, Natick, MA) toolbox, SBFSEM-tools (https://github.com/neitzlab/sbfsem-tools). This program uses Viking’s Open Data Protocol (https://odata.org/) service to query the annotation database, and then parses the results into MATLAB data types. In addition to the built-in analysis and rendering algorithms, SBFSEM-tools provides an object-oriented framework to facilitate further programming by the end user. Data management and other low-level implementations are abstracted, allowing the end user to work with familiar objects like neurons and synapses. A graphical user interface provides access to the core functionality without requiring programming experience.
Neurons were rendered as triangle meshes, assembled from individually rendered nonbranching segments of connected annotations. Each segment was rendered with rotated cylinders, centered at the annotations’ XYZ coordinates and scaled by their radii. The rendering algorithm provides highly accurate reconstructions by avoiding functions like smoothing and fitting, which can misrepresent neuronal morphology and location. Synapses were rendered as unit spheres centered at the synapse annotation’s average XYZ location, and then scaled to optimize visibility.
The SBFSEM-tools program was designed with the goal of facilitating open-source scientific research and provides resources to enable data and code sharing. Because the annotation database is updated constantly, the data used at the time of figure preparation is preserved in JavaScript Object Notation (JSON), a common language-independent data-interchange format. A streamlined version of the program designed to work in the archived data files is provided to accompany publications. The data and code used to generate the figures this study can be found at https://github.com/neitzlab/RabbitGammaCell.
Dendritic stratification
AII amacrine cells have a distinctive morphology characterized by lobular appendages in the outer sublamina of the IPL (sublamina a) and arboreal dendrites in the inner sublamina (sublamina b) (Famiglietti & Kolb, 1975). Costratification with lobular appendages of AII amacrine cells was used as a qualitative depth marker for the annotated ganglion cell and its presynaptic cells (Mills & Massey, 1992). Each reconstructed bipolar cell and the ganglion cell were displayed alongside a nearby AII amacrine cell to determine the depth of their stratification in the IPL. The IPL boundaries in Figs. 7 and 8 were also estimated using nearby AII amacrine cells.
Fig. 7.
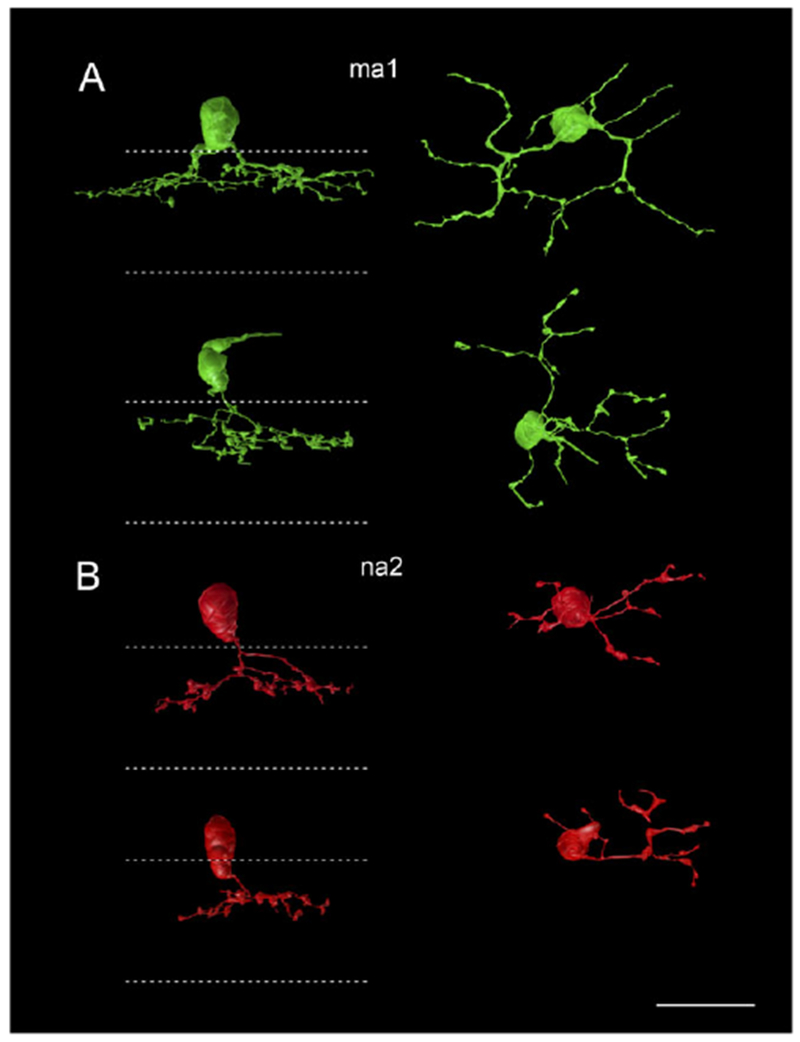
Four annotated bipolar cells presynaptic to the SB3 cell. (A) BC 5544 (top) and 11,092 (bottom), type ma1 cells, are green. (B) BC 437 and 460, type na2 cells, are red. Dotted lines indicate the IPL boundaries. Scale bar = 20 μm.
Fig. 8.
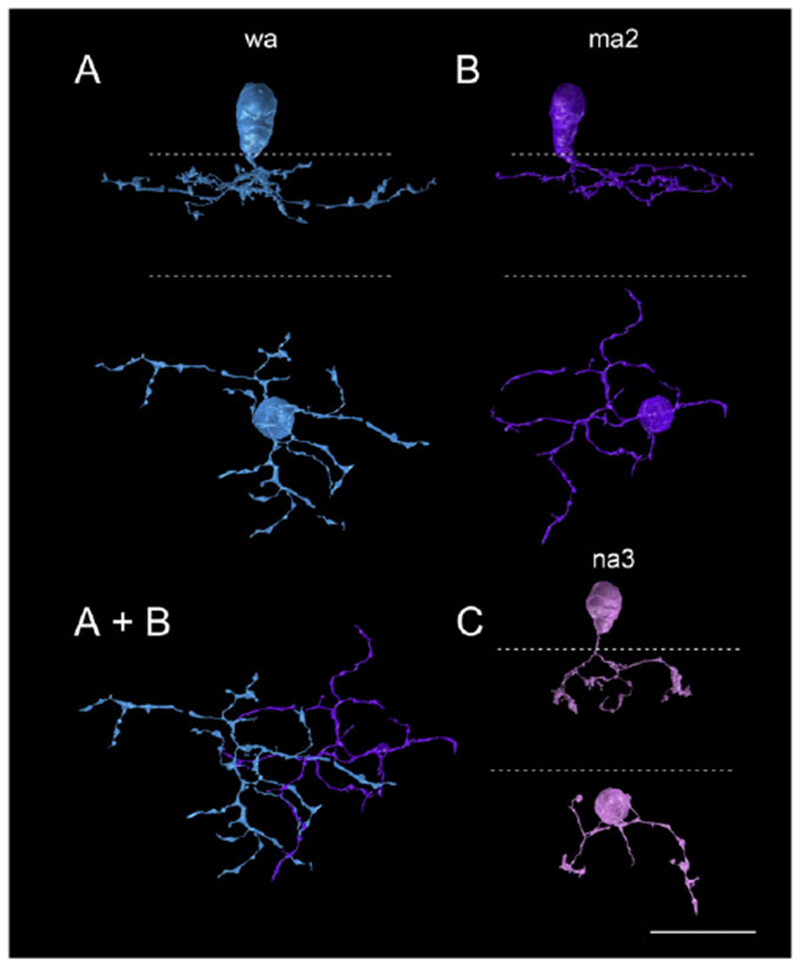
Three well-annotated bipolar cells presynaptic to the SB3 ganglion cell. (A) CB 5542 (blue) is classified as type wa. (B) CB 6131 (purple) is classified as type ma2. (A + B) In the bottom panel, the extensive overlap between the two is shown. (C) CB 5545 (pink) is classified as an na3. Dotted lines indicate the IPL boundaries. Scale bar = 20 μm.
Measurements
Diameters of ganglion cell dendrites were measured using the Measure Line tool in Viking; the Mosaic value, the most accurate, was recorded. Measurements were taken at the approximate midpoint of each dendrite segment; the shortest axial diameter of the dendrite in cross-section was measured. For the asymmetric synapse postsynaptic to the vGLUT3 cell, the post-synaptic density (PSD) was also measured using the Measure Line tool, from the plasma membrane of the post-synaptic cell to the cytoplasmic face of the PSD.
Data from images
Adobe Photoshop CS6 (San Jose, CA) and Microsoft PowerPoint (Redmond, WA) were used to prepare illustrations for figures, including adjustment of brightness and contrast. Color overlays for figures were made by tracing profiles within Photoshop and setting the color layer to an opacity of ≈20–30%. For figure preparation, several obvious artifacts due to misregistrations and other artifacts were corrected using Photoshop and SBFSEM-tools based on data collected using Viking and Tulip. For some figures, SBFSEM-tools was used to exclude processes distant from the area of interest.
Golgi-impregnation, analysis, and measurement of bipolar and ganglion cells
The tissue preparation, Golgi impregnation, and analytical methods for studying retinal neurons have been described in detail elsewhere (Famiglietti, 1992a,b). The methods used conformed to institutional and NIH guidelines. Golgi-impregnated rabbit retinas were prepared according to a Golgi-Kopsch-Colonnier method described elsewhere (Famiglietti, 1985). Retinas were mounted whole on glass slides either in DPX or in sheets of Epon/Araldite. Details of the methods used for the determination of retinal location, i.e., distance from mid-visual streak (dvs), for each cell are presented elsewhere (Famiglietti, 2004). Linear shrinkage of the tissue, due to fixation and dehydration, is estimated to be 15–25%. No corrections have been made for shrinkage in calculations of size and distance here or in the work of Famiglietti (1981).
Analysis of axon terminal stratification was performed for the most part in flat-mounted retinas, as described elsewhere in detail (Famiglietti, 1992b), using high magnification, high numerical aperture oil-immersion lenses and an accurate gear-driven (Zeiss WL) microscope stage elevator. Overlapping fiducial cells, including starburst amacrine cells, were used in determining level of stratification in the IPL. Camera lucida drawings of bipolar cells were made with a Zeiss drawing tube at a magnification of 2340×. Camera lucida drawings were digitized at 600 dpi on a flatbed scanner. Axon terminal field and dendritic field areas were measured using the graphics program ImageJ, after applying best-fitting convex polygons as described elsewhere (Famiglietti, 1992b). Areas were converted to “equivalent axon terminal field diameters”, according to the equation deq = 2√(A/π), where A = axon terminal field area.
Over the course of years, many hundreds of bipolar cells were examined in eighteen retinas. For the present study, a sample of 234 bipolar cells were analyzed in a single retina in a field measuring 0.72 mm2, centered at dvs = +3.4, and in the range +3.0 ≤ dvs ≤ +3.85, approximately corresponding to the retinal location of the sparsely branched ganglion cell under study. Identification and classification was based upon (1) dendritic branching pattern and arrangement of dendritic terminal appendages, (2) axon terminal branching pattern and arrangement and contours of axon terminal appendages, (3) diameter of axon terminal arbor, and (4) level of axon terminal stratification in the IPL. Details are provided in Table 1.
Table 1.
Morphological basis for the classification of type a cone bipolar cells in Golgi preparations of rabbit retina
| Type a cone bipolar cells | na1 | na2 | na3 | ma1 | ma2 | wa |
|---|---|---|---|---|---|---|
| Dendritic features: | ||||||
| Dendritic field diameter | Small-to-medium | Small | Small | Large | Medium | Small-to-medium |
| Dendritic branching | Divergent | Convergent | Convergent | Convergent | Convergent | Divergent or convergent on blue cones |
| Dendritic appendages | Cluster of digitiform appendages | Cluster of digitiform appendages | Many fine digitiform appendages; ring formations | Digitiform appendages; ring formations | Irregular appendages; paired digitiform appendages | Digitiform appendages |
| Axon terminal features: | ||||||
| Axon terminal field diameter | Small to medium | Small | Small | Large | Medium | Large |
| Axon terminal branching | Horizontal & vertical; highly branched | Vertical & horizontal; sparsely branched | Vertical & horizontal; highly branched | Horizontal; moderately branched; extensive, recurving branches | Horizontal; moderately branched; irregular | Horizontal & vertical; moderate to sparsely branched; extensive branches |
| Axon terminal appendages | Small lobulated | Large lobulated, and club-like | Small lobulated | Relatively uniform caliber; rugose | Thicker segments; thin segments & short, spindled branches | Thin segments, connecting rugose and lobulated segments |
| Axon terminal stratification | S1 (S2) | (S1) S2 | (S1) S2 | S1/S2 | S1 (S2) | S1 (S2,3,4) |
Levels of axon terminal stratification in parentheses indicate minor contributions of axonal branches.
Results
Morphology
The reconstructed SB3 retinal ganglion cell (Fig. 1A) had a soma in the GCL and sparse dendrites ramifying in the sublamina a of the IPL (Fig. 1B). The portion of the soma within RC1 was slightly ovoid with dimensions of 10.3 × 9.9 μm, although the full dimension, beneath RC1, was likely an equivalent diameter of at least 12 μm. Within the volume, the ganglion cell’s dendritic field measured 136 × 168 μm. Many of these dendrites were truncated at the boundaries of RC1, however. The SB3 cell had two primary dendrites that branched close to the soma (Fig. 1). The primary dendrites averaged 655 nm in diameter, and the secondary dendrites averaged 551 nm in diameter. The diameters of the higher order dendrites ranged from 150 to 591 nm. The synapses onto the SB3 cell seemed to be evenly distributed, not clustered (Fig. 2). One exception is the area of the ascending dendrite illustrated in the inset of Fig. 1B. Both of the spines there were postsynaptic to amacrine cells. Most of the other spines were smaller and not associated with synapses, however. The reconstructed ganglion cell was always postsynaptic to other cells.
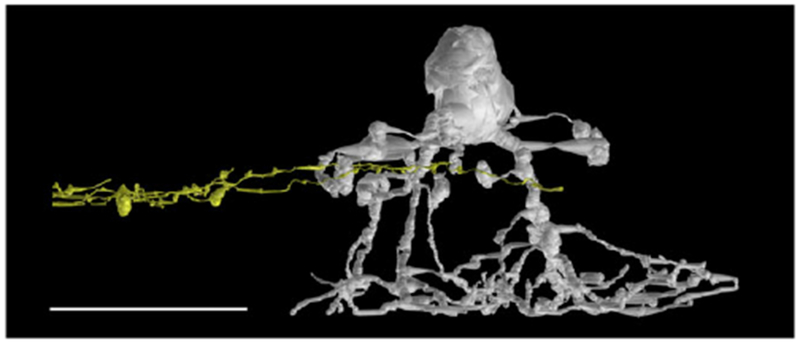
Fig. 1.
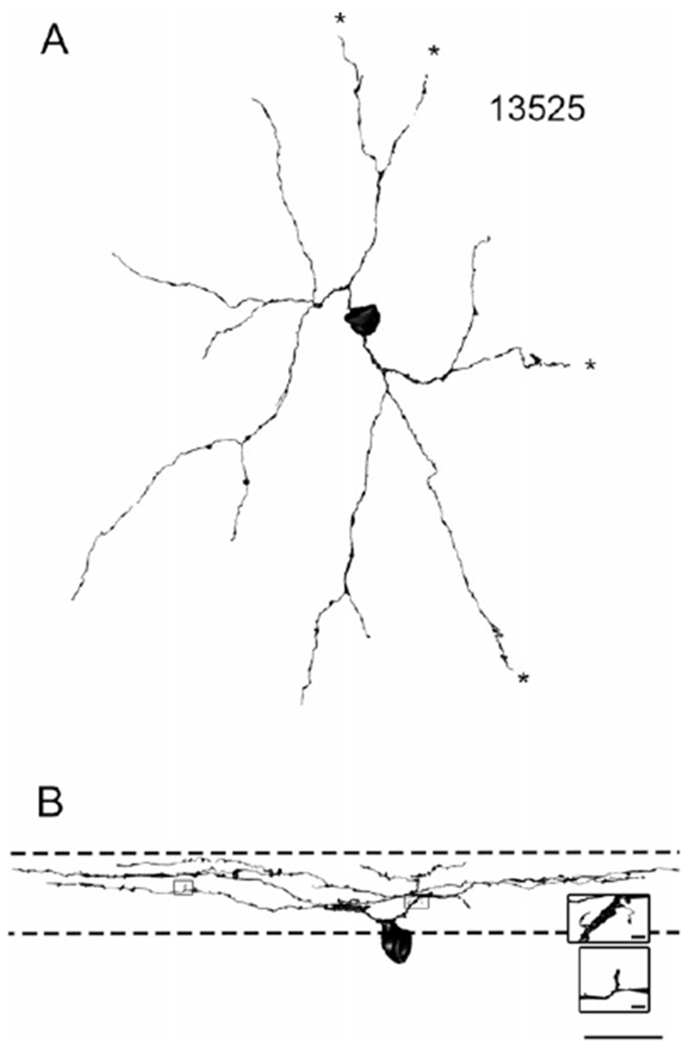
13525 is a sparsely branched SB3 retinal ganglion cell. Scale bar = 20 μm. (A) A 3-dimensional reconstruction of the ganglion cell as it would be viewed in a flat-mount preparation. The dendrites are fairly straight, and the dendritic tree is sparse. Several dendrites exited the volume and thus could not be fully traced. Dendrites that exited the volume are denoted with asterisks. (B) The ganglion cell oriented as it would appear in a vertical section. The approximate boundaries of the IPL are denoted by dashed lines. The cell has several dendritic spines. The spines in the top inset were both postsynaptic to amacrine cells; the spine in the bottom inset did not receive a synapse (inset scale bars = 1 μm).
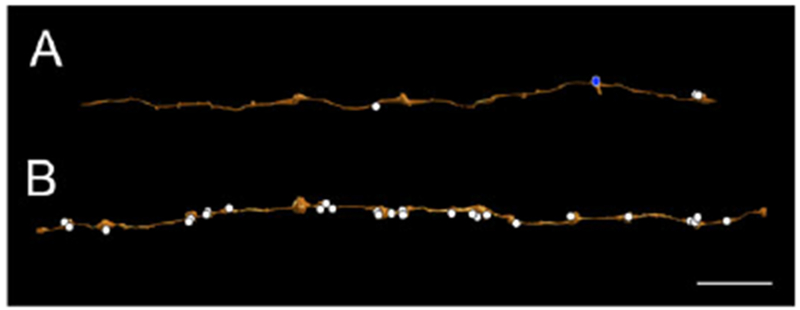
Fig. 2.
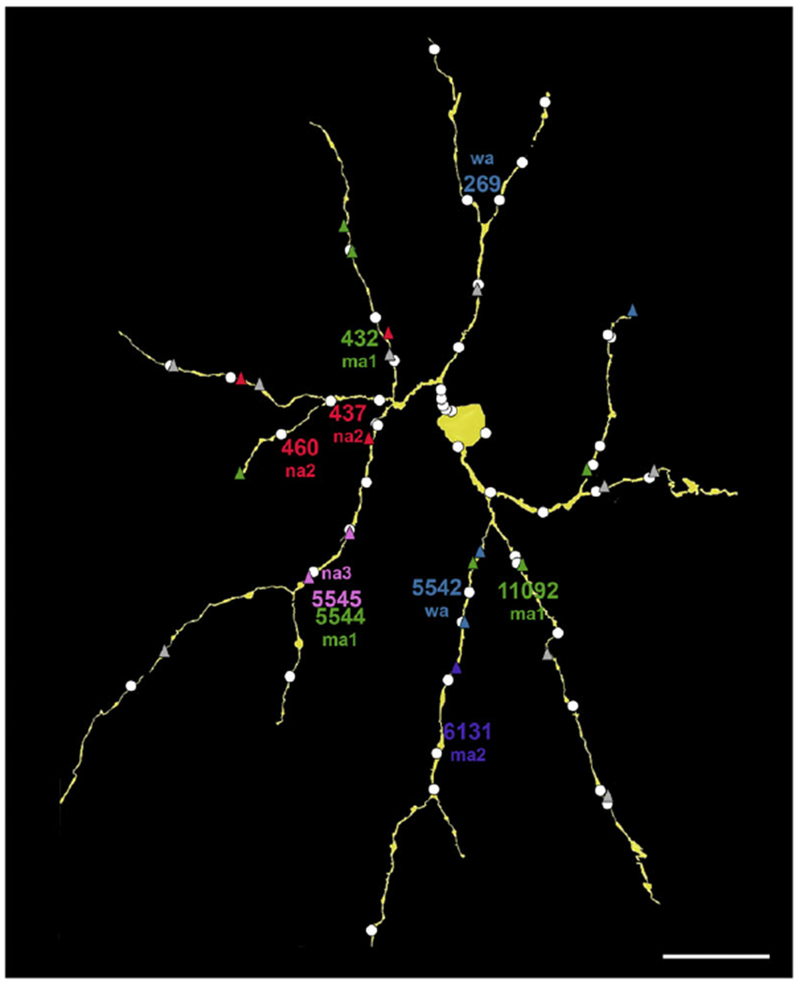
Synaptic inputs to the SB3 ganglion cell (yellow). Ribbon synapses from bipolar cell axons are triangles, and conventional synapses from amacrine cells are white circles. Many bipolar cell inputs are color-coded by type; unidentified bipolar cell synapses are gray. These include ma1 (green), ma2 (purple), na2 (red), na3 (pink), and wa (blue). The approximate locations of the somata are indicated by the placement of the names. Scale bar = 20 μm.
Stratification
The exact stratification depth in the IPL could not be calculated because of the gap in the IPL, a sectioning artifact. Instead, several reconstructed AII amacrine cells in the immediate vicinity of the ganglion cell were used to estimate the stratification depth. The higher order dendrites of the ganglion cell all co-stratified with the lobular appendages of AII amacrine cells (Fig. 3), indicating that they ramified in the sublamina a of the IPL. There were no synaptic inputs from AII amacrine cells, however.
Fig. 3.
The SB3 ganglion cell stratifies in the sublamina a of the IPL. Distal dendrites of the reconstructed ganglion cell (yellow) costratified with lobular appendages of a nearby AII amacrine cell (GAC AII 476, gray). Scale bar = 20 μm.
Bipolar cell identification, classification, and correlation with EM reconstructions
The sample population of 234 Golgi-impregnated bipolar cells included 137 type a cone bipolar cells, 94 type b cone bipolar cells, and three rod bipolar cells. Bipolar cells were identified and classified according to the criteria described in Methods, Table 1 and in Famiglietti (1981). Of the type a cells (Fig. 4), there were 97 narrow field cells: 17 na1, 17 na2, 57 na3, and six that could not be classified. There were 38 medium-wide field cells: 16 ma1 and 22 ma2 cells. Only two wide field (blue cone), wa cells were present in the field sampled. The ma1 cells correspond to the ma cells of Famiglietti (1981), and the ma2 cells are a new type, discovered in the course of the present study, with some resemblance to ma1 cells, but smaller in axon terminal field size (Fig. 5). Although wa cells do not differ significantly from ma1 cells in size, their paramorphic counterparts in sublamina b (wb cells) are much larger, justifying their designation as “wide-field” cells (Famiglietti, 2008).
Fig. 4.
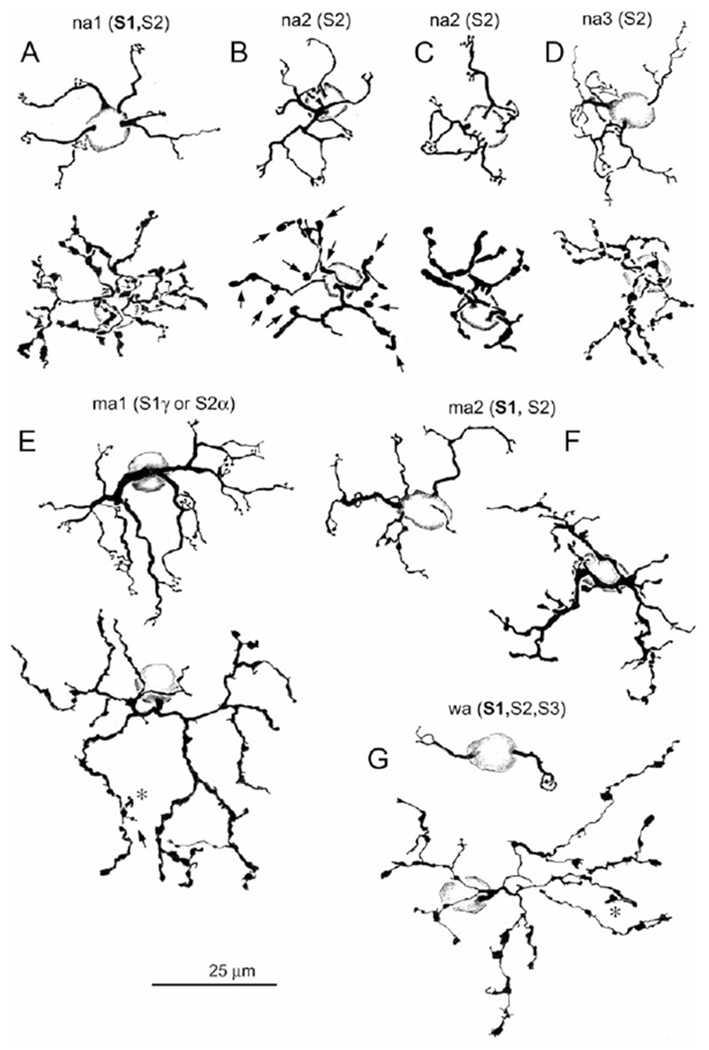
Camera lucida drawings of type a Golgi-impregnated cone bipolar cells located from 4.5 to 5.5 mm ventral to mid-visual streak. Dendritic trees and cone contacts are illustrated above and axon terminal arbors below. Strata of axon terminal branching are indicated in parentheses, bold indicating the primary level of branching. Arrows indicate processes descending toward the ganglion cell layer. Asterisks indicate processes ascending toward the inner nuclear layer. (A) na1 cone bipolar cell. (B and C) Note that the axon terminals of na2 cells (B and C) are variable in their horizontal laminar extent, although not in their stratification, which extends throughout sublamina a, and are concentrated in S2. (D) na3 cone bipolar cell. (E) ma1 bipolar cell. (F) ma2 cone bipolar cell. (G) wa (blue) cone bipolar cell. Except for nal cells, these bipolar cell types were found to be presynaptic to the SB3 ganglion cell. (B) corresponds to Fig. 7B; (D) corresponds to Fig. 8C; (E) corresponds to Fig. 7A; (F) corresponds to Fig. 8B; (G) corresponds to Fig. 8A. Levels of axon terminal stratification in parentheses indicate minor contributions of axonal branches. This example is atypical, lacking axon terminal branches that approach or cross the a/b sublaminar border.
Fig. 5.
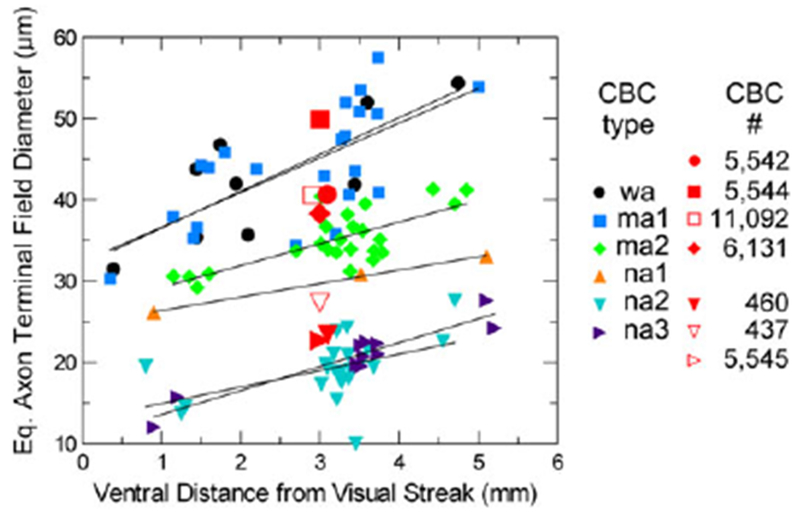
Graph of the variation of axon terminal field dimensions of Golgi-impregnated cone bipolar cells with distance from mid-visual streak, and dimensions of well-annotated and classified bipolar cells in RC1 (red), presynaptic to the SB3 ganglion cell. Symbols of the same shape denote the same types of bipolar cells. Curves are fitted to the data for each (Golgi-impregnated) bipolar cell type by linear regression, according to the equation E[y] = a + bx. In all cases, an increase in field size is demonstrated for increasing distance from the visual streak. Note that na2 and na3 cells are easily separated from na1, ma1 and 2, and wa cells, based upon size. There is more scatter in the sizes of ma1 and wa cells, the distributions of which overlap completely, than for the somewhat smaller ma2 cells. See text for further explanation.
Details of the dendritic trees and the dendritic criteria used to classify type a bipolar cells are given in Famiglietti (1981). Briefly, dendrites of na1 cells (Fig. 4A) diverge to contact individual cone pedicles, whereas those of na2 cells (Fig. 4B and 4C) converge on single cones with simple digitiform appendages. The dendrites of na3 (Fig. 4D) and the much larger ma1 (formerly ma) cells (Fig. 4E) converge to form complex, ring-like structures with numerous digitiform appendages, and those of wa cells (Fig. 4G) contact 1–4 or 5 widely separated (blue) cones. The new ma2 cells (Fig. 4F) have very irregular dendritic branching and terminal appendages, typically with just two digitiform appendages at a cone terminal. The finer and more complex axon terminal branching of na1 cells is mainly horizontal in extent in S1 with minor contributions to S2. The axon terminal branching of na3 cells is similar to na1 cells in caliber and sometimes in complexity, but is limited in horizontal extent, and is more vertically disposed with a concentration in S2.
The axon terminals of na2 cells are less complex and more clublike, compared to na3 cells. The axon terminals of ma1 cells are large in extent, of relatively uniform caliber, and rugose in contour and often exhibit a recurving trajectory, nearly touching other branches (region of arrow in Fig. 4E). They are narrowly stratified at the S1/S2 border, except for a few small appendages (asterisk and arrow in Fig. 4E). Axon terminals of wa cells are comparable in size to ma1 cells (Fig. 5), but very different in appearance with slender segments connecting club-like and irregular expansions. Their trajectory is generally divergent, and branches extend primarily in S1, often with one or two processes descending as deep as S4. The ma2 cells have very irregular axon terminal contours with extended thick segments and short branches of varying caliber extending from the main stem, thicker branches, primarily in S1.
The absence of the dendritic portions of the bipolar cells in the RC1 volume makes the identification of reconstructed cone bipolar cells more challenging, as dendritic branching pattern and dendritic terminal configuration are important for classification (see Fig. 4 and Table 1). Thus, the identifications in the reconstructed material must be regarded as provisional. Nevertheless, on the criterion of axon terminal field size alone, a good correspondence of types, comparing reconstructed and Golgi-impregnated bipolar cells, is evident, if one allows for the likelihood of greater shrinkage in the Golgi-impregnated material. The other principal features taken into account were the branching patterns and the contours of the axonal appendages, whether scalloped and rugose (ma1 and ma2), club-like (na2, wa), long, slender segments (wa), or smooth (na2, wa).
Bipolar cell input
The descending axons of the well-annotated bipolar cells presynaptic to the reconstructed ganglion cell did not make en passant ribbon synapses. Synapses were made only by the bipolar cell axon terminals, and the ganglion cell received their input exclusively at ribbon synapses (Fig. 6A and 6B). The majority of the bipolar cell synapses onto the ganglion cell occurred at dyads with ribbons on the presynaptic side and two postsynaptic processes (Fig. 6B), the second of which belonged to either amacrine or ganglion cells. The SB3 ganglion cell participated in one triad with two postsynaptic amacrine cells, and there was one monad from BC 129292, in which only the SB3 ganglion cell dendrite contained a postsynaptic density. There were only three instances in which the postsynaptic amacrine cell made reciprocal synapses onto the bipolar cell (e.g., Fig. 6B). In at least two instances, the second postsynaptic dendrite at a dyad came from another ganglion cell, and one of these ganglion cells was partially reconstructed. Although this ganglion cell co-stratified with the SB3 ganglion cell and had a sparse dendritic arbor, it appeared to be a different type because its dendrites had a larger diameter. The bipolar cells presynaptic to the SB3 ganglion cell did receive input from amacrine cells in a reciprocal configuration at other sites, but these were uncommon. For example, 38 ribbons were analyzed in ma1 cell 5544, and there were only eight reciprocal synapses at these ribbons. These reciprocal synapses appeared to be made by a subset of postsynaptic amacrine cells, including AII amacrine cells. The reconstructed portion of the SB3 ganglion cell was postsynaptic at 24 synapses to 18 type a bipolar cells (BC), and these provided 29.3% (24/82) of the total input within the volume reconstructed.
Fig. 6.
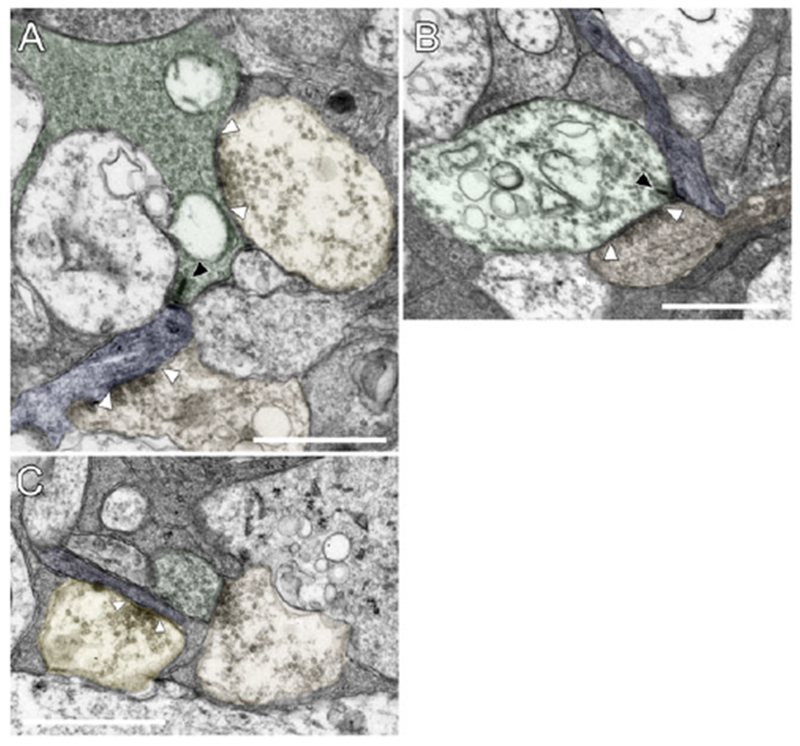
Excitatory and inhibitory synapses onto the SB3 ganglion cell. (A) A bipolar cell axon terminal (BC 11092, green) is presynaptic to a dendrite of the ganglion cell (blue) at a ribbon synapse (black arrowhead). The ribbon synapse is typical, with a synaptic ribbon and an asymmetric postsynaptic density. An amacrine cell (AC 104726, orange, lower) is presynaptic to the ganglion cell at a conventional synapse (white arrowheads). Another amacrine cell (unannotated, yellow, upper) is presynaptic to the bipolar cell axon terminal. (B) Bipolar cell input to the SB3 ganglion cell (blue) in S2 of the IPL. BC 7362 (green) was presynaptic to the ganglion cell at a ribbon synapse (black arrowhead). An amacrine cell (orange) in this dyad synapse made a reciprocal synapse onto the bipolar cell (white arrowheads). (C) Amacrine cell input to the SB3 ganglion cell. An amacrine cell (AC 122073, yellow) was presynaptic to the ganglion cell (blue) at a conventional synapse (arrowheads). A nearby amacrine cell (AC 123061, orange) was presynaptic to a bipolar cell (BC 5545, green), which was, in turn, presynaptic to both the ganglion cell and AC 122073 later in the series. Scale bars = 1 μm.
All of the presynaptic bipolar cells, including the incompletely annotated ones, are listed in Table 2. Typically, each bipolar cell made only one synapse onto the ganglion cell, but BC 354, BC 432, BC 437, BC 5542, BC 5545, and BC 11092 made at least two ribbon synapses each onto the SB3 ganglion cell. Several of the bipolar cells presynaptic to the reconstructed ganglion cell could be classified, and there were at least five types of presynaptic bipolar cells. Of the identified bipolar cells, the most common presynaptic cell type was ma1, which made five synapses in all. Because half of the presynaptic bipolar cells are unidentified, however, it would be premature to identify this as the predominant type. Types na2 and wa made three synapses each, na3 made 2, and ma2 made 1.
Table 2.
Summary of the 18 annotated bipolar cells presynaptic at 24 synapses to the SB3 ganglion cell. When axonal arbors were incompletely reconstructed, diameter is not specified. Bipolar cells presynaptic to the ganglion cell at two (or more) ribbon synapses are denoted with an asterisk
| Cell | This study | MacNeil et al. (2004) | Axonal arbor diameter (μm) | Figure |
|---|---|---|---|---|
| 437* | na2 | CBa1-2? | 27 | 7B, 10 |
| 460 | na2 | CBa1-2? | 23 | 7B, 10 |
| 5545* | na3 | Uncertain | 23 | 6C, 8C, 10 |
| 11092* | ma1 | CBa1w | 41 | 6A, 7A,10 |
| 432* | ma1 | CBa1w | Inc. | – |
| 5544 | ma1 | CBa1w | 50 | 7A, 10 |
| 6131 | ma2 | None | 38 | 8B, 10 |
| 5542* | Wa | None | 41 | 8A, 10 |
| 269 | Wa | None | Inc. | NS |
| 7362 | NC | N/A | Inc. | 6B |
| 354* | NC | N/A | Inc. | 10 |
| 129292 | NC | N/A | Inc. | 10 |
| 107367 | NC | N/A | Inc. | NS |
| 115581 | NC | N/A | Inc. | NS |
| 129948 | NC | N/A | Inc. | NS |
| 129954 | NC | N/A | Inc. | NS |
| 130256 | NC | N/A | Inc. | NS |
| 159125 | NC | N/A | Inc. | NS |
NC = not classified; NS = not shown; inc. = incompletely reconstructed axon terminals; N/A = not applicable.
It was not always possible to annotate the axonal arbor completely, but the cells whose axonal arbors were measured were virtually complete. Note in the graph of Fig. 5 that the field sizes of the reconstructed bipolar cell axon terminal compare favorably with those of the Golgi-impregnated examples, in regard to type. Seven 3D reconstructions of well-annotated presynaptic bipolar cells are illustrated in Figs. 7 and 8 to show the morphological features enabling their classification. BC 5544 (Fig. 7A) was a medium-wide-field bipolar cell; the axonal arbor measured 50 μm in equivalent diameter. On the criterion of size alone, this example could only be ma1 or wa (Fig. 5). Secondly, its terminal branches exhibited a recurving pattern, typical of ma1 cells (Table 1). Thirdly, the caliber of its branches was comparatively uniform, distinguishing it from wa cells (Table 1). A second ma1 cell, BC 11092 (Fig. 7A) with terminal branches of relatively uniform caliber had an axonal arbor diameter of 41 μm. BC 5542 (Fig. 8A) was similar in size to the ma1 cells, having an axonal arbor 41 μm in diameter (Fig. 5), but the axon terminal had a more radiate pattern of branching and lobulated contours with typically thin interconnecting segments, characteristics of wa cells (Table 1). The stratification of BC 5542 was also broader than that of the ma1 cells, and one or two of its branches may extend to the S2/S3 border (see Table 1).
BC 6131 (Fig. 8B) is a newly identified, medium-wide-field type a cone bipolar cell, ma2 (Fig. 4F). Although it was the only example of this type reconstructed in the RC1 connectome, the description of the ma2 type was based on the 29 examples from the Golgistained retinas. It has an axon terminal arbor larger than the narrow-field types but slightly smaller than the wide-held and ma1 types (Fig. 5). Its intermediate-sized axonal arbor measured 38 μm in diameter, and its axon terminals were stratihed in S1 with extensions into S2 of the IPL (cf. Fig. 4F).
Among the narrow-held cells, BC 437 (Fig. 7B) had an axonal arbor of relatively few, coarse, lobulated processes measuring 27 μm in diameter (Fig. 5), ramifying primarily in stratum 2, and was thus identified as an na2 bipolar cell (Fig. 4B and 4C). BC 460 (Fig. 7B) also had a narrow axonal arbor 23 μm in diameter (Fig. 5) of coarse lobulated processes, and was also classified as an na2 bipolar cell. BC 5545 (Fig. 8C), the asymmetric axonal arbor of which measured 23 μm in diameter (Fig. 5), differed from BC460 and BC5545 in having finer lobulated processes (cf. Fig. 4C and 4D). As expected for an na3 bipolar cell, its terminal arbor was broadly stratified in S1 and throughout S2. See Table 1 and Figs. 4 and 5 for further details.
Fractional bipolar cell input
We used data from earlier studies of rabbit retina to calculate the potential connectivity of bipolar cells with the dendrites of SB3 retinal ganglion cells. All of the presynaptic bipolar cells were classified as the OFF type based on the stratification of their axons in the sublamina a of the IPL. On average, this region contains 21,450 bipolar cells per mm2 (Strettoi & Masland, 1995). Because OFF bipolar cells comprise 37% of all bipolar cells in rabbit retina (Jones et al., 2011), 7937 OFF bipolar cells per mm2 would be expected in this area. The dendritic arbor of the partially reconstructed ganglion cell in this study occupied approximately 0.017 mm2 (calculated as the area of an ellipse), and 135 OFF bipolar cells would be expected to ramify in this area. Thus, 13.3% (18/135) of the OFF bipolar cells in the area synapsed onto the SB3 ganglion cell that was studied. Other SB3 ganglion cells would also be expected to branch in the sublamina a of the IPL, and some of their dendrites would overlap with those of the ganglion cell that was studied. The extent of dendritic overlap for SB3 ganglion cells in rabbit retina is not known, but assuming an overlap factor of 3, as it is for uniformity detectors in rabbit retina (Sivyer & Vaney, 2010), approximately 40% of the OFF bipolar cells in the area would be connected to the dendrites of SB3 ganglion cells.
Amacrine cell input
There were 58 synapses from amacrine cell (AC) processes onto the SB3 ganglion cell at conventional synapses (Fig. 6C and Table 3). These synapses were located on the soma and throughout the dendritic tree of the ganglion cell (Fig. 2). Some presynaptic amacrine cell processes could not be annotated (n = 9), and others could be traced for short (n = 37), medium (n = 7), or long (n = 5) distances. The annotated amacrine cell processes were classified according to their stratification, morphology, and ultrastructure. The majority of the amacrine cell processes were fairly straight, extended laterally, and had varicosities. Whenever possible, the intervaricosity diameter was measured, and it ranged from 67–300 nm with a median value of 172 nm. None of the amacrine cell processes co-fasciculated with the ganglion cell dendrites for any appreciable distance.
Table 3.
Well-annotated amacrine cells presynaptic to the reconstructed ganglion cell. Cells stratifying in the inner sublamina of the IPL are type b and cells stratifying in the outer sublamina are type a
| Cell | Type | Axon-like | Spines | Dense-core vesicles | Length traced | Length traced (μm) | Figure |
|---|---|---|---|---|---|---|---|
| 110830 | a | Yes | No | Yes | Medium | 25 | 10 |
| 129956 | a | Yes | Yes | Yes | Medium | 9 | – |
| 133779 | a | Yes | No | No | Medium | 30 | – |
| 104726 | a | No | No | Yes | Medium | 32 | 6A |
| 104740 | a | No | No | Yes | Long | 110 | 9B, 10 |
| 125157 | a | No | No | Yes | Long | 80 | 10 |
| 130239 | a | No | No | No | Long | 85 | 9A, 10 |
| 130237 | a | No | No | Yes | Medium | 8 | 10 |
| 104706 | b | Yes | No | No | Medium | 24 | – |
| 104719 | b | Yes | No | No | Medium | 18 | – |
| 111207 | b | Yes | Yes | Yes | Long | 60 | – |
| 5413 | b | No | Yes | Yes | Long | 100+ | 10 |
One of the presynaptic amacrine cells (AC 119388) was identified as the rabbit homolog of the glycinergic amacrine cell containing vesicular glutamate transporter 3 (vGluT3) based on its ultrastructure (Marshak, 2016). Although it made a symmetric, presumed inhibitory, synapse onto the SB3 ganglion cell, it made an asymmetric, presumed excitatory, synapse onto a presumed GABAergic amacrine cell dendrite nearby. The thickness of the postsynaptic density in the latter amacrine cell was 31.4 ± 4.3 nm (mean ± standard deviation) at that synapse. The SB3 ganglion cell apparently did not receive input from other types of glycinergic amacrine cells within the volume, including several nearby AII amacrine cells.
The other amacrine cells presynaptic to the SB3 ganglion cell appeared to be GABAergic (Lauritzen et al., 2016). Some of the amacrine cells in this volume had been identified previously based on the high levels of immunoreactive GABA in their somas and dendrites. The others were identified by their characteristic morphology and ultrastructure. Each process followed a straight trajectory through a single, relatively narrow stratum of the IPL and was typically varicose. The majority of these amacrine cells were found in the sublamina a of the IPL. The enlarged portions had relatively pale cytoplasm and contained small synaptic vesicles and other synaptic specializations (Fig. 6C), such as presynaptic dense projections (Famiglietti, 1991, 2005b). Some also contained large, dense-core vesicles (Table 3). The thinner portions contained microtubules and had darker cytoplasm.
Some of the presumed GABAergic amacrine cells presynaptic to the SB3 ganglion cell had long, sparsely branched processes that were classified as dendrites because they were both presynaptic and postsynaptic (Fig. 9A). They typically had a relatively uniform diameter, approximately 200 nm at the narrowest points. Other amacrine cells presynaptic to the ganglion cell had processes with more pronounced varicosities and very narrow segments between them. In some cases, they were exclusively presynaptic within the volume reconstructed, and these were classified as axons (Fig. 9B). They were found in both sublamina a and sublamina b (Table 3). Because amacrine cell axons often arise from dendrites of amacrine cells and run for several millimeters in the IPL (Famiglietti, 1992e), it is unlikely that the somas of these amacrine cells were contained in the volume.
Fig. 9.
Two kinds of amacrine cell processes provide inhibitory input to the SB3 ganglion cell. (A) A dendrite of an amacrine cell (AC 130239) received one conventional synapse (blue circle) from another, unannotated amacrine cell. It made three conventional synapses (white circles); one was onto the SB3 ganglion cell and two were onto other cells. (B) The amacrine cell (AC 104740) made 27 inhibitory conventional synapses (white circles). One was onto the SB3 ganglion cell and the rest were onto other cells. It did not receive any synapses and was therefore classified as an axon. Scale bar = 10 μm.
Discussion
Retinal ganglion cell taxonomy
The identification and taxonomic classification of the sparsely branched, SB3 ganglion cell described here was performed within a comprehensive system devised originally for retinal ganglion cells of cat (Famiglietti & Kolb, 1976), and then applied to rabbit retina in a series of publications (Famiglietti, 1987, 1992b, 2004, 2005a, 2009, 2016). The system of four morphological classes was devised partly in recognition of and for correlation with comprehensive electrophysiological studies of rabbit and cat retinal ganglion cells (Barlow et al., 1964; Levick, 1967; Cleland & Levick, 1974a,b; Stone & Fukuda, 1974; Caldwell & Daw, 1978), and comprises large-bodied class I and class II cells: Y-cells and X-cells, respectively (Jensen, 1991), class III cells: paramorphic pairs of ON and OFF center cells with medium and small cell bodies, and class IV cells: unpaired unistratified, and more complex bistratified and multistratified ganglion cells.
Among class IV SB ganglion cells are two types of intrinsically photosensitive ganglion cells (ipRGCs) that utilize melanopsin as a photopigment (Hoshi et al., 2009), designated M1 and M2 in other mammalian retinas (Berson, 2003). These branch in strata S1 (SB1) and S5 (SB2) of the IPL, respectively, and some of the latter are bistratified (Famiglietti, in preparation). A displaced variant of the M1 cells has been described using the Golgi method (Famiglietti, 1990).
Identity of the sparsely branched, SB3 ganglion cell
The SB3 ganglion cell resembles the wide-held, sparsely branched ganglion cells of cat retina termed gamma cells (Boycott & Wassle, 1974), and a type of phasic W cell (Stanford, 1987, his Fig. 5C). In the early studies of sparsely branched ganglion cells using the Golgi method (Boycott & Wassle, 1974; Kolb et al., 1992), the axons were not always labeled, and their sparse dendritic arbors resembled those of certain types of wide-held amacrine cells. Therefore, these authors considered the possibility that they were amacrine cells with somas located in the GCL. In retrospect, it is evident that some of the cells in these studies were, indeed, polyaxonal amacrine cells (Famiglietti, 1992c,d). In a recent physiological study of mouse retina, it was also unclear whether type 30 sparsely branched cells were ganglion cells (Baden et al., 2016).
Nevertheless, we are confident that the SB3 cell is a ganglion cell. We were unable to study that portion of the SB3 cell soma giving rise to the axon, but the fact that the SB3 cell in this study was always postsynaptic, and never presynaptic, in the IPL strongly supports its identity as a retinal ganglion cell. Moreover, a cell similar to the SB3 cell was retrogradely labeled by a tracer injection in the rabbit lateral geniculate nucleus (Pu & Amthor, 1990; their Fig. 8E), a finding that also supports the identity of the SB3 cell as a ganglion cell. The SB3 cell also resembles a similar Golgi-impregnated rabbit ganglion cell, with a comparable branching pattern but much more robust dendrites (Famiglietti, unpublished observations). The entire dendritic field of the SB3 cell was not contained within the volume; the dendrites that exit the volume are indicated in Fig. 1A.
The SB3 cell is not an ipRGC. Like the SB3 ganglion cell, many ipRGCs that branch in S1, M1 cells, have somas in the GCL and also have very sparse dendritic arbors. There are clear differences between the two cell types, however, as described above. The somata and dendrites of the ipRGCs are larger in diameter than those of the SB3 cell, and their dendrites ramify in the outermost substratum of sublamina a. Additionally, M1 ipRGCs are more sparsely branched, and their dendritic arbors are slightly larger than the predicted size of the SB3 cell (Hoshi et al., 2009).
Cone bipolar cell identification and classification
The reconstructed bipolar cells presynaptic to the SB3 cell were clearly heterogeneous. Consequently, it was worthwhile to attempt the identification of presynaptic bipolar cell types in order to gain some understanding of the likely visual responses of this hitherto unidentified ganglion cell.
The first systematic attempt to classify cone bipolar cells in rabbit retina (Famiglietti, 1981) was based upon (1) dendritic branching pattern and arrangement of dendritic terminal appendages, (2) axon terminal branching pattern, (3) diameter of axon terminal arbor, and (4) level of axon terminal stratification in the IPL (Table 1). Nine types were identified, of which five were type a cells, and subsequent studies illustrated selected types in some detail (Famiglietti, 1991, 2002, 2008). Other morphological classifications have been based upon injection and filling of bipolar cells that take up 4′,6-diamidino-2-phenylindole (DAPI), identifying three types (Li et al., 2004; Mills & Massey, 1992). More recent work has been based primarily on the axonal arbor: its diameter and stratification in the IPL (MacNeil et al., 2004; McGillem & Dacheux, 2001), studies in which 12 types were identified.
We have chosen to use the original system of classification (Famiglietti, 1981), rather than that of MacNeil and colleagues (MacNeil et al., 2004) for the following reasons. Except for the medium-wide-field and wide-field cone bipolar cells, examination of axon terminals, on which the latter study relied, is not determinative. Secondly, no place is given in the MacNeil system for wide-field, type a cone bipolar cells connected to blue cones (Figs. 4G and 8A), “wa” in (Famiglietti, 1981, 2008), two of which were identified as presynaptic to the SB3 ganglion cell in the present study. Thirdly, no specific information is given in the MacNeil study on precise locations of examples upon which that classification is based. This absence of information is problematic, because despite some variability in size, particularly for wa, ma1, and na2 cells, axon terminal arbor diameters of bipolar cells vary systematically with distance from mid-visual streak (Fig. 5).
In the present study, without information on the dendritic branching and with subtotal reconstruction of axon terminals of some narrow-field types (Table 2), classification of some narrow-field types must be provisional. As much as can be judged from the MacNeil study, we are confident only in the equivalence of their CBalw with our ma1 bipolar cell (Table 2), although it is clear that the ma1 cell is co-stratified with the type a starburst amacrine cell, which branches at the S1/S2 border, whereas the CBalw cell was regarded by MacNeil and colleagues (MacNeil et al., 2004) as branching in S1. In preparation for the present analysis of cone bipolar cell inputs to the SB3 ganglion cell, a new type a cone bipolar cell type was discovered, ma2, intermediate in size between the narrow-field types and the medium-wide field, type a cone bipolar cell, “ma”, now designated ma1 (Fig. 7A).
Multiple types of presynaptic bipolar cells
The cone bipolar cells presynaptic to the reconstructed ganglion cell included at least five distinct types based on the morphology, depth, and lateral extent of their axonal arbors; these included na2, na3, ma1, ma2, and wa (Famiglietti, 1981). The two adjacent cone bipolar cells of Fig. 8 were clearly of different types. The morphology of their axons was different, and the axon terminals overlapped extensively, whereas cone bipolar axon terminals of the same type tile the retina with minimal overlap (Wässle et al., 2009). Close comparative analysis of BC 6131 with Golgi-impregnated bipolar cells resulted in the discovery of a new cell type, the ma2 cone bipolar cell.
Based on the stratification of their axon terminals in the IPL, all the presynaptic bipolar cells would be expected to have OFF responses to light (McGillem & Dacheux, 2001). Although bipolar cells provided 29% of the input, they would likely generate relatively weak responses in the SB3 ganglion cell. The SB3 cell typically received only one synapse per bipolar cell, and because the bipolar cell types in mammalian retinas vary in their response kinetics (Franke et al., 2017), each type would be expected to provide a small, asynchronous excitatory drive to the ganglion cell during decrements in light intensity.
Multiple types of presynaptic amacrine cells
The amacrine cell inputs to the SB3 ganglion cell were to some degree heterogeneous, like those of ON–OFF direction-selective ganglion cells (Dacheux et al., 2003; Famiglietti, 2005b). GABAergic amacrine cells, among which wide-field amacrine cells predominate, provided the major input to the SB3 ganglion cell. Some of the GABAergic amacrine cells presynaptic to the SB3 ganglion cell had long, sparsely branched processes that were classified as dendrites. Most ramified in the sublamina a of the IPL, but a few contacted the ganglion cell in sublamina b. They closely resembled the dendrites of neurofibrillary, long-range amacrine cells (Vaney et al., 1988), the OFF subtype of the orientation-selective amacrine cells (Bloomfield, 1991, 1994), and the wide-field 1–2 type cells (MacNeil et al., 1999) described previously in rabbit retina.
Other GABAergic amacrine cell processes presynaptic to the SB3 ganglion cell, lacking synaptic input over a significant length, appeared to be axons. At least 7 types of axon-bearing amacrine cells have been described previously in the rabbit retina (Famiglietti, 1992c,d; Volgyi et al., 2001; Vaney, 2004; Murphy-Baum & Taylor, 2015). Their axons travel for several millimeters across the retina, and their synapses would be expected to contribute to responses from outside the classical receptive field (Baccus, 2007). All 7 morphological types of polyaxonal amacrine cells are candidates to provide input to SB3 cells because axonal synapses were found in both sublamina a and sublamina b of the IPL.
In addition to the likely GABAergic amacrine cells, one of the presynaptic amacrine cells was identified as the rabbit homolog of the glycinergic amacrine cell containing vGluT3. In mouse retina, the vGluT3 cells make excitatory synapses onto the GABAergic amacrine cells, among other targets (Lee et al., 2014), and the same was true of this dendrite in rabbit retina. Based on electrophysiological studies in mouse retina, the vGluT3 cells would be expected to inhibit the SB3 ganglion cell (Kim et al., 2015; Lee et al., 2016; Tien et al., 2016). This was apparently the only glycinergic amacrine cell presynaptic to the SB3 ganglion cell. This is surprising, because glycinergic synapses are abundant in sublamina a, and some ganglion cells in sublamina b receive more than 20% of their input from glycinergic amacrine cells (Freed & Sterling, 1988).
Comparison with other electron microscopic studies of retinal ganglion cells
The SB3 ganglion cell received 29.3% (24/82) of its input from OFF bipolar cells. The synaptic inputs to the SB3 ganglion cell are summarized in Fig. 10 and Tables 2 and 3. The percentage of bipolar cell input was intermediate between the three types of rabbit retinal ganglion cells described previously. In one study, ON–OFF direction-selective (DS) ganglion cells received 18.7% of the inputs to their dendrites in sublamina a from bipolar cells (Dacheux et al., 2003). In another study of the same ganglion cell type, the dendrites received 21.1% bipolar cell input in sublamina a and 18.7% bipolar cell input in sublamina b (Famiglietti, 2005b). A type of multistratified retinal ganglion cell also received a similar amount of bipolar cell input, 23%. On the other hand, a local edge detector received 48% bipolar cell input (Famiglietti, 2005b). In the case of wide-field ganglion cells, most such EM reconstruction studies have relied upon the analysis of one or two ganglion cells at most. The results for DS ganglion cells exhibit consistency across studies in a single species, however, and the study of a single ganglion cell, as in the present study, provides valuable insights into the similarities and differences in comparison to other studies.
Fig. 10.
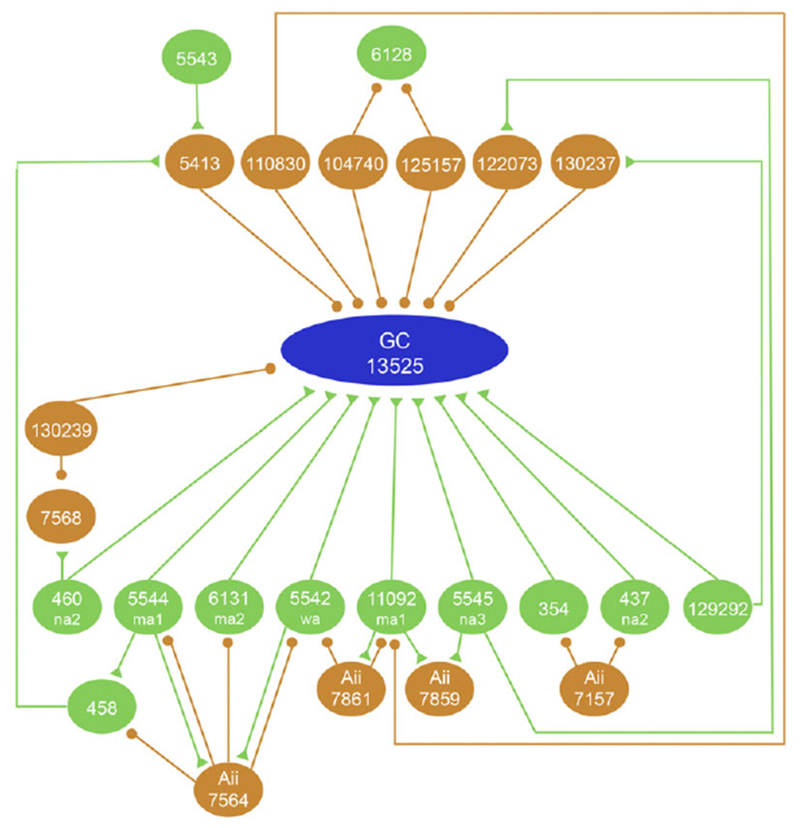
Interactions between amacrine cells (orange) and bipolar cells (green) in the circuit providing input to the ganglion cell (blue). The synaptic inputs of the SB3 ganglion cell and its presynaptic cells were analyzed in two ways. Synaptic interactions in which both the pre- and postsynaptic elements were annotated were registered as such by Viking and were queried using the Neuron Connectivity Network function in Tulip. Synaptic contacts where only one cell was annotated were not detected by the Neuron Connectivity function, and so they were identified visually. Orange circles represent conventional synapses and green triangles represent ribbon synapses. Two amacrine cells, 122073 and 130237, were postsynaptic to bipolar cells 5545 and 129292, respectively, that were, in turn, presynaptic to the ganglion cell. All amacrine cells made inhibitory synapses (circles) onto the bipolar cells presynaptic to the ganglion cell, but they did not make synapses onto the ganglion cell itself. Many other bipolar cells and amacrine cells made synapses onto the ganglion cell, but these did not interact with one another or with any of the other presynaptic cells (not illustrated).
Taken together, these results stand in contrast to those reported for ground squirrel (West & Dowling, 1972), in which a variety of ganglion cell types had either about 50% or else near zero percent bipolar cell input. They also contrast with inputs to X (class II or beta) and Y (class I or alpha) cells of cat retina, reported to have 70% (McGuire et al., 1986) and 14% (Freed & Sterling, 1988) bipolar cell input, respectively. In mouse retina, however, a study of punctae, using molecular markers of excitatory and inhibitory synapses, indicated that bipolar cells form about 45% of the input to the apparent homolog of ON-Y cells (Soto et al., 2011). In another study of cat retina (Watanabe et al., 1985), a single “W” cell with a medium-sized cell body received 19% of its input from bipolar cells.
In the study of a rabbit DS ganglion cell by EM (Famiglietti, 2005b), and in the light microscopic study of mouse ON-Y cells (Soto et al., 2011), there was a modest increase in the density of inputs toward the periphery of the dendritic field, and there was a more dramatic increase in the case of the cat W cell (Watanabe et al., 1985), but the ratio of bipolar to amacrine cell inputs was not significantly affected in any of these studies. Consequently, the absence of the distal portions of the SB3 cell’s dendritic tree is unlikely to affect the ratio we have calculated, and judging from the studies referred to above, neither would the types of inputs be affected.
Among the five different types of cone bipolar cell presynapatic to the SB3 cell, ma1 cells, costratified with and likely provided a principal bipolar cell input to type a starburst amacrine cells, was the most common. Its predominance cannot be assured, however, because so many presynaptic bipolar cells were unidentified. The apparent lack of specialization in bipolar cell inputs that we have found in the class IV, SB3 cell, contrasts with findings in class II, X cells in cat retina, where two types of cone bipolar cell provided the majority of bipolar cell input (McGuire et al., 1986), and in the case of a reconstructed class I, Y cell that received 85% of its input from a single type of cone bipolar cell (Freed & Sterling, 1988).
Functional implications of bipolar and amacrine cell inputs to the SB3 ganglion cell
Based on the stratification of their axon terminals in the IPL, all the cone bipolar cell types presynaptic to the SB3 ganglion cells are expected to have OFF responses to light (McGillem & Dacheux, 2001) upon stimulation of all three types of photoreceptors in the rabbit retina. One of the cone bipolar cell types presynaptic to SB3, ma1, also receives direct input from rods (Li et al., 2004), and this would provide rapid, depolarizing input to SB3 cells at the offset of dim stimuli in addition to slower depolarization via the primary rod pathway (Li et al., 2010). The finding that SB3 cells do not receive input from AII amacrine cells suggests that they would not receive direct inhibitory input at the onset of dim stimuli (Beaudoin et al., 2017).
Type wa bipolar cells that selectively contact blue cones in rabbit retina (Famiglietti, 1981, 2008; Liu & Chiao, 2007; Mills et al., 2014) are among those that made synapses onto the ganglion cell, but given the convergence of bipolar cell types with input from middle wavelength sensitive cones, SB3 ganglion cells would not be expected to show color-opponent responses.
Amacrine cell inputs that make the responses of other types of ganglion cells more robust, through reciprocal or crossover inhibition, were rare in the neural circuit providing input to the SB3 ganglion cell. Reciprocal inhibition of presynaptic bipolar cell terminals extends their dynamic range, enhancing temporal contrast and promoting correlated release (Grimes et al., 2010). Only three reciprocal synapses were seen at the bipolar cell synapses onto the SB3 cell. The presynaptic bipolar cells did receive inhibitory input from reciprocal synapses at other sites, however. Crossover inhibition, between ON and OFF circuits, enhances the light responses of other types of retinal ganglion cells (Werblin, 2011). There were no inputs from AII amacrine cells, implicated in crossover inhibition (Lauritzen et al., 2016), and there was only one from another type of glycinergic amacrine cell.
The likelihood that most of the amacrine cell input to the SB3 cell is GABAergic and from wide-held amacrine cells suggests that stimuli in the receptive held surround or outside of the classical receptive held would strongly inhibit the SB3 ganglion cell (Volgyi et al., 2001). There were only a few synaptic interactions among the bipolar cells and amacrine cells presynaptic to the ganglion cell (Fig. 10). In at least two instances, a bipolar cell was presynaptic to the ganglion cell and also to an amacrine cell that, in turn, made a synapse onto the ganglion cell. As a result, the ganglion cell would receive an excitatory input followed rapidly by an inhibitory input from the same part of the receptive held. The bipolar and amacrine cell inputs to the SB3 ganglion cell suggest that it would selectively signal the presence of small, dark objects in the receptive held center and that stimuli falling outside that area would likely suppress such responses.
Acknowledgments.
We are grateful to Dr. Stephen L. Mills for comments on the manuscript. Supported by the UTHealth BRAIN Initiative and the National Center for Advancing Translational Sciences of the National Institutes of Health under Award Number UL1TR000371, University of Texas BRAIN Seed Grant Program 363303, National Eye Institute Research Grants EY02576, EY027859, and EY03547, Training Grants T32-NS099578 and EY07031, Research to Prevent Blindness, and the NSERC of Canada.
References
- Anderson JR, Jones BW, Watt CB, Shaw MV, Yang JH, Demill D, Lauritzen JS, Lin Y, Rapp KD, Mastronarde D, Koshevoy P, Grimm B, Tasdizen T, Whitaker R & Marc RE (2011a). Exploring the retinal connectome. Molecular Vision 17, 355–379. [PMC free article] [PubMed] [Google Scholar]
- Anderson JR, Jones BW, Yang JH, Shaw MV, Watt CB, Koshevoy P, Spaltenstein J, Jurrus E, Kannan UV, Whitaker RT, Mastronarde D, Tasdizen T & Marc RE (2009). A computational framework for ultrastructural mapping of neural circuitry. PLoS Biology 7, el000074. [DOI] [PMC free article] [PubMed] [Google Scholar]
- Anderson JR, Mohammed S, Grimm B, Jones BW, Koshevoy P, Tasdizen T, Whitaker R &Marc RE (2011b). The Viking viewer for connectomics: Scalable multi-user annotation and summarization of large volume data sets. Journal of Microscopy 241, 13–28. [DOI] [PMC free article] [PubMed] [Google Scholar]
- Baccus SA (2007). Timing and computation in inner retinal circuitry. Annual Review of Physiology 69, 271–290. [DOI] [PubMed] [Google Scholar]
- Baden T, Berens P, Franke K, Roman Roson M, Bethge M & Euler T (2016). The functional diversity of retinal ganglion cells in the mouse. Nature 529, 345–350. [DOI] [PMC free article] [PubMed] [Google Scholar]
- Barlow HB, Hill RM & Levick WR (1964). Retinal ganglion cells responding selectively to direction and speed of image motion in the rabbit. The Journal of Physiology 173, 377–407. [DOI] [PMC free article] [PubMed] [Google Scholar]
- Beaudoin DL, Kupershtok M Demb JB (2017). Selective synaptic connections in the retinal pathway for night vision. The Journal of Comparative Neurology. [DOI] [PMC free article] [PubMed] [Google Scholar]
- Beaudoin DL, Kupershtok M Demb JB (2019). Selective synaptic connections in the retinal pathway for night vision. Journal of Comparative Neurology 527, 117–132. [DOI] [PMC free article] [PubMed] [Google Scholar]
- Berson DM (2003). Strange vision: Ganglion cells as circadian photoreceptors. Trends in Neurosciences 26, 314–320. [DOI] [PubMed] [Google Scholar]
- Bloomfield SA (1991). Two types of orientation-sensitive responses of amacrine cells in the mammalian retina. Nature 350, 347–350. [DOI] [PubMed] [Google Scholar]
- Bloomfield SA (1994). Orientation-sensitive amacrine and ganglion cells in the rabbit retina. Journal of Neurophysiology 71, 1672–1691. [DOI] [PubMed] [Google Scholar]
- Boycott BB & Wässle H (1974). The morphological types of ganglion cells of the domestic cat’s retina. The Journal of Physiology 240, 397–419. [DOI] [PMC free article] [PubMed] [Google Scholar]
- Caldwell JH & Daw NW (1978). New properties of rabbit retinal ganglion cells. The Journal of Physiology 276, 257–276. [DOI] [PMC free article] [PubMed] [Google Scholar]
- Cleland BG & Levick WR (1974a). Brisk and sluggish concentrically organized ganglion cells in the cat’s retina. The Journal of Physiology 240, 421–456. [DOI] [PMC free article] [PubMed] [Google Scholar]
- Cleland BG & Levick WR (1974b). Properties of rarely encountered types of ganglion cells in the cat’s retina and an overall classification. The Journal of Physiology 240, 457–492. [DOI] [PMC free article] [PubMed] [Google Scholar]
- Dacheux RF, Chimento MF & Amthor FR (2003). Synaptic input to the on-off directionally selective ganglion cell in the rabbit retina. The Journal of Comparative Neurology 456, 267–278. [DOI] [PubMed] [Google Scholar]
- Famiglietti EV (1981). Functional architecture of cone bipolar cells in mammalian retina. Vision Research 21, 1559–1563. [DOI] [PubMed] [Google Scholar]
- Famiglietti EV (1985). Starburst amacrine cells: Morphological constancy and systematic variation in the anisotropic field of rabbit retinal neurons. Journal of Neuroscience 5, 562–577. [DOI] [PMC free article] [PubMed] [Google Scholar]
- Famiglietti EV (1987). Morphological classification of ganglion cells in rabbit retina. Society for Neuroscience Abstract 13, 380. [Google Scholar]
- Famiglietti EV (1990). A distinct type of displaced ganglion cell in a mammalian retina. Brain Research 535, 169–173. [DOI] [PubMed] [Google Scholar]
- Famiglietti EV (1991). Synaptic organization of starburst amacrine cells in rabbit retina: Analysis of serial thin sections by electron microscopy and graphic reconstruction. The Journal of Comparative Neurology 309, 40–70. [DOI] [PubMed] [Google Scholar]
- Famiglietti EV (1992a). Dendritic co-stratification of ON and ON-OFF directionally selective ganglion cells with starburst amacrine cells in rabbit retina. The Journal of Comparative Neurology 324, 322–335. [DOI] [PubMed] [Google Scholar]
- Famiglietti EV (1992b). New metrics for analysis of dendritic branching patterns demonstrating similarities and differences in ON and ON-OFF directionally selective retinal ganglion cells. The Journal of Comparative Neurology 324, 295–321. [DOI] [PubMed] [Google Scholar]
- Famiglietti EV (1992c). Polyaxonal amacrine cells of rabbit retina: Morphology and stratification of PA1 cells. The Journal of Comparative Neurology 316, 391–405. [DOI] [PubMed] [Google Scholar]
- Famiglietti EV (1992d). Polyaxonal amacrine cells of rabbit retina: PA2, PA3, and PA4 cells. Light and electron microscopic studies with a functional interpretation. The Journal of Comparative Neurology 316, 422–446. [DOI] [PubMed] [Google Scholar]
- Famiglietti EV (1992e). Polyaxonal amacrine cells of rabbit retina: Size and distribution of PA1 cells. The Journal of Comparative Neurology 316, 406–421. [DOI] [PubMed] [Google Scholar]
- Famiglietti EV (2002). A structural basis for omnidirectional connections between starburst amacrine cells and directionally selective ganglion cells in rabbit retina, with associated bipolar cells. Visual Neuroscience 19, 145–162. [DOI] [PubMed] [Google Scholar]
- Famiglietti EV (2004). Class I and class II ganglion cells of rabbit retina: A structural basis for X and Y (brisk) cells. The Journal of Comparative Neurology 478, 323–346. [DOI] [PubMed] [Google Scholar]
- Famiglietti EV (2005a). “Small-tufted” ganglion cells and two visual systems for the detection of object motion in rabbit retina. Visual Neuroscience 22, 509–534. [DOI] [PubMed] [Google Scholar]
- Famiglietti EV (2005b). Synaptic organization of complex ganglion cells in rabbit retina: Type and arrangement of inputs to directionally selective and local-edge-detector cells. The Journal of Comparative Neurology 484, 357–391. [DOI] [PubMed] [Google Scholar]
- Famiglietti EV (2008). Wide-field cone bipolar cells and the blue-ON pathway to color-coded ganglion cells in rabbit retina. Visual Neuroscience 25, 53–66. [DOI] [PubMed] [Google Scholar]
- Famiglietti EV (2009). Bistratified ganglion cells of rabbit retina: Neural architecture for contrast-independent visual responses. Visual Neuroscience 26, 195–213. [DOI] [PubMed] [Google Scholar]
- Famiglietti EV (2016). Neural architecture of the “transient” ON directionally selective (class IIb1) ganglion cells in rabbit retina, partly co-stratified with starburst amacrine cells. Visual Neuroscience 33, E004. [DOI] [PubMed] [Google Scholar]
- Famiglietti EV & Kolb H (1975). A bistratified amacrine cell and synaptic cirucitry in the inner plexiform layer of the retina. Brain Research 84, 293–300. [DOI] [PubMed] [Google Scholar]
- Famiglietti EV & Kolb H (1976). Structural basis for ON-and OFF-center responses in retinal ganglion cells. Science 194, 193–195. [DOI] [PubMed] [Google Scholar]
- Franke K, Berens P, Schubert T, Bethge M, Euler T & Baden T (2017). Inhibition decorrelates visual feature representations in the inner retina. Nature 542, 439–444. [DOI] [PMC free article] [PubMed] [Google Scholar]
- Freed MA & Sterling P (1988). The ON-alpha ganglion cell of the cat retina and its presynaptic cell types. Journal of Neuroscience 8, 2303–2320. [DOI] [PMC free article] [PubMed] [Google Scholar]
- Grimes WN, Zhang J, Graydon CW, Kachar B & Diamond JS (2010). Retinal parallel processors: More than 100 independent microcircuits operate within a single interneuron. Neuron 65, 873–885. [DOI] [PMC free article] [PubMed] [Google Scholar]
- Hoshi EL, Liu WL, Massey SC & Mills SL (2009). ON inputs to the OFF layer: Bipolar cells that break the stratification rules of the retina. Journal of Neuroscience 29, 8875–8883. [DOI] [PMC free article] [PubMed] [Google Scholar]
- Hughes S, Jagannath A, Rodgers J, Hankins MW, Peirson SN & Foster RG (2016). Signalling by melanopsin (OPN4) expressing photosensitive retinal ganglion cells. Eye 30, 247–254. [DOI] [PMC free article] [PubMed] [Google Scholar]
- Jensen RJ (1991). Involvement of glycinergic neurons in the diminished surround activity of ganglion cells in the dark-adapted rabbit retina. Visual Neuroscience 6, 43–53. [DOI] [PubMed] [Google Scholar]
- Jones BW, Kondo M, Terasaki H, Watt CB, Rapp K, Anderson J, Lin Y, Shaw MV, Yang JH & Marc RE (2011). Retinal remodeling in the Tg P347L rabbit, a large-eye model of retinal degeneration. The Journal of Comparative Neurology 519, 2713–2733. [DOI] [PMC free article] [PubMed] [Google Scholar]
- Kim T, Soto F & Kerschensteiner D (2015). An excitatory amacrine cell detects object motion and provides feature-selective input to ganglion cells in the mouse retina. eLife 4, e08025. [DOI] [PMC free article] [PubMed] [Google Scholar]
- Kolb H, Linberg KA & Fisher SK (1992). Neurons of the human retina: A Golgi study. The Journal of Comparative Neurology 318, 147–187. [DOI] [PubMed] [Google Scholar]
- Kolb H, Nelson R & Mariani A (1981). Amacrine cells, bipolar cells and ganglion cells of the cat retina: A Golgi study. Vision Research 21, 1081–1114. [DOI] [PubMed] [Google Scholar]
- Lauritzen JS, Anderson JR, Jones BW, Watt CB, Mohammed S, Hoang JV & Marc RE (2013). ON cone bipolar cell axonal synapses in the OFF inner plexiform layer of the rabbit retina. The Journal of Comparative Neurology 521, 977–1000. [DOI] [PMC free article] [PubMed] [Google Scholar]
- Lauritzen JS, Sigulinsky CL, Anderson JR, Kalloniatis M, Nelson NT, Emrich DP, Rapp C, McCarthy N, Kerzner E, Meyer M, Jones BW & Marc RE (2016). Rod-cone crossover connectome of mammalian bipolar cells. The Journal of Comparative Neurology 527, 87–116. [DOI] [PMC free article] [PubMed] [Google Scholar]
- Lee S, Chen L, Chen M, Ye M, Seal RP & Zhou ZJ (2014). An unconventional glutamatergic circuit in the retina formed by vGluT3 amacrine cells. Neuron 84, 708–715. [DOI] [PMC free article] [PubMed] [Google Scholar]
- Lee S, Zhang Y, Chen M & Zhou ZJ (2016). Segregated glycine-glutamate Co-transmission from vGluT3 amacrine cells to contrast-suppressed and contrast-enhanced retinal circuits. Neuron 90, 27–34. [DOI] [PMC free article] [PubMed] [Google Scholar]
- Levick WR (1967). Receptive fields and trigger features of ganglion cells in the visual streak of the rabbits retina. The Journal of Physiology 188, 285–307. [DOI] [PMC free article] [PubMed] [Google Scholar]
- Li W, Chen S & DeVries SH (2010). A fast rod photoreceptor signaling pathway in the mammalian retina. Nature Neuroscience 13, 414–416. [DOI] [PMC free article] [PubMed] [Google Scholar]
- Li W, Keung JW & Massey SC (2004). Direct synaptic connections between rods and OFF cone bipolar cells in the rabbit retina. The Journal of Comparative Neurology 474, 1–12. [DOI] [PubMed] [Google Scholar]
- Liu PC & Chiao CC (2007). Morphologic identification of the OFF-type blue cone bipolar cell in the rabbit retina. Investigative Ophthalmology & Visual Science 48, 3388–3395. [DOI] [PubMed] [Google Scholar]
- Macneil MA, Heussy JK, Dacheux RF, Raviola E & Masland RH (1999). The shapes and numbers of amacrine cells: Matching of photofilled with golgi-stained cells in the rabbit retina and comparison with other mammalian species. The Journal of Comparative Neurology 413, 305–326. [PubMed] [Google Scholar]
- Macneil MA, Heussy JK, Dacheux RF, Raviola E & Masland RH (2004). The population of bipolar cells in the rabbit retina. The Journal of Comparative Neurology 472, 73–86. [DOI] [PubMed] [Google Scholar]
- Marc RE, Anderson JR, Jones BW, Sigulinsky CL & Lauritzen JS (2014). The AII amacrine cell connectome: A dense network hub. Frontiers in Neural Circuits 8, 104. [DOI] [PMC free article] [PubMed] [Google Scholar]
- Marc RE, Jones BW, Watt CB, Anderson JR, Sigulinsky C & Lauritzen S (2013). Retinal connectomics: Towards complete, accurate networks. Progress in Retinal and Eye Research 37, 141–162. [DOI] [PMC free article] [PubMed] [Google Scholar]
- Marshak DW (2016). A tale of two neurotransmitters. Visual Neuroscience 33, E017. [DOI] [PMC free article] [PubMed] [Google Scholar]
- McGillem GS & Dacheux RF (2001). Rabbit cone bipolar cells: Correlation of their morphologies with whole-cell recordings. Visual Neuroscience 18, 675–685. [DOI] [PubMed] [Google Scholar]
- McGuire BA, Stevens JK & Sterling P (1986). Microcircuitry of beta ganglion cells in cat retina. Journal of Neuroscience 6, 907–918. [DOI] [PMC free article] [PubMed] [Google Scholar]
- Mills SL & Massey SC (1992). Morphology of bipolar cells labeled by DAPI in the rabbit retina. The Journal of Comparative Neurology 321, 133–149. [DOI] [PubMed] [Google Scholar]
- Mills SL, Tian LM, Hoshi EL, Whitaker CM & Massey SC (2014). Three distinct blue-green color pathways in a mammalian retina. Journal of Neuroscience 34, 1760–1768. [DOI] [PMC free article] [PubMed] [Google Scholar]
- Murphy-Baum BL & Taylor WR (2015). The synaptic and morphological basis of orientation selectivity in a polyaxonal amacrine cell of the rabbit retina. Journal of Neuroscience 35, 13336–13350. [DOI] [PMC free article] [PubMed] [Google Scholar]
- Pu ML & Amthor FR (1990). Dendritic morphologies of retinal ganglion cells projecting to the lateral geniculate nucleus in the rabbit. The Journal of Comparative Neurology 302, 675–693. [DOI] [PubMed] [Google Scholar]
- Rodieck RW & Watanabe M (1993). Survey of the morphology of macaque retinal ganglion cells that project to the pretectum, superior colliculus, and parvicellular laminae of the lateral geniculate nucleus. The Journal of Comparative Neurology 338, 289–303. [DOI] [PubMed] [Google Scholar]
- Sanes JR & Masland RH (2015). The types of retinal ganglion cells: Current status and implications for neuronal classification. Annual Review of Neuroscience 38, 221–246. [DOI] [PubMed] [Google Scholar]
- Sivyer B & Vaney DI (2010). Dendritic morphology and tracer-coupling pattern of physiologically identified transient uniformity detector ganglion cells in rabbit retina. Visual Neuroscience 27, 159–170. [DOI] [PubMed] [Google Scholar]
- Soto F, Bleckert A, Lewis R, Kang Y, Kerschensteiner D, Craig AM & Wong RO (2011). Coordinated increase in inhibitory and excitatory synapses onto retinal ganglion cells during development. Neural Development 6, 31. [DOI] [PMC free article] [PubMed] [Google Scholar]
- Stanford LR (1987). X-cells in the cat retina: Relationships between the morphology and physiology of a class of cat retinal ganglion cells. Journal of Neurophysiology 58, 940–964. [DOI] [PubMed] [Google Scholar]
- Stone J & Fukuda Y (1974). Properties of cat retinal ganglion cells: A comparison of W-cells with X- and Y-cells. Journal of Neurophysiology 37, 722–748. [DOI] [PubMed] [Google Scholar]
- Strettoi E & Masland RH (1995). The organization of the inner nuclear layer of the rabbit retina. Journal of Neuroscience 15, 875–888. [DOI] [PMC free article] [PubMed] [Google Scholar]
- Tien NW, Kim T & Kerschensteiner D (2016). Target-specific glycinergic transmission from VGluT3-expressing amacrine cells shapes suppressive contrast responses in the retina. Cell Reports 15, 1369–1375. [DOI] [PMC free article] [PubMed] [Google Scholar]
- Vaney DI (2004). Type 1 nitrergic (ND1) cells of the rabbit retina: Comparison with other axon-bearing amacrine cells. The Journal of Comparative Neurology 474, 149–171. [DOI] [PubMed] [Google Scholar]
- Vaney DI, Peichl L & Boycott BB (1988). Neurofibrillar long-range amacrine cells in mammalian retinae. Proceedings of the Royal Society of London Series B, Biological Sciences 235, 203–219. [DOI] [PubMed] [Google Scholar]
- Volgyi B, Xin D, Amarillo Y & Bloomfield SA (2001). Morphology and physiology of the polyaxonal amacrine cells in the rabbit retina. The Journal of Comparative Neurology 440, 109–125. [DOI] [PubMed] [Google Scholar]
- Wassle H, Puller C, Muller F & Haverkamp S (2009). Cone contacts, mosaics, and territories of bipolar cells in the mouse retina. Journal of Neuroscience 29, 106–117. [DOI] [PMC free article] [PubMed] [Google Scholar]
- Watanabe M, Fukuda Y, Hsiao CF, & Ito H (1985). Electron microscopic analysis of amacrine and bipolar cell inputs on Y-, X-, and W-cells in the cat retina. Brain Research 358, 229–40. [DOI] [PubMed] [Google Scholar]
- Werblin FS (2011). The retinal hypercircuit: A repeating synaptic interactive motif underlying visual function. The Journal of Physiology 589, 3691–3702. [DOI] [PMC free article] [PubMed] [Google Scholar]
- West RW & Dowling JE (1972). Synapses onto different morphological types of retinal ganglion cells. Science 178, 510–512. [DOI] [PubMed] [Google Scholar]
- Yamada ES, Bordt AS & Marshak DW (2005). Wide-field ganglion cells in macaque retinas. Visual Neuroscience 22, 383–393. [DOI] [PMC free article] [PubMed] [Google Scholar]