

SUMMARY
Neural computation involves diverse types of GABAergic inhibitory interneurons that are integrated with excitatory neurons into precisely structured circuits. To understand how each neuron type shapes sensory representations, we measured firing patterns of defined types of neurons in the barrel cortex while mice performed an active, whisker-dependent object-localization task. Touch excited fast-spiking (FS) interneurons at short latency, followed by activation of excitatory (E) neurons and somatostatinexpressing (SST) interneurons. Touch only weakly modulated vasoactive intestinal polypeptideexpressing (VIP) interneurons. Voluntary whisker movement activated FS neurons in the ventral posteromedial nucleus (VPM) target layers, a subset of SST neurons and a majority of VIP neurons. Together, FS neurons track thalamic input, mediating feedforward inhibition. SST neurons monitor local excitation, providing feedback inhibition. VIP neurons are activated by non-sensory inputs, disinhibiting E and FS neurons. Our data reveal rules of recruitment for interneuron types during behavior, providing foundations for understanding computation in cortical microcircuits.
eTOC Blurb
Yu et al. measured the firing patterns of three major types of GABAergic inhibitory interneurons in the somatosensory cortex of mice during active tactile sensation. These cell types are recruited with distinct millisecond scale dynamics, revealing cell type-specific interactions and functions.
Graphical Abstract
INTRODUCTION
Stimulation of the primary somatosensory cortex produces conscious somatosensory percepts (Flesher et al., 2016; Penfield and Boldrey, 1937; Romo et al., 1998). Somatosensory signals travel from the periphery via the thalamus to the somatosensory cortex and are transformed by intricate cortical circuits composed of diverse types of excitatory neurons and GABAergic inhibitory interneurons. Diverse types of GABAergic interneurons, likely with different functions, intermingle in individual cortical layers. Modern molecular methods, in combination with neurophysiology and anatomy, have advanced our knowledge of the diversity of cortical GABAergic interneurons (Feldmeyer et al., 2018; Jiang et al., 2015; Rudy et al., 2011; Taniguchi et al., 2011; Tasic et al., 2018; Tremblay et al., 2016). However, we are only beginning to unravel specific functions of different types of GABAergic interneurons during sensory, motor, and cognitive behaviors (Gentet et al., 2010, 2012; Kvitsiani et al., 2013; Lee et al., 2013; Muñoz et al., 2017; Sachidhanandam et al., 2016; Yu et al., 2016).
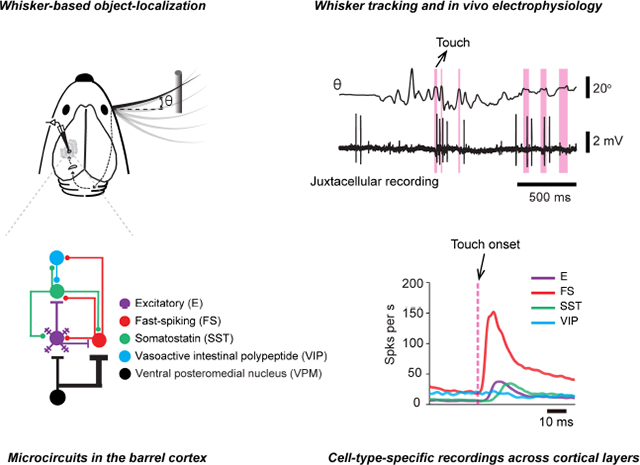
During active tactile sensation, animals move their digits or whiskers to scan objects (Gibson, 1962), producing somatosensory signals related to self-movement (reafference) and touch (exafference). These signals in turn are interpreted by the brain in terms of object location and properties. Rodents can be trained to move their whiskers to search for objects and report object location by licking or lever pressing (Knutsen et al., 2006; Mehta et al., 2007; O’Connor et al., 2010a). The whisker somatosensory (barrel) cortex participates in active tactile sensation (Guo et al., 2014a; Hong et al., 2018; O’Connor et al., 2010a, 2013). Using intrinsic signal imaging (Masino et al., 1993), the cortical location representing individual whiskers can be precisely mapped. Whisker movement and contacts between whisker and objects can be tracked with high-speed videography at millisecond timescales (Clack et al., 2012). Transgenic mice expressing Cre recombinase in subsets of interneurons provide a critical enabling tool for cell type-specific electrophysiology (Taniguchi et al., 2011). Together these methods provide an unprecedented opportunity to dissect the cortical processing of active touch signals in the microcircuits of barrel cortex during behavior.
Classic studies in anesthetized or sedated rodents with passive whisker stimuli have measured the receptive fields and response latencies of barrel cortex neurons across cortical layers (Armstrong-James et al., 1992; Brecht and Sakmann, 2002; Brecht et al., 2003; Bruno and Simons, 2002; Manns et al., 2004; Moore and Nelson, 1998; Simons, 1978; Simons and Carvell, 1989). Some studies distinguished excitatory neurons and fast-spiking interneurons (presumably parvalbumin-expressing ones) based on spike waveforms (Simons, 1978; Swadlow, 1995). Transgenic mice expressing fluorescent markers (Ma et al., 2006; Oliva et al., 2000) or Cre recombinase (Taniguchi et al., 2011) in GABAergic interneurons have allowed cell-type specific recordings of other types of interneurons, such as SST neurons, which cannot be identified based on spike waveform. SST neurons have been recorded in superficial layers of barrel cortex in awake mice and were found to be inhibited by whisker movements and touch (Gentet et al., 2010, 2012). However, responses could differ across cortical layers, because layers are innervated by distinct thalamic nuclei and long-range cortical inputs (Kinnischtzke et al., 2014; Lee et al., 2013; Lu and Lin, 1993; Mao et al., 2011; Petreanu et al., 2009; Wimmer et al., 2010), and have unique local connectivity patterns (Bureau et al., 2006; Hooks et al., 2011; Jiang et al., 2015; Lefort et al., 2009; Shepherd and Svoboda, 2005). In addition, responses are modulated by behavioral condition (Kuchibhotla et al., 2017). One recent study has examined the firing patterns of SST neurons across cortical layers (Muñoz et al., 2017). This study focuses on spike rate modulation between quiescence and active wakefulness but leaves the characterization of touch responses in SST neurons unaddressed. VIP neurons in the superficial layers of barrel cortex have also been studied in a similar behavioral context (Lee et al., 2013). Thus, we still know little about how GABAergic interneurons are recruited during active touch across cortical layers.
We recorded identified parvalbumin (PV)-expressing FS interneurons, SST interneurons, and VIP interneurons, representing about 82% of GABAergic interneurons (Rudy et al., 2011). The synaptic input and output organizations of these interneurons are cell-type-specific (Figure 1A). Thalamocortical inputs from VPM or the posterior medial nucleus (POM) make strong connections with FS interneurons in L4/5b/6 or L5a, respectively, with weak input to SST interneurons (Agmon and Connors, 1991; Audette et al., 2018; Beierlein et al., 2003; Bruno and Simons, 2002; Cruikshank et al., 2007, 2010; Gabernet et al., 2005; Gibson et al., 1999; Porter et al., 2001; Swadlow, 1995). Locally, FS and SST neurons both receive inputs from cortical excitatory (E) neurons (Beierlein et al., 2003; Jouhanneau et al., 2018; Koelbl et al., 2015; Pala and Petersen, 2015). FS interneurons inhibit nearby FS, E and SST neurons (Beierlein et al., 2003; Ma et al., 2012; Sun et al., 2006; Xu et al., 2013). SST neurons inhibit both E and FS neurons (Beierlein et al., 2003; Ma et al., 2012; Xu et al., 2013). VIP neurons, driven by long-range neuromodulatory and corticocortical inputs, preferentially inhibit SST neurons (Fu et al., 2014; Lee et al., 2013; Pfeffer et al., 2013; Pi et al., 2013).
Figure 1. Cell Type-Specific Recordings during Active Tactile Behavior.

(A) Left, coronal section through the barrel cortex with labeled VPM afferents (mCherry) in L4 and the border of L5 and L6. Right, connectivity of major interneuron classes with VPM inputs and local E neurons.
(B) Left, object localization task. Mice move their whiskers to palpate a pole which is presented in one of two locations. Right, whisker position (θ) and action potentials (AP) recorded during the object localization task. Gray bars, periods of touch between the whisker and the pole.
(C) Recordings from specific cell types. Cell types (excitatory, or E; fast-spiking, parvalbuminexpressing, or FS; somatostatin-expressing, or SST; vasoactive intestinal polypeptide-expressing, or VIP) were identified based on a combination of spike waveform, immunohistochemistry, and optogenetic tagging in transgenic mice. Cells no. 1–3 were from VIP-IRES-Cre x Ai32 mice and the brain slices were immunostained against PV. In this section both VIP and PV cells emitted green fluorescence, but fluorescence in VIP cells was membrane-bound (mbrn). For cells no. 5 and 6, ChR2-based tagging is illustrated. Blue, 5-ms laser stimulation. Cells were filled with neurobiotin (Nb) by in vivo juxtacellular methods after their behavior-relevant firing patterns were collected.
(D) Spike waveform parameters for different cell types. Peak-to-trough ratios larger than 10 are plotted as 10. The number in parentheses denotes cell number in each cell type.
(E) Laminar positions of neurons recovered histologically after recordings, and the corresponding recording depth (manipulator reading). The positions are normalized to the boundaries of the layers in which the cells were identified. Magenta lines denote 400 and 610 μm, corresponding to the boundaries for L4. The number of cells is listed for each type.
See also Figure S1.
We used channelrhodopsin (ChR2) photostimulation to home in on specific types of interneuron for recordings during active tactile behavior (Lima et al., 2009; Moore and Wehr, 2013; Muñoz et al., 2014; Yu et al., 2016). The whisker somatosensory system responds rapidly to sensory input. VPM neurons are activated by touch at a 2–3 millisecond latency and with submillisecond jitter (Petersen et al., 2008; Yu et al., 2016) and relay this information to L4 and L5b/6 within 1–2 milliseconds (Figure 1A). We tracked the propagation of touch-evoked signals from the VPM thalamus through different layers and cell types of the cortical circuit. In addition, we characterized the slower modulation of spike rate which correlates with bouts of task-related voluntary whisker movement (whisking). Our measurements thus link the synaptic organization of a canonical cortical circuit with cell type-specific functions during active tactile sensation.
RESULTS
Cell-Type-Specific Recordings in Behaving Mice
We recorded from barrel cortex neurons while head-restrained mice performed a whisker-dependent object-localization task. Mice licked for a reward when a pole was presented at a proximal location and withheld licking when the pole was presented at a distal location (Figure 1B). Whisker movements and the contacts between whisker and the pole were monitored using high-speed (1000 frames per s) videography (Clack et al., 2012; Hires et al., 2015; O’Connor et al., 2010a, 2013; Pammer et al., 2013; Yu et al., 2016). We performed single-cell juxtacellular recordings with glass pipettes, which provides unambiguous single-unit isolation (de Kock et al., 2007; O’Connor et al., 2010b; Yu et al., 2016) and labeling of recorded neurons (Pinault, 1996). In some experiments, we performed membrane-potential recordings in whole-cell mode (Yu et al., 2016).
We recorded from E neurons and three inhibitory interneuron classes: FS, SST, and VIP. E neurons (n = 153) had broad spike waveforms and a high peak-to-trough ratio (Figure 1C; cells 1, 2). We identified FS interneurons (n = 47) by their spike waveform (narrow peak-to-trough duration, low peak-to-trough ratio; Figures 1C and 1D). A subset of FS neurons (n = 3) was labeled by juxtacellular electroporation, and their identity was verified by immunohistochemistry against parvalbumin (Figure 1C; cells 3, 4). In our analysis we also included 30 additional FS neurons from a previous study, recorded in VGAT-ChR2 mice (thin-spike ChR2+ cells, n =22), PV-IRES-Cre mice (PV+ cells, n = 4), PV-ChR2 mice (ChR2+ cells, n = 1), and C57BL/6 mice (n = 3)(Yu et al., 2016). To detect SST (n = 89, including 14 whole-cell recordings) or VIP (n = 9) neurons, we selectively expressed ChR2 in either type by crossing SST-IRES-Cre or VIP-IRES-Cre mice (Taniguchi et al., 2011) with a ChR2 reporter line, Ai32 (Madisen et al., 2012), and exploited light-driven responses to identify these neurons (Figure 1C; cell 5, 6). A subset of SST and VIP neurons were labeled to verify their recording locations (Figures 1C and 1E).
Spike waveform parameters of SST neuron were intermediate between FS and E neurons, overlapping with both populations according to two waveform parameters: peak-to-trough duration and peak-to-trough ratio, highlighting the importance of optogenetic tagging (Figure 1D). Additional information about the spike waveform allowed us to refine classification further, and exclude a small number (n = 6) of “pseudo SST neurons”, which were likely FS neurons with off-target ChR2 expression (Figure S1), which has been documented in SST-IRES-Cre mice (Hu et al., 2013). VIP neurons had short spike durations but were distinguished from FS neurons by their high peak-to-trough ratios (Figure 1D). The subset of juxtacellularly labeled neurons (n = 45) helped us establish the correspondence between depth reading on our recording manipulator and laminar location of the recorded neurons (Figure 1E).
Responses Evoked by Active Touch
We first examined neural responses to whisker touch. Contacts between whisker and the object elicited action potentials in E, FS, and SST neurons in all layers (Figure 2). However, the response magnitudes (change in spike number within 50 ms after touch onset), response latencies (time from touch onset to half-height of the peak response, see Figure S2), and temporal dynamics differed across cell types and layers (Figure 3, Table 1). Touch-related input enters the barrel cortex via VPM, where neurons are driven by touch with short latencies (median, 2.6 ms; n = 29, Figures 3B and 3F) and low latency variability across cells (SD, 0.8 ms, n = 29, Figures 3B and 3H)(Yu et al., 2016). In the VPM thalamocortical recipient layers (L) of the barrel cortex (L4 and L5b/6), FS neurons responded with slightly longer latency (L4, 4.3 ms, n = 43; L5b/6, 5.6 ms, n = 15) and larger variability across cells (SD, L4, 1.8 ms; L5b/6, 2.5 ms). E neurons responded with still longer latency (L4, 7.8 ms, n = 61; L5b/6, 8.7 ms, n = 26) and latency variability (SD, L4, 5.1 ms; L5b/6, 5.4 ms). Stronger response magnitudes were seen in L5b/6 E (median, 0.8 spikes per touch, n = 30) neurons compared to L4 E neurons (0.1 spikes per touch, n = 95; p = 0.0054, Figure 3I) but the magnitudes were not different between L5b/6 FS (2.5 spikes per touch, n = 15) and L4 FS neurons (2.0 spikes per touch, n = 43; p = 0.21). Touch-related VPM input, therefore, enters the cortex to excite FS and E neurons in L4 and L5b/6 nearly simultaneously, consistent with previous reports with passive stimulation (Armstrong-James et al., 1992; Constantinople and Bruno, 2013; de Kock et al., 2007). In other layers, E and FS neurons responded with longer latencies than in L4 and L5b/6 (E: L2/3, 9.7 ms, n = 5, L5a, 10.3 ms, n = 16; FS: L2/3, 7.0 ms, n = 7, L5a, 7.1 ms, n = 7) and were thus likely excited by excitatory neurons in the same layers, neurons in L4 and L5b/6 via interlaminar excitatory pathways, or by a relayed pathway through the higher-order thalamus, POM (Groh et al., 2008).
Figure 2. Cell-Type-Specific Activity Aligned to Touch Onset.

Example recordings for different cell types (E, FS, SST, VIP), arrayed vertically. Layers are arrayed horizontally. Each neuron is represented by spike raster plots across ten trials (top), the peristimulus time histogram (PSTH; bin size, 1 ms) aligned to touch onset (bottom), and the spike waveform (inset). Dashed lines denote the touch onset.
See also Figure S2.
Figure 3. Touch-Evoked Spiking Responses Across Cell Types and Layers.

(A) Connectivity diagram.
(B) Response latency from touch onset for VPM neurons. Top, the size of each circle corresponds to the magnitude of the response (spikes per touch). Middle, touch latency. Bottom, peak-normalized PSTHs for all neurons. The number in parentheses denotes the number of VPM cells.
(C) Response latency from touch onset as a function of recording depth for excitatory (E) neurons. Top, the size of each circle corresponds to the magnitude of the response. Gray lines, 90% confidence interval for latency estimation for each cell. Magenta, 400, 610, and 700 μm representing the borders between L2/3 and L4, L4 and L5a, and L5a and L5b/6, respectively. Black lines, running median across cortical depth (calculated over 125 μm windows, in 50 μm steps). The number in parentheses denotes the number of cells in each layer. Bottom, peak-normalized PSTH for all neurons.
(D) Same as C, FS neurons.
(E) Same as C, SST neurons.
(F) Spike rate aligned to touch onset for different neuron types and cortical layers (grand average; shading indicates SEM). The color code and the cell number in each group is the same as in B-E.
(G) Same as F, peak-normalized.
(H) Response latency from touch onset for different neuron types and layers. VIP neurons did not respond to touch reliably and were not included. Boxplots follow the style of Tukey boxplot. Red, median; Bottom and top edges of the box, 25th and 75th percentiles, or q1 and q3; Whiskers, extreme data values within q1–1.5×(q3-q1) and q3+1.5×(q3-q1).
(I) Response magnitude for all cell types. More cells, including those whose latency could not be determined, are included for this plot.
(J) Grand-averaged PSTHs of E (n = 108), FS (n = 72), SST (n = 58), and VIP (n = 9) neurons.
See also Figures S3.
Table 1.
Touch-Evoked Responses and Whisking-Dependent Changes in Firing Rate
| L2/3 | L4 | L5a | L5b/6 | ||
|---|---|---|---|---|---|
| E | Touch latency (ms) | 9.2 ± 1.2, 9.7, 8.1 – 10.1, n = 5 | 9.4 ± 5.1, 7.8, 6.4 – 11.6, n = 61 | 10.8 ± 3.3, 10.3, 8.7 – 13.2, n = 16 | 10.6 ± 5.4, 8.7, 7.6 – 10.9, n = 26 |
| Touch magnitude (spikes/touch) | 0.7 ± 0.6, 0.5, 0.3 – 0.8, n = 5 | 0.2 ± 0.3, 0.1, 0.0 – 0.3, n = 95 | 0.5 ± 0.5, 0.4, 0.1 – 0.9, n = 23 | 0.8 ± 0.8, 0.8, 0.0 – 1.3, n = 30 | |
| Non-whisking (spikes/s) | 2.7 ± 3.7, 0.6, 0.5 – 4.5, n = 5 | 0.5 ± 0.8, 0.1, 0.0 – 0.7, n = 95 | 6.8 ± 5.2, 5.2, 2.7 – 11.2, n = 23 | 6.1 ± 6.9, 2.6, 0.4– 11.5, n = 30 | |
| Whisking (spikes/s) | 2.5 ± 3.9, 0.8, 0.7 – 3.2, n = 5 | 0.7 ± 1.2, 0.2, 0.0 – 0.7, n = 95 | 7.7 ± 6.2, 6.3, 3.1 – 10.6, n = 23 | 7.8 ± 10.6, 2.6, 0.5 – 10.0, n = 30 | |
| FS | Touch latency (ms) | 6.7 ± 1.8, 7.0, 5.0 – 7.7, n = 7 | 4.6 ± 1.8, 4.3, 3.6 – 4.8, n = 43 | 7.5 ± 2.9, 7.1, 5.4 – 9.7, n = 7 | 6.2 ± 2.5, 5.6, 4.2 – 8.0, n = 15 |
| Touch magnitude (spikes/touch) | 2.4 ± 1.8, 2.9, 0.6 – 4.1, n = 8 | 2.2 ± 1.0, 2.0, 1.5 – 3.1, n = 43 | 1.8 ± 1.3, 1.2, 0.8 – 2.5, n = 7 | 2.9 ± 1.6, 2.5, 1.7 – 3.6, n = 15 | |
| Non-whisking (spikes/s) | 13.8 ± 8.9, 11.7, 7.5 – 23.3, n = 8 | 10.2 ± 7.2, 7.8, 4.3 – 14.7, n = 43 | 7.5 ± 5.2, 7.6, 4.3 – 8.7, n = 7 | 16.9 ± 14.3, 17.2, 4.6 – 22.0, n = 15 | |
| Whisking (spikes/s) | 14.4 ± 11.9, 10.7, 6.8 – 19.3, n = 8 | 21.3 ± 14.6, 17.0, 10.0 – 34.0, n = 43 | 20.6 ± 32.7, 8.5, 4.9 – 17.2, n = 7 | 24.3 ± 11.7, 24.9, 14.2 – 33.8, n = 15 | |
| SST | Touch latency (ms) | 13.9 ± 4.1, 12.5, 11.0 – 16.0, n = 8 | 15.6 ± 4.1, 15.4, 12.4 – 17.2, n = 18 | 13.2 ± 3.8, 12.7, 11.6 – 13.7, n = 15 | 13.6 ± 3.6, 12.8, 11.5 – 14.3, n = 17 |
| Touch magnitude (spikes/touch) | 0.5 ± 0.6, 0.5, 0.2 – 0.7, n = 9 | 0.4 ± 0.4, 0.3, 0.1 – 0.6, n = 27 | 0.5 ± 0.6, 0.3, 0.1 – 0.6, n = 18 | 0.3 ± 0.4, 0.3, 0.0 – 0.6, n = 26 | |
| Non-whisking (spikes/s) | 2.6 ± 3.6, 0.4, 0.03 – 4.1, n = 9 | 2.6 ± 3.2, 0.6, 0.3 – 4.9, n = 27 | 2.8 ± 4.5, 0.8, 0.2 – 3.6, n = 18 | 3.9 ± 4.9, 1.7, 0.5 – 6.9, n = 26 | |
| Whisking (spikes/s) | 1.3 ± 1.7, 0.4, 0.03 – 2.1, n = 9 | 3.0 ± 3.4, 2.0, 0.4 – 4.2, n = 27 | 2.8 ± 5.4, 0.9, 0.2 – 2.6, n = 18 | 6.1 ± 7.5, 4.7, 2.0 – 8.1, n = 26 | |
| VIP | Touch magnitude (spikes/touch) | −0.2 ± 0.4, −0.02, −0.4 – 0.1, n = 9 | |||
| Non-whisking (spikes/s) | 14.6 ± 7.3, 11.1, 8.5 – 21.0, n = 9 | ||||
| Whisking (spikes/s) | 23.0 ± 13.2, 18.6, 14.7 – 33.4, n = 9 | ||||
• Values represent mean ± SD, median, 25th–75th percentiles, and cell number.
• Response magnitude is defined as the average number of spikes following touch onset (0 – 50 ms), after subtracting the baseline spike rate (twice the number of spikes during the 25 ms before the touch onset).
The spike rate of SST neurons in all cortical layers increased following touch, but with longer latencies than E or FS neurons (median, 13.2 ms, SD, 3.9 ms, n = 58, Figures 3E–3H, Table 1). In L4, their responses were further delayed by inhibition (median, 15.4 ms, SD, 4.1 ms, n = 18, Figures 3F and 3G). Across all cortical layers, touch elicited fewer spikes in SST neurons compared to FS neurons (Figures 3F and 3I, Table 1). In L4, for example, the response magnitude of SST neurons (median, 0.3 spikes per touch, n = 27, Figure 3I) was several-fold smaller than for FS neurons (2.0 spikes per touch, p < 10−7) but was larger than that of E neurons (0.1 spikes per touch, p = 0.02).
Since most VPM neurons only fired briefly after touch (Figures 3B, 3F and 3G) (Yu et al., 2016), the long latency of excitation suggests that SST neurons are driven by cortical E neurons and not VPM input. The E ➔ SST neuron synapse is weak but facilitating (Beierlein et al., 2003; Gibson et al., 1999; Pala and Petersen, 2015; Reyes et al., 1998). Facilitation by repetitive presynaptic spiking could occur as a result of repetitive touches. However, inter-touch-intervals (ITI) of successive touches were mostly too long for effective summation (median, 114 ms; the proportion of ITIs smaller than 25 ms, 2.1%; 82159 successive touches). Moreover, SST neurons were fired effectively by the first touch of a whisking bout (Figure S3), making repetitive touches unnecessary for driving SST neurons. Alternatively, it is possible that high-frequency (> 100 Hz) burst-like spiking, which was seen in a subset of E neurons (Figure S4), produces a rapidly facilitating depolarization in SST neurons, triggering spikes. We tested this possibility in brain slice experiments (Figure S4). High-frequency bursting of E neurons, with frequencies (200–400 Hz) matched to in vivo recordings, elicited a rapid build-up of membrane depolarization in connected SST neurons, reflecting both synaptic facilitation and postsynaptic charge summation (Figure S4). Additionally, the high connection probability of E ➔ SST (67% in our dataset of 36 tested L4 pairs) implies that simultaneous EPSPs from multiple presynaptic E cells will summate in single SST neurons.
To examine touch-evoked membrane potential dynamics in SST neurons, we made in vivo whole-cell recording from SST neurons in L4/5 and compared their touch-evoked membrane potential dynamics to those of L4/5 E and FS neurons. In L4, E and FS neurons both received short-latency excitatory input following touch (median, L4 E, 4.4 ms, n = 37, L4 FS, 4.1 ms, n = 7) (Yu et al., 2016). In L5, E neurons show a slightly delayed depolarization on average (median, 7.0 ms, n = 31) but a subset of neurons were depolarized with short latency (≤ 4.4 ms, 7 out of 31; e.g., cells 6 and 7 in Figure 4A), consistent with direct VPM input (Agmon and Connors, 1992; Constantinople and Bruno, 2013; Manns et al., 2004; Moore and Nelson, 1998; Petreanu et al., 2009; but see Zhu and Connors, 1999). L5 FS neuron responses had short-latencies (median, 3.8 ms, n = 5), virtually indistinguishable from L4 FS neurons. In contrast, touch-evoked depolarization was delayed in SST neurons (Figures 4G–4J). Responses divided into two types. One type (Figures 4G and 4H, cells 1–4) consisted of rapid hyperpolarization following touch, with an onset latency of 4 ms—the hyperpolarization was coincident with touch-evoked spiking of FS interneurons. Following inhibition, delayed excitation drove these neurons to fire spikes (latency > 7 ms, Figure 4I, cells 1 and 3). These responses were found in L4 and L5a. The second type (Figures 4G and 4H, cells 5–7), found in L5/6, showed a delayed excitatory input (latency, 8–10 ms), without transient inhibition. For both types, the timing of depolarization was consistent with the onset of touch-evoked spikes in local cortical E neurons. Excitation of SST neurons could have benefited from the short-term facilitation mechanism described above.
Figure 4. Touch Evoked Membrane Potential Dynamics: Comparing E, FS, and SST Neurons.

(A) The latency of intracellularly-recorded synaptic-potential depolarization after touch onset as a function of recording depth, excitatory (E) neurons. Each point is an individual neuron. Squares correspond to example responses shown in B and C. The number in parentheses denotes the number of cells in L4 or L5/6.
(B) Example responses of 7 example cells averaged across trials (seven cells, boxed in A). Arrow indicates the onset of synaptic-potential depolarization.
(C) Single membrane potential traces and spike histogram for 2 example cells. One of the trials is plotted in black and others in gray.
(D-F) Same as (A-C) for FS neurons.
(G-I) Same as (A-C) for SST neurons.
(J) Grand-averaged touch-evoked membrane potential response (z-scored) for E, FS, and SST neurons.
See also Figures S4.
Because of their sparsity and their relatively small size (Prönneke et al., 2015), only a small number of VIP interneurons were recorded (L2/3; n = 5; L4, n =3; L5, n = 1). VIP interneurons were poorly driven by touch (median, −0.02 spikes per touch, n = 9; Figures 2, 3I and 3J, Table 1). The grand mean PSTH showed little excitation and modest suppression by touch (Figure 3J), with a long latency (18 ms) and slow time-course, consistent with direct inhibition from SST neurons (Pfeffer et al., 2013).
Whisker Movement-Dependent Responses
Whisking can reflect alertness or purposive action to explore the environment. Whisking correlates with input from central sources, such as motor command or neuromodulation related to arousal, and peripheral sources, such as reafference (Campagner et al., 2016; Severson et al., 2017; Yu et al., 2016). Previous studies using untrained animals have focused on neural activity during the transition from quiet wakefulness to active wakefulness (whisking) (Gentet et al., 2010, 2012; Lee et al., 2013; Muñoz et al., 2017; Poulet et al., 2012). In our task, mice moved their whiskers in a goal-directed manner to localize an object (O’Connor et al., 2010b). Purposive whisker movement could modulate specific cell types and set the state of the cortical network prior to touch, which is a key component of active touch. We thus analyzed the modulation of various cell types by whisker movement (Figures 5, 6, and S5).
Figure 5. Cell Type-Specific Activity Aligned to Onset of Whisker Movement.

Example recordings for different cell types (E, FS, SST, VIP), arrayed vertically. Layers are arrayed horizontally. Each neuron is represented by the PSTH aligned to the onset of a whisking bout and the spike waveform (inset). Top, whisking amplitude.
Figure 6. Whisking-Evoked Responses Across Cell Types and Layers.

(A) Connectivity diagram.
(B) Top, modulation index for individual VPM neurons. The size of the marker corresponds to the spike rate, averaged between whisking and non-whisking periods. Bottom, averaged responses (z-scored) for individual neurons aligned to the start of whisking bouts.
(C) Top left, modulation index for E neurons as a function of recording depth. The size of the marker corresponds to the spike rate. Right, the proportion of neurons excited by whisking (solid line) and those inhibited by whisking (dashed line) calculated in running windows (125 μm window, 50 μm step). Error bar denotes standard error. Bottom, averaged responses (z-scored) for individual neurons aligned to the start of whisking bouts.
(D) Same as C for FS neurons.
(E) Same as C for SST neurons.
(F) Same as C for VIP neurons.
(G) Changes in spike rate with whisker movements for individual cells, arranged by cell types and layers. Pie charts, the fraction of cells that are excited (blue), inhibited (red), or show no change in spike rate (yellow) to whisking.
(H) Spike rate changes aligned to start of whisking bouts for VPM (n = 29), FS (L4 and L5b/6, whisking-excited, n = 47), SST (L4 and L5b/6, whisking-excited, n = 24, whisking-inhibited, n = 13), and VIP neurons (n = 9), plotted pairwise for ease of comparison. Cells excited by whisking are plotted separately from cells inhibited by whisking.
(I) Same as H with z-scored spike rate.
(J) Grand-averaged PSTHs of E (n = 153), FS (n = 73), SST (n = 80), and VIP (n = 9) neurons.
See also Figure S5.
VPM neurons are strongly excited by whisking (Figures 6B and S5A) (Yu et al., 2016). Barrel cortex E neurons were excited or inhibited by whisking, in roughly equal proportions throughout cortical layers (Figures 6C, 6G, 6J, and S5B). On average, the spike rate of E neurons did not change with whisking (Figure 6J, Table 1).
FS neurons across all cortical layers fired at a high rate under baseline conditions (i.e., mean spike rate during non-whisking period, 11.7 spikes per s, n = 73; Figures 6G and 6J, Table 1). As reported previously (Yu et al., 2016), a majority (81.4%) of L4 FS interneurons were driven by whisker movement (Figures 6D and S5B, Table 1). In L5b/6, a similar proportion (80.0%) of FS neurons showed increased spike rate to whisker movement. FS neurons in other layers (L5a, L2/3) did not show consistent responses to whisking. A significant fraction of L2/3 FS neurons (3/8, or 37.5%) was inhibited by whisking (Figures 5 and S5C, Table 1) (see also Gentet et al., 2010).
Compared to FS and VIP neurons (see below), SST neurons maintained a relatively low spontaneous spike rate (mean during non-whisking period, 3.1 spikes per s, n = 80; Figures 6G and 6J, Table 1). The spontaneous spike rate of SST neurons was comparable to that of E neurons (2.6 spikes per s, n = 153). SST interneurons exhibited diverse responses to whisking (Figures 5, 6E, and S5D). In L2/3, whisking reduced the spike rate of a majority of SST neurons (44.4%) and increased the rate of a smaller subset (22.2%). In L4 and L5a, SST neurons were inhibited (L4, 29.6%, L5a, 38.9%) or excited (L4, 40.7%, L5a, 50.0%) by whisking. In L5b/6, a majority of SST neurons (50.0%) showed a spike rate increase and a minority showed a decrease (19.2%). Following whisking onset, compared to VPM (latency to half-height, 27 ms) and FS (40 ms) neurons, the spike rate increase of SST neurons in the VPM thalamorecipient layers (L4 and L5b/6) was delayed (57 ms) (Figures 5, 6H and 6I). This slower response likely reflects cholinergic input acting through muscarinic acetylcholine receptors (Chen et al., 2015; Muñoz et al., 2017; Xu et al., 2013).
VIP neurons fired at a high spike rate spontaneously (mean during non-whisking period, 14.6 spikes per s, n = 9; Figures 6G and 6J, Table 1). A majority of them (66.7%) also elevated their spike rate during whisking (Figures 6F, 6G, and S5E). The lack of touch-driven activity in VIP neurons argues that whisking drives these neurons by cholinergic input acting on nicotinic receptors (Fu et al., 2014) or long-range excitatory input from the motor cortex (Lee et al., 2013). In spite of different underlying mechanisms, VIP and FS neurons increased their firing rates with similar dynamics during whisking (Figures 6H–6I).
Cell-Type-Specific Disinhibition by VIP Interneurons
VIP neurons mainly target SST neurons, and to a lesser extent, FS neurons (Hioki et al., 2013; Lee et al., 2013; Pfeffer et al., 2013). It is difficult to predict how the activation of VIP neuron, for example, during whisking, influences the activity of FS and E neurons. Although activation of VIP interneuron can produce disinhibition in the cortical circuits (Lee et al., 2013; Pi et al., 2013), this has not been shown directly in the barrel cortex in vivo and the laminar specificity is unknown. Thus, we optogenetically stimulated VIP neurons while measuring the activity of FS, E, and putative SST neurons.
We expressed ChR2 in VIP interneurons and applied high-frequency (5 ms pulses at 50 Hz) photostimuli to increase the spike rate of VIP neurons. Long (3 seconds) photostimuli produced tonic inhibition of putative SST neurons in L4/5 (Figures S6 and 7C). VIP neuron stimulation activated L2/3 (100%), L4 (70%) and L5/6 (50%) FS neurons, in particular at the beginning of stimulation (0–170 ms from the laser onset). Photostimulating VIP interneurons increased the spike rate of L5/6 E neurons preferentially, with little effect on L2/3 and L4 E neurons (Figures 7A–7C). These results suggest that VIP neurons activation during whisking produces a cell-type- and layer-specific effect at a slow time-scale (> 100 ms).
Figure 7. Activation of VIP Neurons Causes Cell Type-Specific Disinhibition and Inhibition.

(A) Examples of responses of E and FS neurons to photostimulation of VIP neurons. Top, spike waveforms. Middle, spike raster plots. Blue shading, time of photostimulation. Bottom, spike rate under control condition (black) and with VIP photostimulation (blue). Activity is aligned to the beginning of behavioral trials. Note that the modulation under the control condition (black tick marks and traces) was caused by the behavior (e.g., touch).
(B) Grand-averages of the spike rate changes (stim-control, z-scored) of E (L2/3, n = 10; L4, n = 13; L5/6, n = 22) and FS (L2/3, n = 3; L4, n = 10; L5/6, n = 10) neurons in response to VIP neuron stimulation, sorted by their layers.
(C) Effects of VIP photostimulation on neurons in different layers. Put., putative.
(D) Responses of VIP neurons to single laser pulses (n = 9).
(E) Spike rate changes (z-scored) of E and FS neurons to VIP stimulation, aligned to single laser pulses.
See also Figure S6.
Using short laser pulses further allows us to examine the effect of pulse-locked activation of VIP neurons on the activity of E and FS neurons at a fast time-scale (< 10 ms). Single laser pulses triggered a brief increase of spike rate (2–5 ms latency after photostimualtion onset) in VIP neurons (Figures 7D, see cell no. 6 in Figure 1C). We analyzed the spike rate modulation in E and FS neurons locked to individual laser pulses to uncover direct inhibition from VIP neurons. Each laser pulse reduced the spike rate of L5/6 FS interneurons at a short onset latency (3 ms), revealing selective monosynaptic inhibition of L5/6 FS interneurons (z score at 5.5 ms, −7.8 ± 1.6, mean ± SD, p = 0.002, n = 10; Figure 7E). L4 FS neurons were also inhibited by VIP neurons directly, but with a relatively smaller magnitude (−2.0 ± 0.6, p = 0.014, n = 10). In contrast, E neurons in all layers showed virtually no direct inhibitory response to single VIP pulses (−0.5 ± 0.21, p = 0.75, n = 45), demonstrating a lack of direct inhibition from VIP to E neurons. The strong direct inhibition from VIP interneurons is likely the cause that, in a subset of L5/6 FS cells (30%), the firing rate was suppressed by prolonged VIP activation. Presumably, in this subset, direct VIP ➔ FS inhibition overpowered the indirect disinhibitory effect via the VIP ➔ SST ➔ FS pathway, an effect that dominated and caused increased FS firing in other layers. Future work in brain slices is needed to resolve the details of layer-specific coupling between VIP and FS neurons.
DISCUSSION
Active tactile sensation recruits GABAergic interneurons in a behavior-relevant and cell-type-specific manner, preparing the cortical network for touch and regulating the propagation of touch-evoked signals. Our data reveal rules governing the recruitment of major types of GABAergic interneurons in the somatosensory cortex: The activity of FS neurons resembled thalamic input, whereas SST neuron activity followed activity of cortical excitatory neurons. VIP neurons were barely excited by touch but were highly active spontaneously and were further driven by non-sensory signals concomitant with whisker movements. These observations suggest dedicated functions for each type of interneuron during active tactile sensation.
FS neurons track thalamic input
The responses of FS interneurons to active touch are similar to those evoked by passive stimulation, with short response latency, high response magnitude, and low selectivity (Simons, 1978; Simons and Carvell, 1989; Swadlow, 1989). In our experiments, where mice moved their whiskers to search for objects, we found that FS neurons in the VPM target layers (L4 and L5b/6) were also activated by whisker movements, matching the dynamics of VPM input (Yu et al., 2016). FS interneurons in these layers filter inputs from VPM by creating a “window of opportunity” that suppresses the relatively slow movement-associated reafferent activity, but allows excitatory neurons to respond to synchronous input related to touch (Cruikshank et al., 2007; Gabernet et al., 2005; Simons and Carvell, 1989; Wilent and Contreras, 2005; Yu et al., 2016). Note, however, that the onset latency span of touch-evoked activity in L5b/6 FS neurons is larger than that of L4 FS neurons (Figure 3H), suggesting that there could be substantially wider “window of opportunity” for some L5b/6 E neurons, which may in part explain their stronger touch-evoked responses (Figure 3I) (cf. Sempere-Ferràndez et al., 2019). FS neurons in L5a, which is innervated by POM (Audette et al., 2018; Lu and Lin, 1993), were not consistently driven by whisker movement, reflecting the weak representation of whisker movement in POM (Masri et al., 2008; Moore et al., 2015; Urbain et al., 2015). In L5, FS neurons also receive inputs from L4 E neurons (Pluta et al., 2015). Thus, touch-evoked response of L5 FS neurons could partially derive from L4 E neurons, especially at a later phase. In L2/3, compared to L4, FS interneurons were not consistently excited by whisking and showed delayed activation after touch, consistent with their activation by local excitatory inputs (Jouhanneau et al., 2018; Pala and Petersen, 2015) and ascending input from L4 or L5 (Dantzker and Callaway, 2000; Helmstaedter et al., 2008).
VIP interneurons modulate the spike rate of FS neurons in all cortical layers through disinhibition (Figure 7). VIP neurons have high spontaneous activity during behavior. Further increases of spike rate in VIP interneurons during whisking could cause an increase of activity in FS neurons through inhibiting SST neurons. The recruitment of the VIP ➔ SST ➔ FS pathway is likely independent of sensory input (see below). Thus, the spike rate of FS neurons in all cortical layers is modulated by top-down inputs via VIP interneurons in addition to bottom-up inputs from the thalamus.
Delayed touch-evoked excitation of SST interneurons
SST neurons receive little thalamic input (Audette et al., 2018; Beierlein et al., 2003; Cruikshank et al., 2010) but dense and facilitating intracortical inputs (Beierlein et al., 2003; Ma et al., 2012; Naka et al., 2019; Pala and Petersen, 2015). A previous report, probing superficial SST neurons using two-photonguided patching, found touch-evoked suppression (Gentet et al., 2012). In contrast, we found robust touch-evoked excitation of SST neurons across multiple layers. The discrepancy between ours and previous work may be attributable to layer- or subtype-specific properties of SST neurons. Previous work used GIN mice, in which only a subset of SST neurons in the barrel cortex express GFP (Ma et al., 2006), and recorded presumably from the upper portion of L2/3 (Gentet et al., 2012). Our experiments are instead based on the Cre-mediated expression of ChR2 in SST-IRES-Cre mice (Taniguchi et al., 2011). Touch-evoked excitation was found in SST neurons across multiple layers, but our dataset does not include the upper portion of L2/3 (< 200 μm), where SST neurons are rare.
Touch-evoked responses in SST neurons had longer latencies than E and FS neurons (Figure 3H). SST neurons thus monitor the activity of local E neurons and provide feedback inhibition. It is known that the inhibitory inputs from SST to E neurons show short-term facilitation (Beierlein et al., 2003; Ma et al., 2012; Pala and Petersen, 2015), as opposed to short-term depression seen in FS to E connections. Thus, the sources of inhibitory input to E neurons likely shift from FS to SST neurons following the onset of touch. Touch-evoked responses in SST neurons can shorten the durations of touch responses in E and FS neurons. The discovery of additional sources of inhibition with specific temporal and functional features can help refine previous biophysical models of the barrel cortex microcircuits (Gutnisky et al., 2017). Delayed responses of SST neurons have also been reported in the visual and auditory cortex (Li et al., 2015; Ma et al., 2010), suggesting their universal role in shaping the time-course of sensory responses across modalities.
SST neurons are also modulated by cholinergic input (Chen et al., 2015; Muñoz et al., 2017; Xu et al., 2013) and inhibition from other types of interneurons, including FS and VIP neurons (Ma et al., 2012; Muñoz et al., 2017; Pfeffer et al., 2013). Behavior thus modulates the spike rate of SST neurons through the combined effect of these different pathways. In contrast to a previous report (Muñoz et al., 2017), which found that L4 SST neurons increase their spike rate by whisking, we found a substantial proportion (30%) of L4 SST neurons were inhibited by whisking (Figure 6G). This difference is likely related to the behavioral state of mice: In our task, animals were consistently engaged in an active tactile task, where the FS neuron network is activated by whisking, exerting stronger inhibition onto SST neurons. In addition, the absolute change in cholinergic input during whisking, which is responsible for whisking-elicited activation of L4 SST neurons (Muñoz et al., 2017), is likely different between our condition and that in Muñoz et al. In our case the goal-directed operant task likely required a sustained level of cholinergic input to cortex (Pepeu and Giovannini, 2004) and a further increase of cholinergic input due to whisking may be limited.
VIP interneurons modulate the spike rate of cortical circuits
VIP interneurons were spontaneously active at a high rate during behavior, even in the absence of touch and whisking (Figure 6G and 6J, Table 1). Whisking further increased the spike rate of a majority of VIP interneurons. The high baseline spike rate implies that the membrane potential of VIP interneurons hovered around the spike threshold; nevertheless, touch did not drive these neurons appreciably. Some VIP neurons were actually suppressed by touch with a latency that matched the activation of SST neurons (Figures 3IE and 3J). VIP interneurons receive weak excitatory input from the thalamus (Lee et al., 2010; Staiger et al., 1996) and cortical E neurons (Sohn et al., 2016; Staiger et al., 2002). VIP neurons also receive inhibitory input from both FS and SST neurons (Pfeffer et al., 2013; Sohn et al., 2016; Staiger et al., 1997). Thus, the effective reversal potential caused by touch, which is a combination of both excitatory and inhibitory inputs (Crochet et al., 2011), is perhaps close to the baseline membrane potential of VIP neurons. Therefore, active touch is unable to increase the spike rate of VIP neurons further. With passive whisker deflection, touch increases the spike rate of VIP neurons in the upper portion of L2/3 (Sachidhanandam et al., 2016), likely because the spike rate and membrane potential are not already elevated by whisking. A previous study in the auditory cortex has also noted that behavioral engagement reduces the sensory responses of VIP neurons (Kuchibhotla et al., 2017).
VIP neuron activation disinhibited E and FS neurons in the barrel cortex, likely via inhibition of SST neurons (Figures 7 and S6) (Jackson et al., 2016; Lee et al., 2013; Pi et al., 2013). Thus, the high spike rate of VIP neurons constitutively suppresses SST neurons and reduces inhibition in the circuit. We observed strong layer-dependent effects of VIP neuron activation: E neurons in L5/6, not L2–4, increased their spike rate in response to VIP neuron stimulation. The majority of FS neurons in all layers were disinhibited by VIP neuron activation, but direct inhibition from VIP to FS neurons also existed and was more prevalent for L5/6 FS neurons (Dávid et al., 2007; Hioki et al., 2013). Layer-specific effects of VIP neuron activation constrain computational modeling (Litwin-Kumar et al., 2016).
Conclusion and Outlook
We have identified rules governing the recruitment of GABAergic inhibition during an active tactile behavior, revealing distinct functions and temporal dynamics for three major interneuron types. Our study highlights the importance of cell-type-specific electrophysiology as a critical tool for unraveling functional relationships between neural activity and behavior at fine time-scales. Our data constrain computational models of cortical circuits and pave the way for future investigations of cortical circuits underlying tactile behavior. Finally, molecular studies suggest up to 60 GABAergic cell types, including several subclasses of FS (PV), SST, and VIP neurons (Tasic et al., 2018). Detailed electrophysiological analysis like the one presented here, together with molecular characterization, will reveal which of these molecular types actually correspond to functionally-distinct cell types.
STAR * METHODS
LEAD CONTACT AND MATERIALS AVALABILITY
Further information and requests for reagents and data should be directed to the Lead Contact, Jianing Yu (jianing.yu@pku.edu.cn).
METHOD DETAILS
Animals
All procedures were in accordance with protocols approved by the Janelia Research Campus Institutional Animal Care and Use Committee. We crossed SST-IRES-Cre (JAX #013044) and Ai32 (JAX #012569) mice for targeted recording of SST neurons and crossed VIP-IRES-Cre (JAX #010908) and Ai32 mice for targeted recording of VIP neurons. We also included data from a previous publication (Yu et al., 2016), in which these mouse strains were used for targeted recordings of GABAergic neurons: VGAT-ChR2-EYFP (JAX #014548), PV-IRES-Cre (JAX #017320), and PV-ChR2 (JAX #012355).
Behavioral task and training
Mice (2–6 months old of both sexes) were implanted with a custom-made titanium head bar (11524, Flintbox). After 2–7 days of recovery, they were placed under water- or food-restriction schedule. Method of water restriction has been described previously (Guo et al., 2014b). For food restriction (DOI: dx.doi.org/10.17504/protocols.io.x9nfr5e), mice were provided with 3 g of food pellets (3.43 kcal/g, PicoLab Rodent Diet 20 5053) daily and were allowed to drink water ad lib. Weight was maintained at above 85% of ad lib fed mice. During behavioral training, Similac Advance Infant Formula (0.64 kcal/ml) was used as the reward, delivered through a peristaltic pump (P720, Instech Laboratories, Inc., PA), at a rate of 7 μl per reward. Since mice can consume up to 4 ml of infant formula but only 1 ml of water during a behavioral session, using infant formula prolonged the length of a behavioral session by more than 2 folds (>1200 trials per session). After the behavioral session, mice were supplemented with food pellets to meet their total daily calorie need of 10 kcal.
Mice were trained on a whisker-based go/nogo task (O’Connor et al., 2010a; Yu et al., 2016). A 0.5-mm diameter pole (class ZZ gage pin, Vermont Gage) was presented in an anterior location or one of several posterior locations. Mice were trained to lick an electrical lickport to receive rewards when the pole was in one of the posterior locations and withhold licking when the pole was in the anterior position. Trials were randomized and no more than 3 trials of the same types were presented in succession. All but 1–3 whiskers of C or D row were trimmed to facilitate whisker tracking. Recordings were targeted in the whisker somatosensory cortical regions of the spared whiskers, determined by transcranial intrinsic signal imaging before the recording sessions (Masino et al., 1993).
Whiskers were tracked with a Basler A504k camera using a telecentric lens (Edmund Optics) and 940-nm illumination (Roithner Laser). For each trial, 5 seconds of whisker movement were captured at 1000 fps with 100–150 μs exposure time, using Streampix 3 or 6 software (Norpix). Whisker trajectories and contacts between the whiskers and the pole were quantified using the Janelia Whisker Tracker (Clack et al., 2012) and custom-made scripts in MATLAB (MathWorks).
Neural recordings: In vivo juxtacellular recording
Detailed protocols (DOI: dx.doi.org/10.17504/protocols.io.wwkffcw) can be found at www.protocols.io (See also Yu et al., 2016). On the day of recording, small (200 μm-diameter) craniotomy was made in the targeted cortical region following a published method (Pinault, 2005). The dura was left intact in most cases. After surgery, the craniotomy was covered with a small drop of 1.5% agarose dissolved in a “cortex buffer” solution (in mM, NaCl 125, KCl 5, dextrose 10, HEPES 10, CaCl2 2, MgSO4 2, 272 mOsm, pH 7.4), followed by Kwik Cast (WPI) filling the entire recording chamber. Animals were allowed to recover on a warm blanket (37°C) for at least two hours before the recording session started.
For juxtacellular recording, long-shank borosilicate pipettes (1.50 mm OD/0.86 mm ID, Sutter Instruments, CA) were filled with electrolytes such as Ringer’s solution (in mM, NaCl 135, KCl 5.4, HEPES 5, CaCl2 1.8, MgCl2 1, 294 mOsm, pH 7.3) or 0.5 M NaCl, with 2% Neurobiotin (Vector Laboratories). The cortex was penetrated with a normal angle. The manipulator was zeroed when the pipette tip touched the surface of the brain, which often resulted in an increase in pipette resistance. To search for spikes from single cells, the appearance of spontaneous spikes or an increase in pipette resistance was monitored. To target ChR2-expressing neurons brief (5 ms) laser pulses (peak power, 2–5 mW) were delivered at low frequency (5 Hz, 3 seconds out of every 10 seconds). Laser-evoked spikes were monitored with an oscilloscope, triggered on the laser onset. ChR2-expressing neurons usually fired 1–2 ms after laser onset and were readily identifiable. During the searching process, drops of rewards were delivered at a rate of 7 μl per minute to keep the animals alert. The behavioral program was initiated once the desired neuron was found. The neural signal was amplified (Multiclamp 700B, Molecular Devices) and digitized at 10 kHz or 20 kHz, controlled by Ephus (Suter et al., 2010) or Wavesurfer (http://wavesurfer.janelia.org).
After the recording was complete, to fill the recorded cells, 1–10 nA positive current (50% duty cycle, 2 Hz) was injected to entrain the spikes of the recorded cell (Pinault, 1996). The evoked firing and recording noise were closely monitored. The current amplitude was adjusted online to avoid damage to the cell. After 5–15 minutes of juxtacellular filling, the animal was killed within 2 hours on the same day, or within 24 hours on the second day. Not more than one cell was labeled within 200 μm in the dorsal-ventral axis and 70 μm in the anterior-posterior or medial-lateral axis.
Neural recordings: In vivo whole-cell recording
Whole-cell patch pipettes (6–9 MΩ) were filled with an internal solution (in mM, K-gluconate 135, KCl 4, HEPES 10, EGTA 0.5, Na2-phosphocreatine 10, Mg-ATP 4, and Na2-GTP 0.4, 292–300 mOsm, pH 7.3; or K-gluconate 125, KCl 7, HEPES 10, EGTA 0.5, Na2-phosphocreatine 10, Mg-ATP 4, and Na2-GTP 0.4, 292–300 mOsm, pH 7.3) with 0.4% Neurobiotin. The signal was amplified (Multiclamp 700B, Molecular Devices) and digitized at 10 kHz or 20 kHz, controlled by Ephus (Suter et al., 2010) or Wavesurfer (http://wavesurfer.janelia.org). For ChR2-guided whole-cell recording, the presence of laser-evoked spikes was examined in every instance when the pipette tip contacted a cell. If there were laser-evoked spikes, gigaseal and whole-cell configuration were established. Otherwise, the ChR2- cells were cleared with the ‘Buzz’ function (100 μs) in Multiclamp 700B.
Neural recordings: Ex-vivo paired whole-cell recordings
Coronal brain slices of the somatosensory (S1) cortex were prepared as previously described (Ma et al., 2012), from 2.5–4 weeks old mice of both sexes. Most animals were of the X94 transgenic line (Ma et al., 2006) (JAX #006334) in which about half of all L4–5 SST interneurons express GFP. Some experiments used progeny of the SST-IRES-Cre line (JAX #013044) crossed with the Ai9 tdTomato reporter (JAX #007909) (Madisen et al., 2010). Dual whole-cell recordings were performed from pairs of neighboring L4 excitatory neurons and SST interneurons; SST interneurons were targeted by their fluorescence, excitatory neurons by their soma shape, and the identity of both cell types was verified post-hoc by their characteristic firing patterns and membrane parameters (Hu and Agmon, 2016). High-frequency (200 and 400 Hz) spike trains were triggered in the excitatory neuron by brief (1 ms) current steps and trains of evoked unitary EPSPs (uEPSPs) were recorded from the postsynaptic interneuron, from a holding potential of about −70 mV (uncorrected for pipette junction potential). A total of 36 pairs were tested, 24 of which (67%) were synaptically connected in the E ➔ SST direction, including 15 (42%) connected bidirectionally. For analysis, we selected 10 pairs with an E ➔ SST connection tested at both 200 and 400 Hz and with at least one uEPSP >0.5 mV. Measurements were done on averages of (typically) 10–15 trials repeated at 8 s intervals.
Optogenetic stimulation
The recording site (craniotomy) was photostimulated with a 473-nm laser (CL-473–150, Crystal Laser). The laser was gated by a shutter (Vincent Associates) and an acousto-optical modulator (AOM; MTS110-A3-VIS, Quanta Tech) and was focused on the craniotomy (beam diameter, 1.4 mm 99.9% energy or 4 × s.d.). Light pulses (5 ms) were delivered at either 5 Hz (for optogenetic tagging) or 50 Hz (for VIP neurons stimulation) with a maximal power of 5 mW.
Histology
Detailed protocols (DOI: dx.doi.org/10.17504/protocols.io.wa4fagw) on biocytin/neurobiotin staining and immunohistochemical staining of neurochemical markers such as parvalbumin can be found on procotol.io. Following the final recording session, mice were deeply anesthetized with isoflurane and perfused with 0.1 M phosphate buffer followed by 4% paraformaldehyde (PFA, in 0.1 M phosphate buffer, pH 7.4). The brain was immersed in fixative for at least 24 hours before sectioning. Cortical slices (100 μm) were collected from the areas surrounding the recording sites. To reveal biocytin/neurobiotin, brain slices were reacted overnight with 1:100 Streptavidin, Alexa Fluor 594 conjugate (1 mg/ml, S11227, Thermo Fisher Scientific) in a PBS solution containing 2% Triton X-100 (X100–1L, Sigma Aldrich), 20% DMSO (BP231–1, Fisher Scientific), and 4% Bovine Serum Albumin (B4287–5G, Sigma Aldrich). To detect neurochemical markers, immunohistochemical staining was performed with the primary antibody against parvalbumin (mouse, PV235, Swant) for 4–7 days at room temperature in above PBS solution, followed by secondary antibody staining using Alexa Fluor conjugates (Thermo Fisher Scientific) at room temperature for 4–7 days. Slices were air-dried and mounted on slides with Vectashield (H-1200 or H1000, Vector Laboratories). DAPI or Neurotrace 435/455 (Thermo Fisher Scientific) was included for nucleus staining when applicable. Cells were examined with a confocal microscope, using 20× or 60× objectives (Zeiss 880). Laminar boundaries were determined by inspecting DAPI, NeuN, PV, or auto-fluorescent signals.
QUANTIFICATION AND STATISTICAL ANALYSIS
Spike sorting and waveform analysis
Spike waveforms were identified by amplitude thresholding, resampled to 40 kHz, and aligned by their peak. Putative waveforms were then subjected to principal component analysis (PCA) analysis and non-spike events (e.g., those associated with licking artifacts) were deleted. Putative spikes were inspected again, and additional non-spike events were deleted. To control for drift, only spikes whose peak-to-trough duration fell between 25th to 75th percentiles of all spikes from that cell were included for spike waveform analysis. These spike waveforms were then averaged for each cell and peak-normalized. The peak-to-trough duration (Figure 1) was defined as the time from the first peak to the first trough after the peak. The peak-to-trough ratio was defined as the ratio of the absolute values of peak and trough.
To examine the spike waveforms further (Figure S1), additional spike parameters were analyzed. Spike rise time was defined as the time from 25% of the peak, to the peak. Rising slope modulation was defined as . These two parameters separated quasi-FS SST neurons from PV/FS neurons that expressed Cre transiently during development in SST-IRES-Cre mice (pseudo-SST)(Hu et al., 2013). Pseudo-SST neurons showed functional properties (e.g., response latency to touch) similar to FS neurons.
Whisking analysis
The whisker angle was band-pass filtered between 6–60 Hz with a Butterworth filter (4th order) and decomposed using the Hilbert transform. Phase ± π corresponds to the most retracted whisker location and phase 0 corresponds to the most protracted whisker location. Whisking epochs were defined as whisking cycles when the whisking amplitudes at phase 0 exceeded 2.5°. Non-whisking periods were defined as periods of at least 100 ms with negligible whisker movement (amplitude <1.25°), in the absence of touch or licking. Average spike rates during non-whisking (SRnon-whisking) and whisking (SRwhisking) periods were estimated from extracted non-whisking or whisking epochs. For individual cells, the statistical significance in whisking-induced modulation was evaluated by the Wilcoxon rank sum test (Figure 6G, pie chart). Whisking-induced modulation of spike rate was quantified by modulation index (Figure 6B–F): . Transitions from non-whisking to whisking (e.g., Fig. 5 and 6) were defined as the end of a non-whisking epoch followed by a period in which the average whisking amplitude increased by least 2° and no touch occurred within 250 ms. If touch occurred after 250 ms, the data after touch were removed (replaced by NaN).
Spike rate was aligned to the whisking onset to build peri-stimulus time histograms using 10-ms bins (PSTH) (Figure 5). To normalize whisking-aligned PSTH, the baseline spike rate (from −200 to −50 ms before whisking onset) was subtracted from the PSTH. The baseline-subtracted PSTH was then normalized by the standard deviation of the entire PSTH (−200 to 400 ms from whisking onset). The z-scored PSTH was then smoothed with a Gaussian kernel using the “smooth” function in MATLAB (5-point moving average).
Touch analysis: response amplitude and latency
The onsets and offsets of touches were curated manually by custom-made MATLAB scripts. Touches were not included if their inter-touch-intervals (time between the offset of the previous touch and the onset of the current touch) were less than 25 ms. Passive touches, when the pole directly struck a resting whisker, were not included. Otherwise, all touches, including protraction- and retraction-induced touches, were included for analysis. Spike rate was aligned to the touch onset to build a PSTH using 1-ms bins (PSTH) (Figure 2). The touch-evoked response magnitude was defined as the average spike number between 0–50 ms after touch onset, with expected spike number from baseline activity subtracted (2 × average spike number between −25 – 0 ms relative to the touch onset).
To determine the latency of spike increase after touch, spike times were convolved with a Gaussian kernel (1-ms width) to derive a spike density function (SDF, Figure S2), which were then averaged across trials (Nawrot et al., 1999). The peak response was defined as the maximal spike rate after touch onset (0–50 ms). Response latency was defined as the first time when the averaged SDF crossed the half-height of the peak response. If the peak response did not exceed 2.5 × SD of the baseline activity (estimated from −25 ms to touch onset), the cell was excluded from latency analysis. To control reliability, bootstrap analysis (2000 resampling) was carried out. A 90% confidence interval was calculated from the bootstrap estimates for each cell and was plotted in Figures 3C–3E. Cells were excluded for latency analysis if the 90% confidence interval of their latency estimation was larger than 15 ms.
Membrane-potential (Vm) latency (Figure 4) was defined as the time from touch onset to the time when dVm/dt crossed the baseline (3 × SD of the dVm/dt between 0 and 25 ms before touch). For SST neurons, since a sharp touch-evoked depolarization was not observed, the latency was manually measured from touch onset to the onset of membrane-potential depolarization.
Statistical analysis
Statistical comparisons were performed using the Wilcoxon rank sum test (unpaired). All statistical analyses were performed in MATLAB (MathWorks).
DATA AND CODE AVAILABILITY
The data generated during this study are available in NWB2.0 format (https://neurodatawithoutborders.github.io/) at figshare.org (DOI: 10.25378/janelia.8869115)
Supplementary Material
Highlights.
Spike recordings of cortical E, FS, SST, and VIP neurons during active touch
Whisking and touch activate FS neurons in the VPM thalamorecipient layers
Touch activates SST neurons with a delay
VIP neurons are excited during whisking
ACKNOWLEDGMENTS
VPM data were collected by Diego Gutnisky (Gutnisky et al., 2017; Yu et al., 2016). We thank Tina Pluntke for assistance in developing food restriction protocol and animal training. We thank Lupeng Wang for his advice on food restriction. This work was funded by Howard Hughes Medical Institute and Grant NS050437 from the National Institutes of Health (to A.A.).
Footnotes
DECLARATION OF INTERESTS
The authors declare no competing interests.
Publisher's Disclaimer: This is a PDF file of an unedited manuscript that has been accepted for publication. As a service to our customers we are providing this early version of the manuscript. The manuscript will undergo copyediting, typesetting, and review of the resulting proof before it is published in its final citable form. Please note that during the production process errors may be discovered which could affect the content, and all legal disclaimers that apply to the journal pertain.
REFERENCES
- Agmon A, and Connors BW (1991). Thalamocortical responses of mouse somatosensory (barrel) cortexin vitro. Neuroscience 41, 365–379. [DOI] [PubMed] [Google Scholar]
- Agmon A, and Connors BW (1992). Correlation between intrinsic firing patterns and thalamocortical synaptic responses of neurons in mouse barrel cortex. J. Neurosci 12, 319–329. [DOI] [PMC free article] [PubMed] [Google Scholar]
- Armstrong-James M, Fox K, and Das-Gupta A (1992). Flow of excitation within rat barrel cortex on striking a single vibrissa. J. Neurophysiol 68, 1345–1358. [DOI] [PubMed] [Google Scholar]
- Audette NJ, Urban-Ciecko J, Matsushita M, and Barth AL (2018). Pom thalamocortical input drives layer-specific microcircuits in somatosensory cortex. Cereb. Cortex 28, 1312–1328. [DOI] [PMC free article] [PubMed] [Google Scholar]
- Beierlein M, Gibson JR, and Connors BW (2003). Two dynamically distinct inhibitory networks in layer 4 of the neocortex. J. Neurophysiol 90, 2987–3000. [DOI] [PubMed] [Google Scholar]
- Brecht M, and Sakmann B (2002). Dynamic representation of whisker deflection by synaptic potentials in spiny stellate and pyramidal cells in the barrels and septa of layer 4 rat somatosensory cortex. J. Physiol 543, 49–70. [DOI] [PMC free article] [PubMed] [Google Scholar]
- Brecht M, Roth A, and Sakmann B (2003). Dynamic receptive fields of reconstructed pyramidal cells in layers 3 and 2 of rat somatosensory barrel cortex. J. Physiol 553, 243–265. [DOI] [PMC free article] [PubMed] [Google Scholar]
- Bruno RM, and Simons DJ (2002). Feedforward mechanisms of excitatory and inhibitory cortical receptive fields. J. Neurosci 22, 10966–10975. [DOI] [PMC free article] [PubMed] [Google Scholar]
- Bureau I, von Saint Paul F, and Svoboda K (2006). Interdigitated paralemniscal and lemniscal pathways in the mouse barrel cortex. PLoS Biol. 4, e382. [DOI] [PMC free article] [PubMed] [Google Scholar]
- Campagner D, Evans MH, Bale MR, Erskine A, and Petersen RS (2016). Prediction of primary somatosensory neuron activity during active tactile exploration. ELife 5. [DOI] [PMC free article] [PubMed] [Google Scholar]
- Chen N, Sugihara H, and Sur M (2015). An acetylcholine-activated microcircuit drives temporal dynamics of cortical activity. Nat. Neurosci 18, 892–902. [DOI] [PMC free article] [PubMed] [Google Scholar]
- Clack NG, O’Connor DH, Huber D, Petreanu L, Hires A, Peron S, Svoboda K, and Myers EW (2012). Automated tracking of whiskers in videos of head fixed rodents. PLoS Comput. Biol 8, e1002591. [DOI] [PMC free article] [PubMed] [Google Scholar]
- Constantinople CM, and Bruno RM (2013). Deep cortical layers are activated directly by thalamus. Science 340, 1591–1594. [DOI] [PMC free article] [PubMed] [Google Scholar]
- Crochet S, Poulet JFA, Kremer Y, and Petersen CCH (2011). Synaptic mechanisms underlying sparse coding of active touch. Neuron 69, 1160–1175. [DOI] [PubMed] [Google Scholar]
- Cruikshank SJ, Lewis TJ, and Connors BW (2007). Synaptic basis for intense thalamocortical activation of feedforward inhibitory cells in neocortex. Nat. Neurosci 10, 462–468. [DOI] [PubMed] [Google Scholar]
- Cruikshank SJ, Urabe H, Nurmikko AV, and Connors BW (2010). Pathway-specific feedforward circuits between thalamus and neocortex revealed by selective optical stimulation of axons. Neuron 65, 230–245. [DOI] [PMC free article] [PubMed] [Google Scholar]
- Dantzker JL, and Callaway EM (2000). Laminar sources of synaptic input to cortical inhibitory interneurons and pyramidal neurons. Nat. Neurosci 3, 701–707. [DOI] [PubMed] [Google Scholar]
- Dávid C, Schleicher A, Zuschratter W, and Staiger JF (2007). The innervation of parvalbumin-containing interneurons by VIP-immunopositive interneurons in the primary somatosensory cortex of the adult rat. Eur. J. Neurosci 25, 2329–2340. [DOI] [PubMed] [Google Scholar]
- Feldmeyer D, Qi G, Emmenegger V, and Staiger JF (2018). Inhibitory interneurons and their circuit motifs in the many layers of the barrel cortex. Neuroscience 368, 132–151. [DOI] [PubMed] [Google Scholar]
- Flesher SN, Collinger JL, Foldes ST, Weiss JM, Downey JE, Tyler-Kabara EC, Bensmaia SJ, Schwartz AB, Boninger ML, and Gaunt RA (2016). Intracortical microstimulation of human somatosensory cortex. Sci. Transl. Med 8, 361ra141–361ra141. [DOI] [PubMed] [Google Scholar]
- Fu Y, Tucciarone JM, Espinosa JS, Sheng N, Darcy DP, Nicoll RA, Huang ZJ, and Stryker MP (2014). A cortical circuit for gain control by behavioral state. Cell 156, 1139–1152. [DOI] [PMC free article] [PubMed] [Google Scholar]
- Gabernet L, Jadhav SP, Feldman DE, Carandini M, and Scanziani M (2005). Somatosensory integration controlled by dynamic thalamocortical feed-forward inhibition. Neuron 48, 315–327. [DOI] [PubMed] [Google Scholar]
- Gentet LJ, Avermann M, Matyas F, Staiger JF, and Petersen CCH (2010). Membrane potential dynamics of GABAergic neurons in the barrel cortex of behaving mice. Neuron 65, 422–435. [DOI] [PubMed] [Google Scholar]
- Gentet LJ, Kremer Y, Taniguchi H, Huang ZJ, Staiger JF, and Petersen CCH (2012). Unique functional properties of somatostatin-expressing GABAergic neurons in mouse barrel cortex. Nat. Neurosci 15, 607–612. [DOI] [PubMed] [Google Scholar]
- Gibson JJ (1962). Observations on active touch. Psychol. Rev 69, 477–491. [DOI] [PubMed] [Google Scholar]
- Gibson JR, Beierlein M, and Connors BW (1999). Two networks of electrically coupled inhibitory neurons in neocortex. Nature 402, 75–79. [DOI] [PubMed] [Google Scholar]
- Groh A, Kock C.P.J. de, Wimmer VC, Sakmann B, and Kuner T (2008). Driver or coincidence detector: modal switch of a corticothalamic giant synapse controlled by spontaneous activity and shortterm depression. J. Neurosci 28, 9652–9663. [DOI] [PMC free article] [PubMed] [Google Scholar]
- Guo ZV, Li N, Huber D, Ophir E, Gutnisky D, Ting JT, Feng G, and Svoboda K (2014a). Flow of cortical activity underlying a tactile decision in mice. Neuron 81, 179–194. [DOI] [PMC free article] [PubMed] [Google Scholar]
- Guo ZV, Hires SA, Li N, O’Connor DH, Komiyama T, Ophir E, Huber D, Bonardi C, Morandell K, Gutnisky D, et al. (2014b). Procedures for behavioral experiments in head-fixed mice. PloS One 9, e88678. [DOI] [PMC free article] [PubMed] [Google Scholar]
- Gutnisky DA, Yu J, Hires SA, To M-S, Bale MR, Svoboda K, and Golomb D (2017). Mechanisms underlying a thalamocortical transformation during active tactile sensation. PLoS Comput. Biol 13, e1005576. [DOI] [PMC free article] [PubMed] [Google Scholar]
- Helmstaedter M, Staiger JF, Sakmann B, and Feldmeyer D (2008). Efficient recruitment of layer 2/3 interneurons by layer 4 input in single columns of rat somatosensory cortex. J. Neurosci 28, 8273–8284. [DOI] [PMC free article] [PubMed] [Google Scholar]
- Hioki H, Okamoto S, Konno M, Kameda H, Sohn J, Kuramoto E, Fujiyama F, and Kaneko T (2013). Cell type-specific inhibitory inputs to dendritic and somatic compartments of parvalbumin-expressing neocortical interneuron. J. Neurosci 33, 544–555. [DOI] [PMC free article] [PubMed] [Google Scholar]
- Hires SA, Gutnisky DA, Yu J, O’Connor DH, and Svoboda K (2015). Low-noise encoding of active touch by layer 4 in the somatosensory cortex. ELife 4. [DOI] [PMC free article] [PubMed] [Google Scholar]
- Hong YK, Lacefield CO, Rodgers CC, and Bruno RM (2018). Sensation, movement and learning in the absence of barrel cortex. Nature 561, 542–546. [DOI] [PMC free article] [PubMed] [Google Scholar]
- Hooks BM, Hires SA, Zhang Y-X, Huber D, Petreanu L, Svoboda K, and Shepherd GMG (2011). Laminar analysis of excitatory local circuits in vibrissal motor and sensory cortical areas. PLoS Biol. 9, e1000572. [DOI] [PMC free article] [PubMed] [Google Scholar]
- Hu H, and Agmon A (2016). Differential excitation of distally versus proximally targeting cortical interneurons by unitary thalamocortical bursts. J. Neurosci 36, 6906–6916. [DOI] [PMC free article] [PubMed] [Google Scholar]
- Hu H, Cavendish JZ, and Agmon A (2013). Not all that glitters is gold: off-target recombination in the somatostatin-IRES-Cre mouse line labels a subset of fast-spiking interneurons. Front. Neural Circuits 7, 195. [DOI] [PMC free article] [PubMed] [Google Scholar]
- Jackson J, Ayzenshtat I, Karnani MM, and Yuste R (2016). VIP+ interneurons control neocortical activity across brain states. J. Neurophysiol 115, 3008–3017. [DOI] [PMC free article] [PubMed] [Google Scholar]
- Jiang X, Shen S, Cadwell CR, Berens P, Sinz F, Ecker AS, Patel S, and Tolias AS (2015). Principles of connectivity among morphologically defined cell types in adult neocortex. Science 350, aac9462–aac9462. [DOI] [PMC free article] [PubMed] [Google Scholar]
- Jouhanneau J-S, Kremkow J, and Poulet JFA (2018). Single synaptic inputs drive high-precision action potentials in parvalbumin expressing GABA-ergic cortical neurons in vivo. Nat. Commun 9, 1540. [DOI] [PMC free article] [PubMed] [Google Scholar]
- Kinnischtzke AK, Simons DJ, and Fanselow EE (2014). Motor cortex broadly engages excitatory and inhibitory neurons in somatosensory barrel cortex. Cereb. Cortex 24, 2237–2248. [DOI] [PMC free article] [PubMed] [Google Scholar]
- Knutsen PM, Pietr M, and Ahissar E (2006). Haptic object localization in the vibrissal system: behavior and performance. J. Neurosci 26, 8451–8464. [DOI] [PMC free article] [PubMed] [Google Scholar]
- de Kock CPJ, Bruno RM, Spors H, and Sakmann B (2007). Layer- and cell-type-specific suprathreshold stimulus representation in rat primary somatosensory cortex. J. Physiol 581, 139–154. [DOI] [PMC free article] [PubMed] [Google Scholar]
- Koelbl C, Helmstaedter M, Lübke J, and Feldmeyer D (2015). A barrel-related interneuron in layer 4 of rat somatosensory cortex with a high intrabarrel connectivity. Cereb. Cortex 25, 713–725. [DOI] [PMC free article] [PubMed] [Google Scholar]
- Kuchibhotla KV, Gill JV, Lindsay GW, Papadoyannis ES, Field RE, Sten TAH, Miller KD, and Froemke RC (2017). Parallel processing by cortical inhibition enables context-dependent behavior. Nat. Neurosci 20, 62–71. [DOI] [PMC free article] [PubMed] [Google Scholar]
- Kvitsiani D, Ranade S, Hangya B, Taniguchi H, Huang JZ, and Kepecs A (2013). Distinct behavioural and network correlates of two interneuron types in prefrontal cortex. Nature 498, 363–366. [DOI] [PMC free article] [PubMed] [Google Scholar]
- Lee S, Hjerling-Leffler J, Zagha E, Fishell G, and Rudy B (2010). The largest group of superficial neocortical GABAergic interneurons expresses ionotropic serotonin receptors. J. Neurosci. Off. J. Soc. Neurosci 30, 16796–16808. [DOI] [PMC free article] [PubMed] [Google Scholar]
- Lee S, Kruglikov I, Huang ZJ, Fishell G, and Rudy B (2013). A disinhibitory circuit mediates motor integration in the somatosensory cortex. Nat. Neurosci 16, 1662–1670. [DOI] [PMC free article] [PubMed] [Google Scholar]
- Lefort S, Tomm C, Floyd Sarria J-C, and Petersen CCH (2009). The excitatory neuronal network of the C2 barrel column in mouse primary somatosensory cortex. Neuron 61, 301–316. [DOI] [PubMed] [Google Scholar]
- Li L-Y, Xiong XR, Ibrahim LA, Yuan W, Tao HW, and Zhang LI (2015). Differential receptive field properties of parvalbumin and somatostatin inhibitory neurons in mouse auditory cortex. Cereb. Cortex 25, 1782–1791. [DOI] [PMC free article] [PubMed] [Google Scholar]
- Lima SQ, Hromádka T, Znamenskiy P, and Zador AM (2009). PINP: a new method of tagging neuronal populations for identification during in vivo electrophysiological recording. PLOS ONE 4, e6099. [DOI] [PMC free article] [PubMed] [Google Scholar]
- Litwin-Kumar A, Rosenbaum R, and Doiron B (2016). Inhibitory stabilization and visual coding in cortical circuits with multiple interneuron subtypes. J. Neurophysiol 115, 1399–1409. [DOI] [PMC free article] [PubMed] [Google Scholar]
- Lu S-M, and Lin RC-S (1993). Thalamic afferents of the rat barrel cortex: a light-and electron-microscopic study using phaseolus vulgaris leucoagglutinin as an anterograde tracer. Somatosens. Mot. Res 10, 1–16. [DOI] [PubMed] [Google Scholar]
- Ma W, Liu B, Li Y, Huang ZJ, Zhang LI, and Tao HW (2010). Visual representations by cortical somatostatin inhibitory neurons—selective but with weak and delayed responses. J. Neurosci 30, 14371–14379. [DOI] [PMC free article] [PubMed] [Google Scholar]
- Ma Y, Hu H, Berrebi AS, Mathers PH, and Agmon A (2006). Distinct subtypes of somatostatincontaining neocortical interneurons revealed in transgenic mice. J. Neurosci 26, 5069–5082. [DOI] [PMC free article] [PubMed] [Google Scholar]
- Ma Y, Hu H, and Agmon A (2012). Short-term plasticity of unitary inhibitory-to-inhibitory synapses depends on the presynaptic interneuron subtype. J. Neurosci 32, 983–988. [DOI] [PMC free article] [PubMed] [Google Scholar]
- Madisen L, Zwingman TA, Sunkin SM, Oh SW, Zariwala HA, Gu H, Ng LL, Palmiter RD, Hawrylycz MJ, Jones AR, et al. (2010). A robust and high-throughput Cre reporting and characterization system for the whole mouse brain. Nat. Neurosci 13, 133–140. [DOI] [PMC free article] [PubMed] [Google Scholar]
- Madisen L, Mao T, Koch H, Zhuo J, Berenyi A, Fujisawa S, Hsu Y-WA, Garcia AJ, Gu X, Zanella S, et al. (2012). A toolbox of Cre-dependent optogenetic transgenic mice for light-induced activation and silencing. Nat. Neurosci 15, 793–802. [DOI] [PMC free article] [PubMed] [Google Scholar]
- Manns ID, Sakmann B, and Brecht M (2004). Sub- and suprathreshold receptive field properties of pyramidal neurones in layers 5A and 5B of rat somatosensory barrel cortex. J. Physiol 556, 601–622. [DOI] [PMC free article] [PubMed] [Google Scholar]
- Mao T, Kusefoglu D, Hooks BM, Huber D, Petreanu L, and Svoboda K (2011). Long-range neuronal circuits underlying the interaction between sensory and motor cortex. Neuron 72, 111–123. [DOI] [PMC free article] [PubMed] [Google Scholar]
- Masino SA, Kwon MC, Dory Y, and Frostig RD (1993). Characterization of functional organization within rat barrel cortex using intrinsic signal optical imaging through a thinned skull. Proc. Natl. Acad. Sci 90, 9998–10002. [DOI] [PMC free article] [PubMed] [Google Scholar]
- Masri R, Bezdudnaya T, Trageser JC, and Keller A (2008). Encoding of stimulus frequency and sensor motion in the posterior medial thalamic nucleus. J. Neurophysiol 100, 681–689. [DOI] [PMC free article] [PubMed] [Google Scholar]
- Mehta SB, Whitmer D, Figueroa R, Williams BA, and Kleinfeld D (2007). Active spatial perception in the vibrissa scanning sensorimotor system. PLoS Biol. 5, e15. [DOI] [PMC free article] [PubMed] [Google Scholar]
- Moore AK, and Wehr M (2013). Parvalbumin-expressing inhibitory interneurons in auditory cortex are well-tuned for frequency. J. Neurosci. Off. J. Soc. Neurosci 33, 13713–13723. [DOI] [PMC free article] [PubMed] [Google Scholar]
- Moore CI, and Nelson SB (1998). Spatio-temporal subthreshold receptive fields in the vibrissa representation of rat primary somatosensory cortex. J. Neurophysiol 80, 2882–2892. [DOI] [PubMed] [Google Scholar]
- Moore JD, Mercer Lindsay N, Deschênes M, and Kleinfeld D (2015). Vibrissa self-motion and touch are reliably encoded along the same somatosensory pathway from brainstem through thalamus. PLoS Biol. 13, e1002253. [DOI] [PMC free article] [PubMed] [Google Scholar]
- Muñoz W, Tremblay R, and Rudy B (2014). Channelrhodopsin-assisted patching: in vivo recording of genetically and morphologically identified neurons throughout the brain. Cell Rep. 9, 2304–2316. [DOI] [PMC free article] [PubMed] [Google Scholar]
- Muñoz W, Tremblay R, Levenstein D, and Rudy B (2017). Layer-specific modulation of neocortical dendritic inhibition during active wakefulness. Science 355, 954–959. [DOI] [PubMed] [Google Scholar]
- Naka A, Veit J, Shababo B, Chance RK, Risso D, Stafford D, Snyder B, Egladyous A, Chu D, Sridharan S, et al. (2019). Complementary networks of cortical somatostatin interneurons enforce layer specific control. ELife 8. [DOI] [PMC free article] [PubMed] [Google Scholar]
- Nawrot M, Aertsen A, and Rotter S (1999). Single-trial estimation of neuronal firing rates: From single-neuron spike trains to population activity. J. Neurosci. Methods 94, 81–92. [DOI] [PubMed] [Google Scholar]
- O’Connor DH, Clack NG, Huber D, Komiyama T, Myers EW, and Svoboda K (2010a). Vibrissa-based object localization in head-fixed mice. J. Neurosci 30, 1947–1967. [DOI] [PMC free article] [PubMed] [Google Scholar]
- O’Connor DH, Peron SP, Huber D, and Svoboda K (2010b). Neural activity in barrel cortex underlying vibrissa-based object localization in mice. Neuron 67, 1048–1061. [DOI] [PubMed] [Google Scholar]
- O’Connor DH, Hires SA, Guo ZV, Li N, Yu J, Sun Q-Q, Huber D, and Svoboda K (2013). Neural coding during active somatosensation revealed using illusory touch. Nat. Neurosci 16, 958–965. [DOI] [PMC free article] [PubMed] [Google Scholar]
- Oliva AA, Jiang M, Lam T, Smith KL, and Swann JW (2000). Novel hippocampal interneuronal subtypes identified using transgenic mice that express green fluorescent protein in GABAergic interneurons. J. Neurosci 20, 3354–3368. [DOI] [PMC free article] [PubMed] [Google Scholar]
- Pala A, and Petersen CCH (2015). In vivo measurement of cell-type-specific synaptic connectivity and synaptic transmission in layer 2/3 mouse barrel cortex. Neuron 85, 68–75. [DOI] [PMC free article] [PubMed] [Google Scholar]
- Pammer L, O’Connor DH, Hires SA, Clack NG, Huber D, Myers EW, and Svoboda K (2013). The mechanical variables underlying object localization along the axis of the whisker. J. Neurosci 33, 6726–6741. [DOI] [PMC free article] [PubMed] [Google Scholar]
- Penfield W, and Boldrey E (1937). Somatic motor and sensory representation in the cerebral cortex of man as studied by electrical stimulation. Brain 60, 389–443. [Google Scholar]
- Pepeu G, and Giovannini MG. (2004). Changes in acetylcholine extracellular levels during cognitive processes. Learn. Mem 11, 21–27. [DOI] [PubMed] [Google Scholar]
- Petersen RS, Brambilla M, Bale MR, Alenda A, Panzeri S, Montemurro MA, and Maravall M (2008). Diverse and temporally precise kinetic feature selectivity in the VPm thalamic nucleus. Neuron 60, 890–903. [DOI] [PubMed] [Google Scholar]
- Petreanu L, Mao T, Sternson SM, and Svoboda K (2009). The subcellular organization of neocortical excitatory connections. Nature 457, 1142–1145. [DOI] [PMC free article] [PubMed] [Google Scholar]
- Pfeffer CK, Xue M, He M, Huang ZJ, and Scanziani M (2013). Inhibition of inhibition in visual cortex: the logic of connections between molecularly distinct interneurons. Nat. Neurosci 16, 1068–1076. [DOI] [PMC free article] [PubMed] [Google Scholar]
- Pi H-J, Hangya B, Kvitsiani D, Sanders JI, Huang ZJ, and Kepecs A (2013). Cortical interneurons that specialize in disinhibitory control. Nature 503, 521–524. [DOI] [PMC free article] [PubMed] [Google Scholar]
- Pinault D (1996). A novel single-cell staining procedure performed in vivo under electrophysiological control: morpho-functional features of juxtacellularly labeled thalamic cells and other central neurons with biocytin or Neurobiotin. J. Neurosci. Methods 65, 113–136. [DOI] [PubMed] [Google Scholar]
- Pinault D (2005). A new stabilizing craniotomy–duratomy technique for single-cell anatomo-electrophysiological exploration of living intact brain networks. J. Neurosci. Methods 141, 231–242. [DOI] [PubMed] [Google Scholar]
- Pluta S, Naka A, Veit J, Telian G, Yao L, Hakim R, Taylor D, and Adesnik H (2015). A direct translaminar inhibitory circuit tunes cortical output. Nat. Neurosci 18, 1631–1640. [DOI] [PMC free article] [PubMed] [Google Scholar]
- Porter JT, Johnson CK, and Agmon A (2001). Diverse types of interneurons generate thalamus-evoked feedforward inhibition in the mouse barrel cortex. J. Neurosci 21, 2699–2710. [DOI] [PMC free article] [PubMed] [Google Scholar]
- Poulet JFA, Fernandez LMJ, Crochet S, and Petersen CCH (2012). Thalamic control of cortical states. Nat. Neurosci 15, 370–372. [DOI] [PubMed] [Google Scholar]
- Prönneke A, Scheuer B, Wagener RJ, Möck M, Witte M, and Staiger JF (2015). Characterizing VIP neurons in the barrel cortex of VIPcre/tdTomato mice reveals layer-specific differences. Cereb. Cortex 25, 4854–4868. [DOI] [PMC free article] [PubMed] [Google Scholar]
- Reyes A, Lujan R, Rozov A, Burnashev N, Somogyi P, and Sakmann B (1998). Target-cell-specific facilitation and depression in neocortical circuits. Nat. Neurosci 1, 279–285. [DOI] [PubMed] [Google Scholar]
- Romo R, Hernández A, Zainos A, and Salinas E (1998). Somatosensory discrimination based on cortical microstimulation. Nature 392, 387–390. [DOI] [PubMed] [Google Scholar]
- Rudy B, Fishell G, Lee S, and Hjerling‐Leffler J (2011). Three groups of interneurons account for nearly 100% of neocortical GABAergic neurons. Dev. Neurobiol. 71, 45–61. [DOI] [PMC free article] [PubMed] [Google Scholar]
- Sachidhanandam S, Sermet BS, and Petersen CCH (2016). Parvalbumin-expressing GABAergic neurons in mouse barrel cortex contribute to gating a goal-directed sensorimotor transformation. Cell Rep. 15, 700–706. [DOI] [PMC free article] [PubMed] [Google Scholar]
- Sempere-Ferràndez A, Martínez S, and Geijo-Barrientos E (2019). Synaptic mechanisms underlying the intense firing of neocortical layer 5B pyramidal neurons in response to cortico-cortical inputs. Brain Struct. Funct 224, 1403–1416. [DOI] [PMC free article] [PubMed] [Google Scholar]
- Severson KS, Xu D, Van de Loo M, Bai L, Ginty DD, and O’Connor DH (2017). Active touch and self-motion encoding by Merkel cell-associated afferents. Neuron 94, 666–676.e9. [DOI] [PMC free article] [PubMed] [Google Scholar]
- Shepherd GMG, and Svoboda K (2005). Laminar and columnar organization of ascending excitatory projections to layer 2/3 pyramidal neurons in rat barrel cortex. J. Neurosci 25, 5670–5679. [DOI] [PMC free article] [PubMed] [Google Scholar]
- Simons DJ (1978). Response properties of vibrissa units in rat SI somatosensory neocortex. J. Neurophysiol 41, 798–820. [DOI] [PubMed] [Google Scholar]
- Simons DJ, and Carvell GE (1989). Thalamocortical response transformation in the rat vibrissa/barrel system. J. Neurophysiol 61, 311–330. [DOI] [PubMed] [Google Scholar]
- Sohn J, Okamoto S, Kataoka N, Kaneko T, Nakamura K, and Hioki H (2016). Differential inputs to the perisomatic and distal-dendritic compartments of VIP- positive neurons in layer 2/3 of the mouse barrel cortex. Front. Neuroanat 10. [DOI] [PMC free article] [PubMed] [Google Scholar]
- Staiger JF, Zilles K, and Freund TF (1996). Innervation of VIP-immunoreactive neurons by the ventroposteromedial thalamic nucleus in the barrel cortex of the rat. J. Comp. Neurol 367, 194–204. [DOI] [PubMed] [Google Scholar]
- Staiger JF, Freund TF, and Zilles K (1997). Interneurons immunoreactive for vasoactive intestinal polypeptide (VIP) are extensively innervated by parvalbumin-containing boutons in rat primary somatosensory cortex. Eur. J. Neurosci 9, 2259–2268. [DOI] [PubMed] [Google Scholar]
- Staiger JF, Schubert D, Zuschratter W, Kötter R, and Luhmann HJ (2002). Innervation of interneurons immunoreactive for VIP by intrinsically bursting pyramidal cells and fast-spiking interneurons in infragranular layers of juvenile rat neocortex. Eur. J. Neurosci 16, 11–20. [DOI] [PubMed] [Google Scholar]
- Sun Q-Q, Huguenard JR, and Prince DA (2006). Barrel cortex microcircuits: thalamocortical feedforward inhibition in spiny stellate cells is mediated by a small number of fast-spiking interneurons. J. Neurosci 26, 1219–1230. [DOI] [PMC free article] [PubMed] [Google Scholar]
- Suter BA, O’Connor T, Iyer V, Petreanu L, Hooks BM, Kiritani T, Svoboda K, and Shepherd GMG (2010). Ephus: Multipurpose data acquisition software for neuroscience experiments. Front. Neural Circuits 4. [DOI] [PMC free article] [PubMed] [Google Scholar]
- Swadlow HA (1989). Efferent neurons and suspected interneurons in S-1 vibrissa cortex of the awake rabbit: receptive fields and axonal properties. J. Neurophysiol 62, 288–308. [DOI] [PubMed] [Google Scholar]
- Swadlow HA (1995). Influence of VPM afferents on putative inhibitory interneurons in S1 of the awake rabbit: evidence from cross-correlation, microstimulation, and latencies to peripheral sensory stimulation. J. Neurophysiol 73, 1584–1599. [DOI] [PubMed] [Google Scholar]
- Taniguchi H, He M, Wu P, Kim S, Paik R, Sugino K, Kvitsani D, Fu Y, Lu J, Lin Y, et al. (2011). A resource of cre driver lines for genetic targeting of GABAergic neurons in cerebral cortex. Neuron 71, 995–1013. [DOI] [PMC free article] [PubMed] [Google Scholar]
- Tasic B, Yao Z, Graybuck LT, Smith KA, Nguyen TN, Bertagnolli D, Goldy J, Garren E, Economo MN, Viswanathan S, et al. (2018). Shared and distinct transcriptomic cell types across neocortical areas. Nature 563, 72–78. [DOI] [PMC free article] [PubMed] [Google Scholar]
- Tremblay R, Lee S, and Rudy B (2016). GABAergic interneurons in the neocortex: from cellular properties to circuits. Neuron 91, 260–292. [DOI] [PMC free article] [PubMed] [Google Scholar]
- Urbain N, Salin PA, Libourel P-A, Comte J-C, Gentet LJ, and Petersen CCH (2015). Whisking-related changes in neuronal firing and membrane potential dynamics in the somatosensory thalamus of awake mice. Cell Rep. 13, 647–656. [DOI] [PubMed] [Google Scholar]
- Wilent WB, and Contreras D (2005). Dynamics of excitation and inhibition underlying stimulus selectivity in rat somatosensory cortex. Nat. Neurosci 8, 1364–1370. [DOI] [PubMed] [Google Scholar]
- Wimmer VC, Bruno RM, de Kock CPJ, Kuner T, and Sakmann B (2010). Dimensions of a projection column and architecture of VPM and POm axons in rat vibrissal cortex. Cereb. Cortex 20, 2265–2276. [DOI] [PMC free article] [PubMed] [Google Scholar]
- Xu H, Jeong H-Y, Tremblay R, and Rudy B (2013). Neocortical somatostatin-expressing GABAergic interneurons disinhibit the thalamorecipient layer 4. Neuron 77, 155–167. [DOI] [PMC free article] [PubMed] [Google Scholar]
- Yu J, Gutnisky DA, Hires SA, and Svoboda K (2016). Layer 4 fast-spiking interneurons filter thalamocortical signals during active somatosensation. Nat. Neurosci 19, 1647–1657. [DOI] [PubMed] [Google Scholar]
- Zhu JJ, and Connors BW (1999). Intrinsic firing patterns and whisker-evoked synaptic responses of neurons in the rat barrel cortex. J. Neurophysiol 81, 1171–1183. [DOI] [PubMed] [Google Scholar]
Associated Data
This section collects any data citations, data availability statements, or supplementary materials included in this article.
Supplementary Materials
Data Availability Statement
The data generated during this study are available in NWB2.0 format (https://neurodatawithoutborders.github.io/) at figshare.org (DOI: 10.25378/janelia.8869115)