Abstract
Background:
DNA fluorescence dyes have been used to study DNA dynamics, chromatin structure, and cell cycle analysis. However, most microscopic fluorescence studies of DNA use only steady-state measurements and do not take advantage of the additional information content of the time-resolved fluorescence. In this paper, we combine fluorescence imaging of DNA with time-resolved measurements to examine the proximity of donors and acceptors bound to chromatin.
Methods:
We used frequency-domain fluorescence lifetime imaging microscopy to study the spatial distribution of DNA-bound donors and acceptors in fixed 3T3 nuclei. Over 50 cell nuclei were imaged in the presence of an AT-specific donor, Hoechst 33258 (Ho), and a GC-specific acceptor, 7-aminoactinomycin D (7-AAD).
Results:
The intensity images of Ho alone showed a spatially irregular distribution due to the various concentrations of DNA or AT-rich DNA throughout the nuclei. The lifetime imaging of the Ho-stained nuclei was typically flat. Addition of 7-AAD decreased the fluorescence intensity and lifetime of the Ho-stained DNA. The spatially dependent phase and modulation values of Ho in the presence of 7-AAD showed that the Ho decay becomes nonexponential, as is expected for a resonance energy transfer (RET) with multiple acceptors located over a range of distances. In approximately 40 nuclei, the intensity and lifetime decrease was spatially homogeneous. In approximately 10 nuclei, addition of 7-AAD resulted in a spatially nonhomogeneous decrease in intensity and lifetime. The RET efficiency was higher in G2/M than in G0/1 phase cells.
Conclusions:
Because RET efficiency depends on the average distance between Ho and 7-AAD, data suggest that the heterogeneity of lifetimes and spatial variation of the RET efficiency are caused by the presence of highly condensed regions of DNA in nuclei.
Keywords: FLIM, FRET, fibroblasts, nucleus, nucleic acid, texture analysis, Hoechst 33258
The use of fluorescence to study DNA has a long history. The earliest studies involved the use of fluorophores to stain chromosomes to make them visible in a fluorescence microscope. Since these early studies, many dyes have been shown to bind to DNA and to display increased emission (1–4). The strong emission of dyes bound to DNA also resulted in the use of fluorescence to study DNA dynamics (5,6), chromatin structure (7,8), and cell cycle analysis (9,10). Specific dyes, such as Hoechst 33258 (Ho; AT specific), 4’,6-diamidino-2-phenylindole (AT specific), mithramycin (GC specific), and 7-aminoactinomycin D (7-AAD; GC specific), were used for structural analyses of AT- or GC-rich DNA (11–16). These studies showed significant changes in the structure and composition of AT and GC-rich chromatin during the cell cycle (15,16). Resonance energy transfer (RET) has also been used as a powerful tool in DNA structure studies (17–19). The studies of metaphase chromosomes using RET showed the relationship between chromosome composition and staining patterns (20,21). However, most fluorescence and microscopic studies of DNA use a steady-state approach and do not take advantage of the additional information provided by time-resolved fluorescence.
In this paper, we combined fluorescence imaging of DNA with time-resolved measurements. In particular, we used fluorescence lifetime imaging microscopy (FLIM) to measure the decay times of labeled DNA in the fixed nuclei of 3T3 fibroblasts. FLIM provided a measurement of the decay time at each point in a two-dimensional image (22–25). RET is known to decrease the decay times of the fluorescent donors and to be sensitive to the donor-to-acceptor distance. We used the properties of RET to investigate the proximity of donors and acceptors bound to DNA in the nuclei of 3T3 cells. The chosen donor and acceptor were Ho and 7-AAD, respectively. We reasoned that AT-rich regions of the nuclei would show bright fluorescence from Ho. However, because Ho binds to AT base pairs, we expected the emission to be dominated by AT-bound Ho and the decay time to be similar in all regions containing DNA. Addition of 7-AAD is expected to decrease the Ho intensity and lifetime. The largest decreases were observed when Ho and 7-AAD were in close proximity due to either the DNA sequence or the folding patterns of the DNA strands. To the best of our knowledge, this is the first report of lifetime imaging to study DNA in cell nuclei.
MATERIALS AND METHODS
Cells and Conditions
Mouse fibroblasts (3T3-Swiss albino, ATCC number CCL-92) were grown asynchronously at 37°C and 5% CO2 in the bottom-glass dishes (Mat Tek, Ashland, MA) containing Dulbecco’s modified Eagle’s medium with 10% calf serum.
Fixation and Cell Staining
The cells in the dishes were fixed in 70% ethanol (4°C, at least 30 min). After rinsing, the cells were stained by Ho and 7-AAD (Molecular Probes, Eugene, OR), the donor and acceptor, respectively. All the experiments were carried out at room temperature in 10 mM Tris HCl buffer, pH 7.5, containing 100 mM NaCl. Ho and 7-AAD were quantified spectroscopically by using a molar extinction coefficient of 40,000 cm−1 M−1 at 352 nm and 25,000 cm−1 M−1 at 546 nm, respectively. The Ho and 7-AAD concentrations were 0.4 and 0.8 mM, respectively. At these concentrations, every cell showed the significant change of fluorescence intensity and lifetime after addition of 7-AAD.
Measurement Condition of Fluorescence Intensity and Lifetime Imaging
The principles of operation of the homodyne FLIM technique were described previously (22–25). The apparatus was built around the Zeiss Axiovert 135TV inverted fluorescence microscope. The picosecond light pulses at 335 nm from the frequency-doubled synchronously pumped DCM dye laser were directed to the microscope using quartz optical fiber. The epi-illumination was accomplished by the Zeiss C-Apochromat water immersion objective, magnification 40×, with a 1.6× Optovar insert and a Zeiss FT 395 dichroic beam splitter. Donor fluorescence from the sample was isolated by the interference filter (450 ± 33 nm; Omega Optical, Brattleboro, VT, model 450DF65), observed using a C5825 high-speed modulated image intensifier (Hamamatsu, Bridgewater, NJ), and quantified by a PXL scientific-grade, slow-scan, cooled CCD camera (Photometrics, Tucson, AR). The gain of the intensifier was modulated at 113.202 MHz using an output of the PTS 300 synthesizer (Programmed Test Sources, Littleton, MA). The synthesizer was phase locked to the master oscillator of the pumping Ar+ laser mode locker. For each lifetime measurement, eight images with the detector phase equally spaced over 360° were acquired and analyzed as described previoulsy (22–25). The illumination level of the sample was decreased by a neutral-density filter to the level that the acquisition time for the images was in the order of seconds. No detectable photobleaching was observed under these conditions.
Measurement of Fluorescence Intensity and Lifetime Imaging
The positions of 50 cells on a bottom-glass dish were recorded and assigned numbers. The cells were stained by 0.4 μM Ho and their fluorescence intensity and lifetime imaging were measured. Then, 0.8 μM 7-AAD was added to the same dish for fluorescence RET measurement. The fluorescence intensity and lifetime imaging of the same 50 cells using Ho and 7-AAD were measured individually. In both cases, the fluorescence signals originated from the cell nucleus. The fluorescence from nonspecific staining of the other cell structures was negligible.
The phase-sensitive images were used to calculate the phase (ϕ) and modulation (m) values at all regions of the nuclei. These values can be used to calculate the apparent phase (τφ) and modulation (τm) lifetimes. Regardless of the complexity of an intensity decay, it is always possible to interpret the decay a multiexponential model,
| (1) |
In this equation, αi is the time-zero amplitude due to each decay time (τi). If the intensity decay is a single exponential, then the lifetime τ can be calculated from the phase and modulation values using
| (2) |
| (3) |
where ω is the light modulation frequency in radians per second. If the decay is a multiexponential, it is still possible to calculate τϕ and τm. However, these are apparent values, which represent a complex weighting of the various decay time components (26–28). More specifically, the mean lifetime of a multiexponential decay () is given by
| (4) |
For a multiexponential decay, the apparent phase lifetime is shorter than the apparent modulation lifetime according to
| (5) |
The observation of can be taken as evidence for the presence of a multiexponential decay.
RESULTS
We examined the nuclei of mouse 3T3-Albino fibroblasts. These cells have a rich cytoplasm and a round nucleus about 15–30 μm in diameter. More than 50 such nuclei were examined using fluorescence microscopy and lifetime imaging. Steady-state images of representative nuclei stained with Ho (the AT-specific dye) or 7-AAD (the GC-specific dye) are shown in Fig. 1. The intensity of these nuclei typically showed spatial heterogeneity, with several or up to 10 brighter spots. We attribute these brighter regions to higher local concentrations of Ho or 7-AAD due to the higher local concentrations of AT or GC base pairs. The higher local AT or GC concentrations could be due to the AT- or GC-rich regions of the DNA or to a locally higher DNA concentration. The chosen pair of Ho as donor and 7-AAD as acceptor shows a good spectral match of RET as shown in Figure 2. Each nucleus was imaged before and after addition of the acceptor, 7-AAD. Addition of an increasing concentration of the acceptor resulted in a gradual decrease in Ho fluorescence intensity (data not shown). In our experiments, we adjusted the 7-AAD concentration to the level which typically resulted in an approximate threefold decrease in the Ho intensity. We attribute this decrease to RET between Ho and 7-AAD due to their spatial proximity when bound to DNA. As will be shown below, the fractional decrease in Ho intensity was similar at all regions of the nuclei. A representative fluorescence image of a nucleus stained by Ho in the presence and absence of 7-AAD is shown in Figure 3.
FIG. 1.
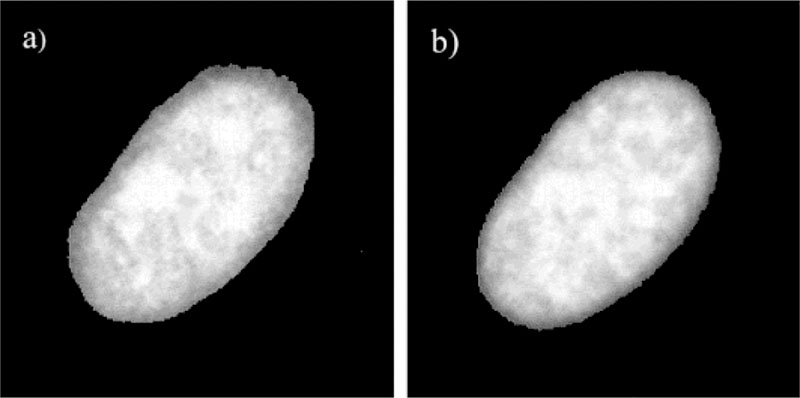
Fluorescence intensity image of a nucleus stained with Ho (a) and 7-AAD (b).
FIG. 2.
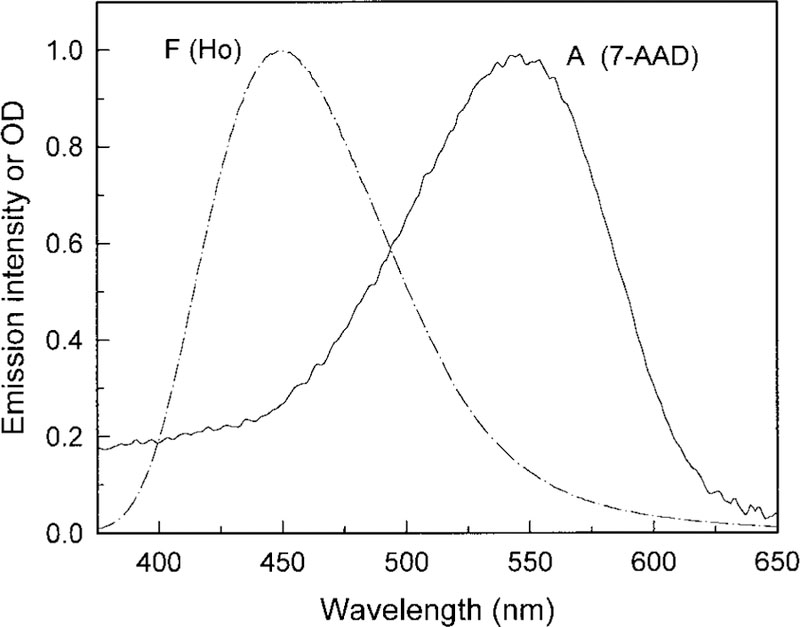
Fluorescence emission (F) and absorption spectra (A) of DNA complexes of Ho and 7-AAD. Fluorescence emission spectrum was excited at the absorption maximum.
FIG. 3.
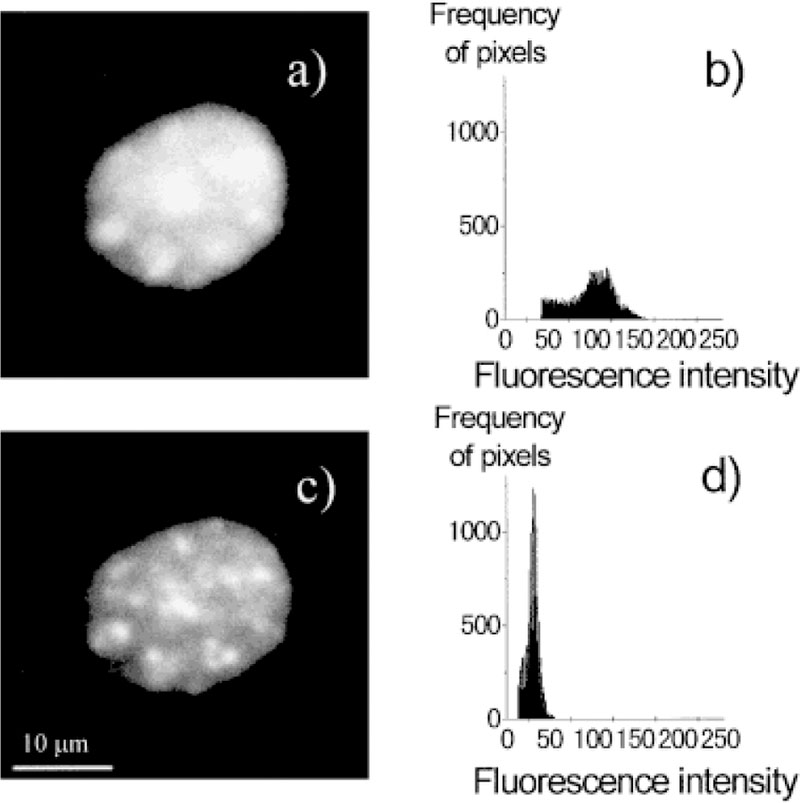
Fluorescence intensity images and corresponding histograms of a nucleus stained with Ho in the presence or absence of 7-AAD. a: Fluorescence intensity image of a nucleus stained with Ho; b: histogram of the image in (a); c: fluorescence intensity image of a nucleus stained with Ho and 7-AAD; d: histogram of the image in (c). Intensity of the images in (a) and (c) was adjusted for the same exposure time.
We also used FLIM to determine the spatial distribution of lifetimes in the nuclei. The lifetime images of the Ho-stained nuclei were typically flat and devoid of spatial differences, as shown for one representation nucleus in Figure 4. This result is consistent with a similar environment for the DNA-bound Ho molecules at all regions in the cell. Ho is expected to bind to the AT-rich regions of DNA and display the same lifetime, regardless of the local DNA concentration or the presence of GC base pairs distant from the Ho binding site. The mean lifetime of Ho is about 2.2 ns, which is comparable to that found in spectroscopic time-resolved measurements (13).
FIG. 4.
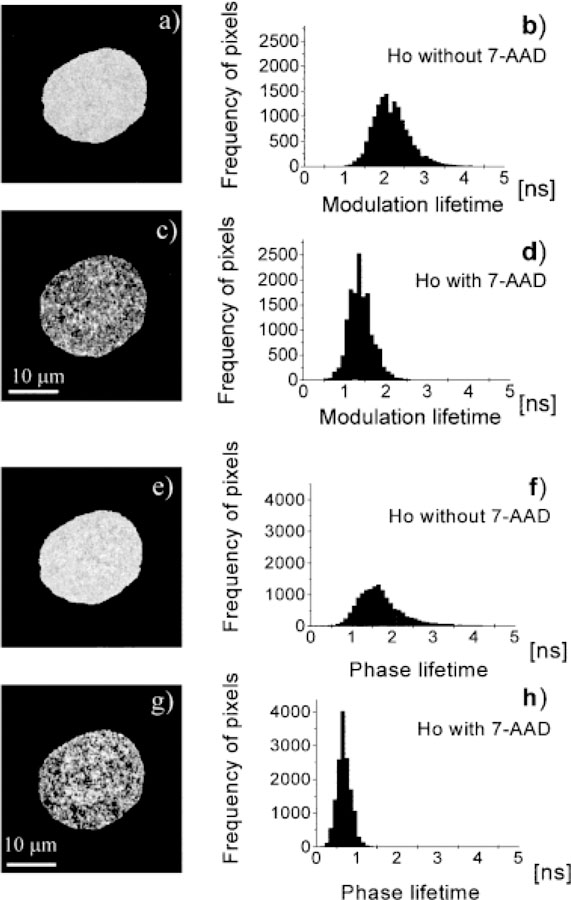
Fluorescence modulation and phase lifetime images and corresponding histograms of a nucleus stained with Ho in the presence or absence of 7-AAD. a: modulation lifetime image of a nucleus with Ho; b: histogram of the image in (a); c: modulation lifetime image of a nucleus stained with Ho and 7-AAD; d: histogram of the image in (c); e: modulation lifetime image of a nucleus stained with Ho; f: histogram of the image in (e); g: modulation lifetime image of a nucleus stained with Ho and 7-AAD; h: histogram of the image in (g).
Addition of the acceptor, 7-AAD, results in a decrease in the modulation lifetime to about 1.4 ns (Fig. 4). The fractional decrease in the modulation lifetime is smaller than the decrease in Ho intensity. This apparent discrepancy is due in part to the well-known weighting of apparent modulation lifetimes toward the longer components in a multiexponential decay (26–28). We also used the phase angles for lifetime imaging. The apparent phase lifetimes are uniform throughout the nuclei, but are shorter in the presence of 7-AAD (Fig. 4). The apparent phase lifetime decreases to a larger extent than the modulation lifetime because of weighting of phase lifetime toward the shorter components in a multiexponential decay (26–28). For both the modulation and phase (Fig. 4) lifetime images, the lifetime histogram remains unimodal, that is, a single statistical distribution of lifetimes around a single mean value.
We examined the lifetime images more closely for evidence of Ho populations with distinct mean lifetimes. Figure 5 shows the cumulative histograms for 50 phase and modulation lifetime images of the nuclei. These appear to be single Gaussian-like distributions in the presence and absence of the acceptor, 7-AAD. With our experimental resolution, we were not able to detect Ho populations with distinct environments.
FIG. 5.
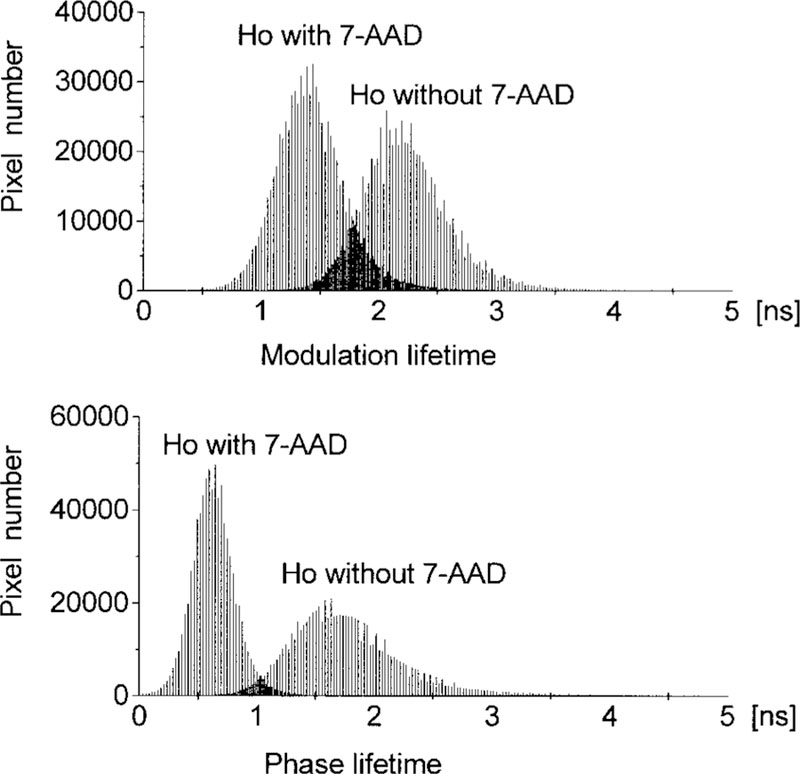
Cumulative histograms of 50 fluorescence modulation and phase lifetime images of nucleic stained with Ho in the presence or absence of 7-AAD.
Closer examination of Fig. 5 reveals that the apparent phase lifetimes are shorter than the apparent modulation lifetimes, both with and without the 7-AAD acceptor. We examined this correlation on a pixel-by-pixel basis in a single nuclei (Fig. 6) and on a cell-by-cell basis using the average values for 50 nuclei (Fig. 7). In the absence of 7-AAD, the apparent τϕ τm lifetimes are similar. This similarity of apparent lifetimes reflects an intensity decay that is close to a single exponential. In the presence of 7-AAD, the phase lifetime becomes considerably shorter than the modulation lifetime. This result is typical of multiexponential intensity decay (26–28) and indicates that the Ho decay becomes more heterogeneous or nonexponential in the presence of 7-AAD. Energy transfer to multiple acceptors is known to result in multiexponential or nonexponential decays for donors bound to DNA (13,29,30).
FIG. 6.
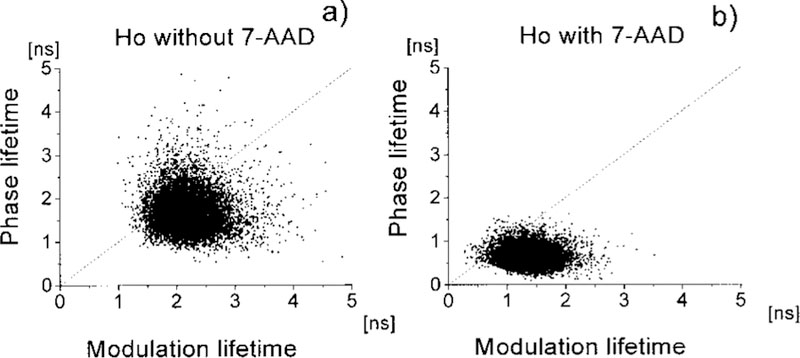
Correlation between fluorescence modulation and phase lifetime of a single nucleus stained with Ho in the presence or absence of 7-AAD. Each point represents one pixel of the image of the nucleus. The masked area outside the nucleus was not plotted.
FIG. 7.
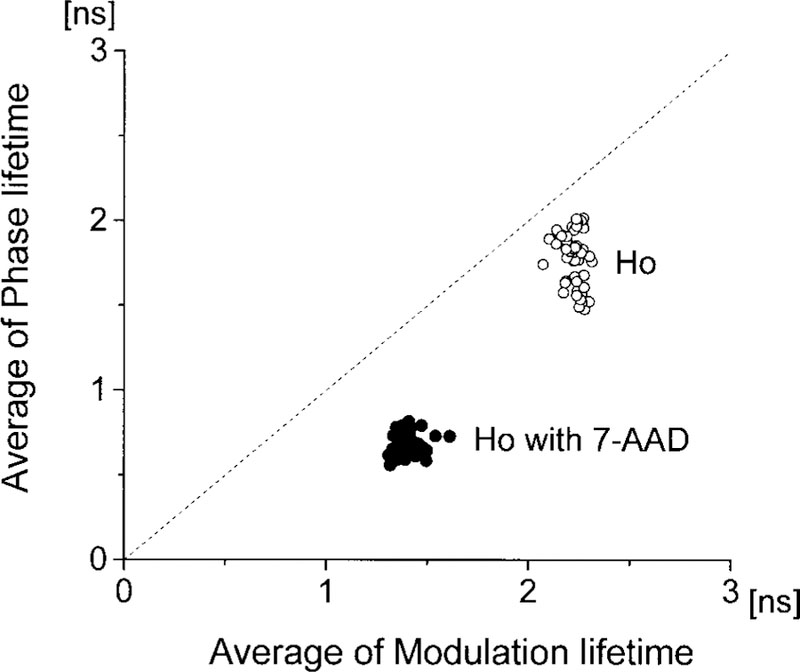
Correlation between average modulation and phase lifetimes of 50 nuclei stained with Ho in the absence (open circles) and presence (closed circles) of 7-AAD. Averaging was done over each whole nucleus. The scatter gram contains data from 50 cells.
One goal of this study was to search for regions of the nuclear DNA that displayed different distributions of the Ho donor and the 7-AAD acceptor. We reasoned that such differences may occur due to local variations in the fraction of GC or AT base pairs. We were unable to identify spatially distinct regions for about 80% of the cells. This is illustrated in Fig. 8, which compares the Ho intensities before (Fig. 8a) and after the addition of 7-AAD (Fig. 8b). Although there are regions of higher and lower Ho intensity, the intensity ratio image is flat (Fig. 8c). This result indicates that the fractional intensity decrease is the same at all regions in the nuclei. There was weak, if any, correlation between the intensity (Fig. 8b) and modulation lifetime image (Fig. 8d) in the presence of 7-AAD.
FIG. 8.
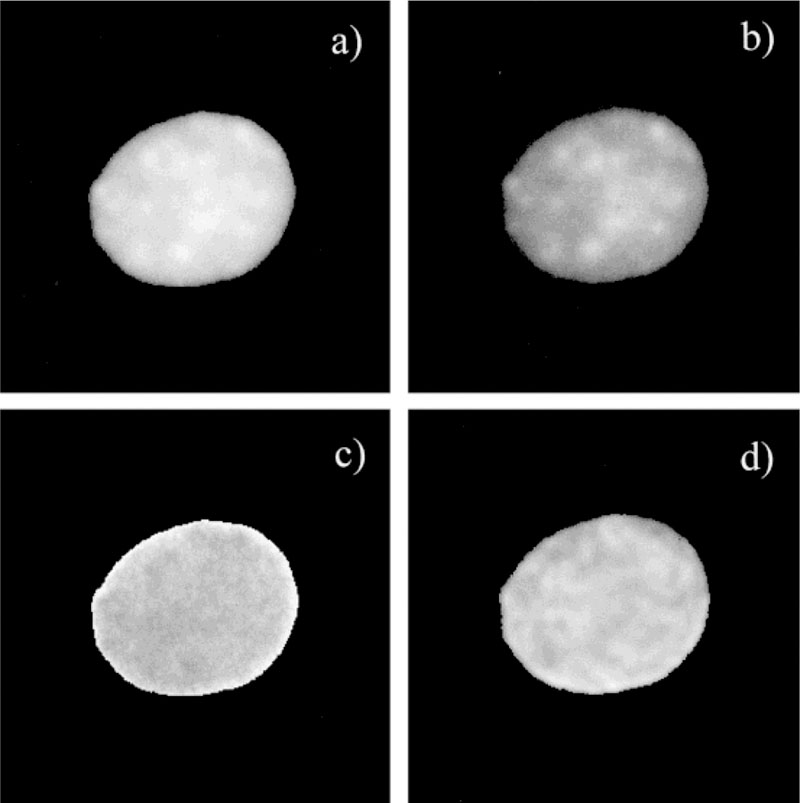
Fluorescence intensity, ratio, and lifetime images of Ho. a: Fluorescence intensity image in the absence of 7-AAD. b: Fluorescence intensity image in the presence of 7-AAD. c: Ratio of the image in (b) over the image in (a). d: Modulation lifetime in the presence of 7-AAD (this image is smoothed). Both lifetime and ratio images show a homogeneous pattern. The correlation between fluorescence intensity image (b) and modulation lifetime image (d) in the presence of 7-AAD is very weak.
Somewhat different results were observed for about 20% of the cells (Fig. 9). The intensity ratio image, in the absence and presence of 7-AAD, showed regions of lower intensity that corresponded to regions of high intensity in the intensity image (Fig. 9a). The modulation and phase lifetime images showed considerable spatial heterogeneity. Because the lifetime imaging of the nuclei only stained by donor was almost flat, the spatial heterogeneity of lifetime images with donor and acceptor is related to the spatial heterogeneity of RET efficiency. Such a result indicates that the average distance between Ho and 7-AAD is smaller in these regions of the nuclei.
FIG. 9.
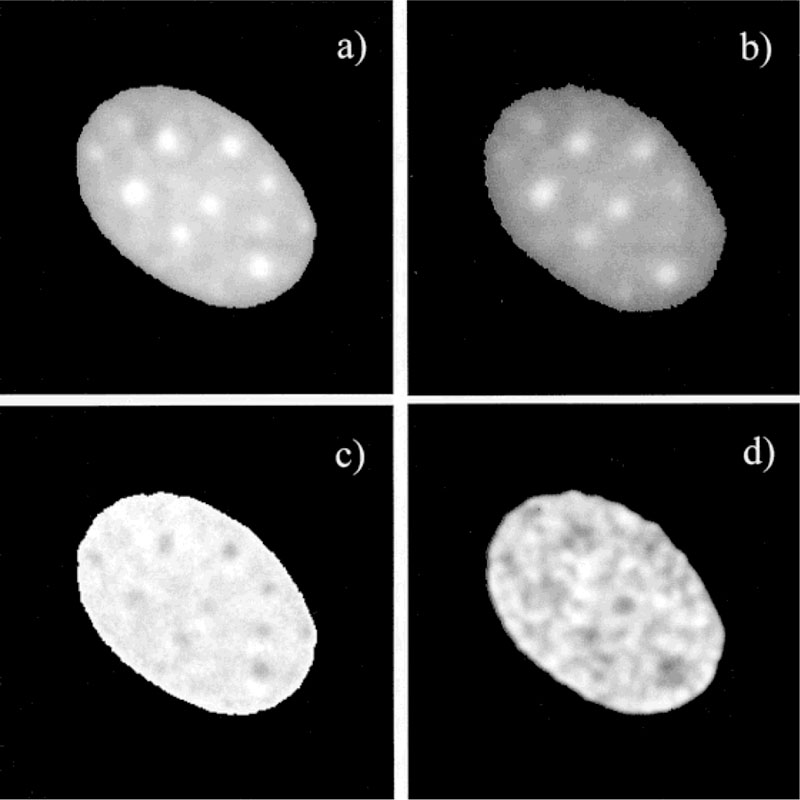
Fluorescence intensity, ratio, and lifetime images of Ho. a: Fluorescence intensity image in the absence of 7-AAD. b: Fluorescence intensity image in the presence of 7-AAD. c: Ratio image in (b) over the image in (a). d: Modulation lifetime in the presence of 7-AAD This image is smoothed for better recognition of dark spots. The regions with high efficiency of energy transfer, which are shown as dark spots in image (c), correspond with short lifetimes in image (d). The short lifetime spots and long lifetime areas in (d) are about 1.2 ± 0.05 and 1.70 ± 0.06 ns, respectively.
We have also studied the relationship between cell cycle and the effects of RET in nuclei. The average efficiency of RET throughout one nucleus depended on the cell cycle. Cells in G2/M phase and polyploid cells show slightly higher RET efficiency than the cells in G0/1 phase (Fig. 10). However, the cell cycle-associated change of the spatial heterogeneity of lifetime images is not obvious by a simple visual examination. A quantitative study of lifetime images using texture analysis shows the relationship between RET efficiency and the spatial heterogeneity of lifetime images during specific times in the cell cycle. Such studies are in progress (Murata et al., personal communications).
FIG. 10.
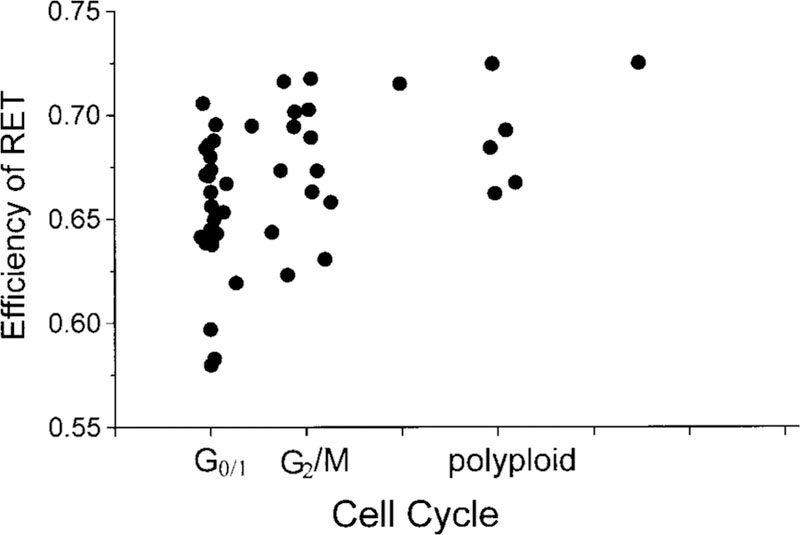
Cell cycle-dependent scattergram of the average efficiency of RET for 50 nuclei. The data points represent 50 nuclei double stained by Ho and 7-AAD. Average RET efficiency was calculated from the average fluorescence intensities of Ho with and without 7-AAD. Cell cycle analysis was based on the total fluorescence intensity of the nucleus.
DISCUSSION
We interpreted the changes in intensity and lifetime images after the addition of 7-AAD in terms of the photophysical phenomenon. It is well known that RET between donors and acceptors bound to DNA results in a multiexponential or nonexponential decay as well as a decrease of fluorescence intensity of the donor. The extent of the decrease depends on acceptor concentration (13,29). For a multiexponential or nonexponential decay, the lifetime heterogeneity in the phase and modulation values increases and the apparent phase lifetime is always shorter than the apparent modulation lifetime (26,27), as seen for Ho in Figures 6 and 7. The results of fluorescence intensity and lifetime image analysis strongly support the presence of a RET mechanism, not simple fluorescence quenching with little or no RET, between Ho and 7-AAD in the nuclei.
We were also interested in the biological relevance of RET in the nuclear DNA. We have found (1) the existence of two cell subpopulations with and without spatial heterogeneity of lifetime images and (2) the efficiency of RET depends on the cell cycle. About 80% of the cells did not show spatially distinct regions (Fig. 8) in lifetime images after addition of the acceptor. This indicated that, on average, the 7-AAD molecules are found and distanced comparable to the Förster distance R0 from Ho in our acceptor concentration. Additionally, a flat lifetime image suggests that there is no significant spatial difference in the AT-to-GC base content in the nuclei to within the resolution of the microscopy images. Somewhat different results were observed for about 20% of the cells (Fig. 9). In these cases, the intensity ratio image, in the absence and presence of 7-AAD, showed regions of lower values that corresponded to regions of high intensity (AT-rich regions) in the intensity image. These cells also showed considerable spatial heterogeneity of the modulation and phase lifetime images. The result indicates that the average distance between Ho and 7-AAD varies throughout the nuclei and is particularly small in the AT-rich regions. The study using smeared metaphase chromosomes reported the RET efficiency to be low in AT-rich bands (20,21). The cell cycle-dependent redistribution of AT- and GC-rich DNA could change the base pair composition of the centers in favor of GC base pairs and show heterogeneity of lifetime images with RET. However, in the interphase cells used in this study, the chromosomes with AT- and GC-rich regions are three dimensionally intermingled. It is well known that the AT-rich regions in DNA are more condensed than the GC-rich regions in interphase cells (31). We believe that the high RET efficiency in AT-rich regions is due to closely spaced DNA strands in the condensed regions, rather than to RET between more closely spaced donors and acceptors on the same DNA helix. High RET efficiency in the G2/M phase is also suggested to be due to condensation of DNA because DNA is more condensed in the G2/M than in the G0/1 phase (15). On the other hand, it is not easy to analyze the cell cycle-associated changes of spatial heterogeneity of lifetime images by visual examination. We have to study spatial heterogeneity using a quantitative method. Such studies are in progress.
Results of many microscopic studies of nuclear DNA which used steady state fluorescence measurements are reported in terms of DNA concentration. We accessed additional information by lifetime imaging, which is independent of the fluorophore concentration, while maintaining sensitivity to numerous chemical and physical factors such as ion concentrations, polarity, binding to macromolecules, or RET. Hence, lifetime imaging of labeled DNA with or without RET may provide new approaches to the analysis of the organization of intracellular DNA.
Acknowledgments
Grant sponsor: National Center for Research Resources; Grant number: RR-08119; Grant sponsor: National Institutes of General Medical Sciences; Grant number: GM-35154.
Footnotes
S. Murata is on leave from First Department of Pathology, Kyoto Pre-fectural University of Medicine, 456 Kajii-cyo Hirokoji Kawaramachi Kamikyo-ku, Kyoto, 602 Japan.
P. Herman is on leave from Institute of Physics, Charles University, Ke Karlovu 5, 121 16 Prague 2, Czech Republic.
LITERATURE CITED
- 1.Ellerton NF, Isenberg I Fluorescence polarization study of DNAproflavine complexes. Biopolymers 1969;8:767–786. [DOI] [PubMed] [Google Scholar]
- 2.Steiner RF, Kubota Y. Fluorescent dye-nucleic acid complexes In: Steiner RF, editor. Excited states of biopolymers. New York: Plenum Press; 1983. p 203–254. [Google Scholar]
- 3.Suh D, Chaires JB. Criteria for the mode of binding of DNA binding agents. Bioorg Med Chem 1995;3:723–728. [DOI] [PubMed] [Google Scholar]
- 4.LePecq J-B, Paoletti C. A fluorescent complex between ethidium bromide and nucleic acids. Physical-chemical characterization. J Mol Biol 1967;27:87–106. [DOI] [PubMed] [Google Scholar]
- 5.Malatesta V, Andreoni A. Dynamics of anthracyclines/DNA interaction: a laser time-resolved fluorescence study. Photochem Photobiol 1988;48:409–415. [DOI] [PubMed] [Google Scholar]
- 6.Genest D, Sabeur G, Wahl P, Auchet J-C. Fluorescence anisotropy decay of ethidium bound to chromatin. Biophys Chem 1981;13:77–87. [DOI] [PubMed] [Google Scholar]
- 7.Markovits J, Ramstein J, Roques BP, LePecq JB. Dynamic structure of DNA complexes. Fluorometric measurement of hydrogen-deuterium exchange kinetics of DNA-bound ethidium dimer and acridineethidium dimer. Biochemistry 1983;22:3231–3237. [DOI] [PubMed] [Google Scholar]
- 8.Ashikawa I, Kinosita K, Ikegami A. Increased stability of the higher order structure of chicken erythrocyte chromatin: nanosecond anisotropy studies of intercalated ethidium. Biochemistry 1985;24: 1291–1297. [DOI] [PubMed] [Google Scholar]
- 9.Urata Y, Itoi H, Murata S, Konishi E, Ueda K, Azumi Y, Ashihara T. From cytofluorometry to fluorescence image analysis. Acta Histochem Cytochem 1991;24:367–374. [Google Scholar]
- 10.Silvia B, Harry AC, Kenneth DB, Zbigniew D. Change in cell nuclei during S phase: progressive chromatin condensation and altered expression of the proliferation-associated nuclear proteins Ki-67, cyclin (PCNA), p106, and p34. Exp Cell Res 1991;196:99–106. [DOI] [PubMed] [Google Scholar]
- 11.Pjura PE, Grzeskowiak K, Dickerson RE. Binding of Hoechst 33258 to the minor groove of b-DNA. J Mol Biol 1987;197:257–271. [DOI] [PubMed] [Google Scholar]
- 12.Embrey KJ, Searle MS, Craik DJ. Interaction of hoechst 33258 with the minor groove of the AT-rich DNA duplex d(GGTAATTACC)2 studied in solution by NMR spectroscopy. Biochemistry 1993;211: 437–447. [DOI] [PubMed] [Google Scholar]
- 13.Sailer BL, Nastasi AJ, Valdez JG, Steinkamp JA, Crissman HA. Differential effects of deuterium oxide on the fluorescence lifetimes and intensities of dyes with different modes of binding to DNA. Histochem Cytochem 1997;45:165–175. [DOI] [PubMed] [Google Scholar]
- 14.Murata S, Kusba J, Piszczek G, Gryczynski I, Lakowicz JR. Donor fluorescence decay analysis for energy transfer in double-helical DNA with various acceptor concentration. Biospectroscopy (submitted). [DOI] [PMC free article] [PubMed]
- 15.Santisteban MS, Brugal G. Fluorescence image analysis of the MCF-7 cycle related changes in chromatin texture. Anal Cell Pathol 1995;9: 13–28. [PubMed] [Google Scholar]
- 16.Trond S, Harald H, Erlend BS, Sverre OL, Harald BS. Differential chromatin structure-dpendent binding of 7-aminoactinomycin D in normal and malignant bone marrow hematopoietic cells. Cancer Res 1992;52:5007–5012. [PubMed] [Google Scholar]
- 17.Jares-Erijman EA, Jovin TM. Determination of DNA helical handedness by fluorescence resonance energy transfer. J Mol Biol 1996;257:597–617. [DOI] [PubMed] [Google Scholar]
- 18.Mergny J-L, Garestier T, RougeÂe M, Lebedev AV, Chassignol M, Thuong NT, HeÂleÁne C. Fluorescence energy transfer betwen two triple helix-forming oligonucleotides bound to duplex DNA. Biochemistry 1994;33:15321–15329. [DOI] [PubMed] [Google Scholar]
- 19.Gohlke C, Murchie AIH, Lilley DMJ, Clegg RM. Kinking of DNA and RNA helices by bulged nucleotides observed by fluorescence resonance energy transfer. Proc Natl Acad Sci USA 1994;91:11660–11664. [DOI] [PMC free article] [PubMed] [Google Scholar]
- 20.Elhanan S, Samuel AL. Enhancement of banding patterns in human metaphase chromosomes by energy transfer. Proc Natl Acad Sci USA 1978;75:5650–5654. [DOI] [PMC free article] [PubMed] [Google Scholar]
- 21.Latt SA, Sahar E, Eisenhard ME. Pairs of fluorescent dyes as probes of DNA and chromosomes. J Histochem Cytochem 1979;27:65–71. [DOI] [PubMed] [Google Scholar]
- 22.Lakowicz JR, Berndt KW. Lifetime-selective fluorescence imaging using an rf phase-sensitive camera. Rev Sci Instrum 1991;62:1727–1734. (Reprinted in SPIE Milestone Series on Optical Tomography, 1997) [Google Scholar]
- 23.Lakowicz JR, Szmacinski H, Nowaczyk K, Berndt K, Johnson ML. Fluorescence lifetime imaging. Anal Biochem 1992;202:316–330. [DOI] [PMC free article] [PubMed] [Google Scholar]
- 24.Lakowicz JR, Szmacinski H, Johnson ML. Calcium concentration imaging using fluorescence lifetimes and long-wavelength probes. J Fluoresc 1992;2:47–62. [DOI] [PMC free article] [PubMed] [Google Scholar]
- 25.Lakowicz JR, Szmacinski H, Nowaczyk K, Lederer WJ, Kirby MS, Johnson ML. Fluorescence lifetime imaging of intracellular calcium in COS cells using QUIN-2. Cell Calcium 1994;15:7–27. [DOI] [PMC free article] [PubMed] [Google Scholar]
- 26.Kilin SF. The duration of photo- and radioluminescence of organic compounds. Opt Spectrosc 1962;12:414–416. [Google Scholar]
- 27.Spencer RD, Weber G. Measurement of subnanosecond fluorescence lifetimes with a cross-correlation phase fluorometer. Ann N Y Acad Sci 1969;158:361–376. [Google Scholar]
- 28.Lakowicz JR. Principles of fluorescence spectroscopy, 2nd edition. New York: Plenum; 1999. p 698. [Google Scholar]
- 29.Maliwal BP, Kusba J, Lakowicz JR. Fluorescence energy transfer in one dimension: frequency domain fluorescence study of DNA. Biopolymers 1995;35:245–255. [DOI] [PubMed] [Google Scholar]
- 30.Mergny JL, Slama-Schwok A, Montenay-Garestier T, Rougee M, Helene C. Fluorescence energy transfer between dimethyldiazaperopyrenium dication and ethidium intercalated in poly d(A-T). Photochem Photobiol 1991;53:555–558. [DOI] [PubMed] [Google Scholar]
- 31.Alberts B, Bray D, Lewis J, Raff M, Roberts K, Watson JD. Molecular biology of the cell, 3rd edition. New York: Garland; 1994. p. 353. [Google Scholar]


