Abstract
We examined the emission spectra and wavelength-dependent anisotropies of the solvent-sensitive fluorophore 4-(dimethylamino)-4′-cyanostilbene (DCS) under condition of fluorescence quenching by stimulated emission. The sample was illuminated with a train of 10 ps pulses at 285 nm, and a train of stimulating pulses at 570 nm which were delayed by a time td relative to the excitation. Stimulated emission of DCS was demonstrated to occur by observation of gain in the long-wavelength beam. Illumination on the long-wavelength side of the emission spectrum with the long-wavelength time-delayed pulses resulted in a blue shift of the emission spectrum, and a progressive decrease of the emission anisotropy as the observation wavelength increased toward the stimulating wavelength. The spectral shifts and wavelength-dependent anisotropies of DCS were more pronounced in more viscous solvents where spectral relaxation is incomplete during the excited state lifetime. Light quenching of DCS in a low-viscosity solvent revealed no spectral shifts or wavelength-dependent anisotropies. Control measurements using acridine orange, which is relatively insensitive to solvent polarity, did not show any spectral shift or wavelength-dependent anisotropy with light quenching. The data for DCS can be explained by the presence of a time-dependent spectral shift and wavelength-selective quenching of the longer wavelength emission. In this model the relaxed state is formed following excitation of the unrelaxed state, and the relaxed state is preferentially quenched by long-wavelength illumination. Comparison of the data with model calculations indicates the presence of at least two spectral relaxation times. These results demonstrate that light quenching by stimulated emission acts selectively based on overlap of the stimulating wavelength with the emission spectrum. Observation of the emission spectrum in the presence of time-delayed and power-controlled long-wavelength pulses can be used to study time-dependent excited state processes.
I. Introduction
The fluorescence spectral properties of solvent-sensitive fluorophores are widely used to study the dynamics of solvent-fluorophore interactions.1–7 In the past few years, several techniques have been applied to investigate solvation dynamics. Fluorescence upconversion measurements have been nicely combined with molecular dynamics simulations in series of papers by Maroncelli’s and Fleming’s groups.1,2,8,9 Ultrafast pump–probe spectroscopy has been used also by Barbara and co-workers.5,6,10 Recently, Hochstrasser and co-workers used femtosecond IR spectroscopy to study solvation of LDS750 dye in various solvents,11 whereas others employed a four-wave mixing technique.12 Lately, the solute dependence of solvation dynamics in polar solvent was studied by Chapman and Maroncelli with using time-resolved Stokes shift measurements.13 These methods require steady-state spectra measurements as well as time-resolved fluorescence decays measurements. To date, almost all such measurements have relied on the use of a single light pulse to excite the sample, followed by measurement of the time-dependent emission. However, recent publications have shown that it is possible to modify the excited state population by the phenomenon of fluorescence quenching by stimulated emission (FQ by SE). If a fluorophore is illuminated at a wavelength which overlaps its emission spectrum, it is possible to cause stimulated emission, which decreases the intensity observed with right-angle observation. For this reason we have referred to this process as “light quenching” and the time-delayed pulses as “quenching” pulses. To date, the effects of FQ by SE have been observed using simultaneous excitation and quenching within the same pulse14–16 and by time-delayed quenching pulses.17,18 FQ by SE or light quenching was observed by the changes in intensity or anisotropy which result from illumination with the stimulating or quenching beam. These experiments suggest a new class of multipulse fluorescence experiments in which the excitation pulse is followed by subsequent longer wavelength pulses to modify the intensity or anisotropy of the excited state population during time-resolved or steady-state measurements of the emission.18
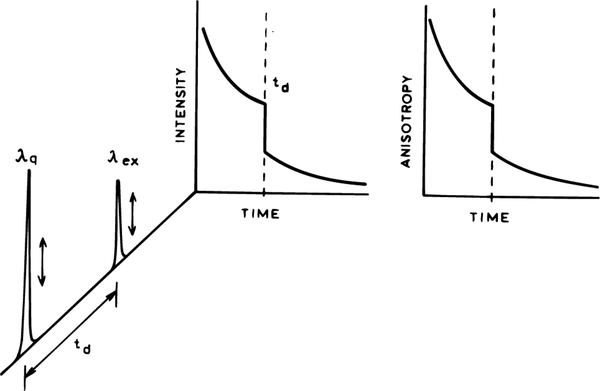
In the present report we describe another effect of FQ by SE, this being spectral shifts of the emission spectra of a solvent sensitive fluorophore. This experiment is illustrated in Scheme 1. The sample is excited with a low-intensity UV pulse. Following a delay time td a second more intense visible pulse arrives at the sample. The wavelength of the “quenching pulse” overlaps the emission spectrum of fluorophore. This pulse causes an instantaneous decrease in the intensity and anisotropy. The emission is observed at right angles, and we observe the excited population remaining in the presence of the quenching pulses. We observed the steady-state emission spectrum and anisotropies of DCS which represent the combined contributions of emission occurring both before and after the quenching pulse. In future studies we will also consider the form of the intensity and anisotropy decays following the quenching pulse.
SCHEME 1: Effect of a Time-Delayed Long-Wavelength Pulse on the Intensity or Anisotropy Decaya.
a The arrows indicate vertically polarized excitation and quenching pulses.
To examine FQ by SE in the presence of spectral relaxation, we selected the solvent-sensitive fluorophore 4-(dimethylamino)-4′-cyanostilbene (DCS), which can be excited near 285 nm and quenched at 570 nm. Upon illumination on the long-wavelength side of the emission of DCS, we observed a shift of the emission spectra to shorter wavelengths. Spectral shifts due to light quenching have been reported for the phthalimide probes in pioneering studies by several Russian spectroscopies.19–21 However, these measurements relied on the use of intense pulses from Q-switch ruby lasers. To the best of our knowledge, spectral shifts due to light quenching have not been reported using modern high repetition rate lasers, and there have been no studies of the effects of the delay time td on the emission spectra. In addition to spectral shifts, we observed that FQ by SE results in a wavelength-dependent emission anisotropy. However, the anisotropy experiments are somewhat more complex and involved due to the possibilities of isomerization and rotational diffusion and will be described elsewhere. The present results suggest that FQ by SE allows selective quenching of the solvent-relaxed state. Fluorescence quenching by time-delayed pulses may thus provide a methodology to study spectral relaxation rotational diffusion and other time-dependent excited state processes of fluorophores or labeled macromolecules.
This paper is organized as follows. Section II describes an overview of FQ by SE and spectral relaxation. Section III describes the optical considerations necessary to observe light quenching. Section IV describes the experimental results. In section V we present how the results can be explained using a two-state model for spectral relaxation. Simulations are used to estimate parameter values which account for the experimental data and to predict the effects of delay time on the observed emission spectra. We recognize that DCS may undergo excited state isomerization as well as spectral relaxation and that this two-state model is not unique. This model was selected for simple comparison with the experimental observations. The main purpose of this paper is to describe a new experimental technique, that of observing the emission spectrum while the excited state population is modified in a time-dependent manner by FQ by SE.
II. Overview of FQ by SE and Spectral Relaxation
The effects of FQ by SE (light quenching) on the intensity and anisotropy of fluorophores, in the absence of spectral relaxation and rotational diffusion, have been described previously.16–18,22 The theory becomes more complex in the presence of time-dependent spectral shifts and will be described in more detail in section V. We now describe the expected effects of FQ by SE in general terms, with specific reference to the emission spectra.
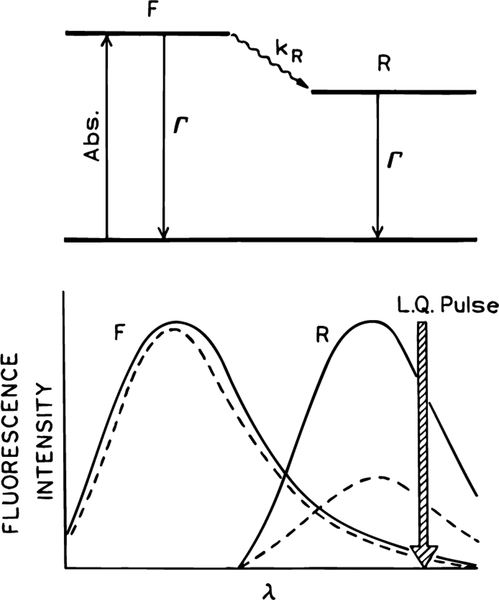
Suppose the fluorophore is sensitive to solvent polarity and undergoes a time-dependent spectral shift following pulsed excitation (Scheme 2). Fluorescence can occur from the initially excited state, referred to as the Frank-Condon or F state, or from the relaxed or R state. The relative amounts of emission from the F and R states depend on the relative value of the mean lifetime of the excited state (τ = Γ−1) and the spectral relaxation time (τR = kR−1), where Γ is the rate of the fluorescence decay and kR is the rate of relaxation from the F to the R state. The rate constant kR should not be confused with the nonradiative decay rate, which is thought to be unaffected by the long-wavelength pulses.
SCHEME 2: Effect of FQ by SE on the Emission Spectrum in the Presence of Spectral Relaxationa.
a (Top) Jablonski diagram for spectral relaxation; (bottom) effect of FQ by SE on the F and R states.
Consider now that the sample is illuminated with a time-delayed long-wavelength pulse which overlaps with the emission of the relaxed state (Scheme 2) and that the lifetime τ is comparable to the relaxation time τR. The relative amounts of fluorescence quenching are known to be proportional to the amplitudes of the emission spectrum at the quenching wavelength,23–26 as expected from the prediction of Einstein for stimulated emission.26 Hence, one expects preferential quenching of the solvent-relaxed emission and a blue shift in the steady-state emission spectrum due to the increased relative contribution of the unrelaxed state (Scheme 2, bottom). The absence of a spectral shift with long-wavelength illumination would suggest that FQ by SE does not depend on emission wavelength or that relaxation is much slower or faster than the time delay td between the excitation and quenching pulses.
III. Materials and Methods
FQ by SE with time-delayed pulses requires precise timing between the excitation and quenching pulses. This was accomplished using the frequency-doubled (285–310 nm) and fundamental (570–620 nm) outputs of a rhodamine 6G dye laser, synchronously pumped by a mode-locked argon ion laser. The pulse repetition rate near 2 MHz was obtained using a cavity dumper, and the pulse widths were near 10 ps.
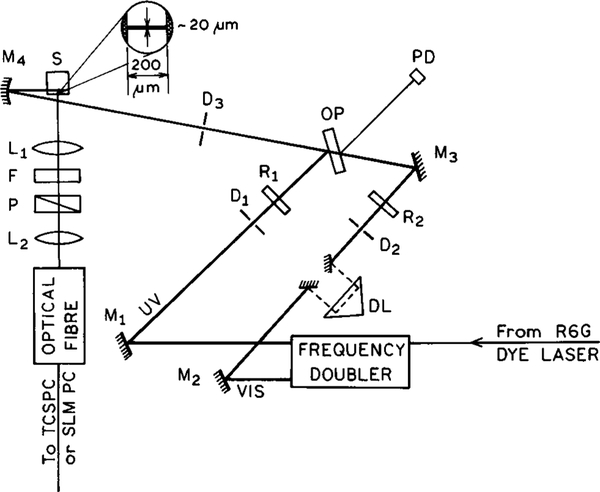
The experimental arrangement for FQ by SE is shown in Figure 1. The sample containing 4-(dimethylamino)-4′-cyanostilbene (DCS) is placed in a standard 1 × 1 cm cuvette, and a spatially defined region of the emission was observed through a 200 μm slit. The concentrations of DCS were near 10−5 in all solvents, calculated from the extinction coefficient of 31 000 M−1 cm−1 at the absorption maxima near 380 nm.
Figure 1.
Experimental arrangement for the two-pulse FQ by SE experiment. L are lenses, P are polarizers, D are diaphragms, M are mirrors, R are polarization rotators, and F are optical filters. The delay line (DL) is placed in the quenching beam. OP is a coated optical plate (dichroic filter) and PD is a reference photodiode, used in time-resolved measurements.
To obtain locally intense illumination, the two beams were focused to about 20 μm diameter at the center of the cuvette using a laser-quality concave mirror, M4, with a focal length of 25 mm. The beams were combined prior to this mirror using an antireflection coated (580–620 nm) optical plate (OP), with the quenching beam passing through the plate and the excitation beam reflecting from the plate. Precise alignment of the beams was essential for the experiment. Further alignment was done by mirrors M3 and M4 mounted in high-precision mirror holders. The optical delay (DL) between the excitation (UV) and quenching (VIS) pulses was controlled by Hollow retroreflector placed on a precise optical rail. This optical arrangement was placed in a 10 GHz frequency-domain fluorometer.27,28 Emission spectra were obtained using an optical fiber to bring the emission to a steady-state fluorometer or to a standard instrument for time-correlated single photon counting,29,30 equipped with a Hamamatsu 6μ microchannel plate PMT (R-28090) and a Tennelec TC-864 time-to-amplitude converter.
For intensity decay measurements the emission of DCS was observed using interference filters, 10 nm band-pass, combined with cutoff glass filters. The frequency-domain intensity decay data were analyzed in terms of the multiexponential model31,32
| (1) |
where I(λ,t) is the wavelength-dependent intensity decay, αi(λ) are the wavelength-dependent amplitudes, and τi are the decay times which are assumed to be independent of emission wavelength (λ). Data for a number of wavelengths scanning the emission spectra were used for calculation of the time-resolved emission spectra as described previously.33
A similar experimental arrangement was used to detect gain in the quenching beam. For these measurements the excitation beam was used without any attenuation to provide the highest accessible excited state population. The quenching beam was attenuated by 108 using neutral-density filters. After passing through the cuvette this visible probe beam was focused onto an optical fiber and the intensity recorded using a SLM 8000 photon counting spectrofluorometer. For these experiments the smaller diameter stimulating beam was focused to lie within the excitation beam. This arrangement is different from the light-quenching experiments, in which the larger diameter quenching beam was positioned over the smaller diameter excitation beam.
IV. Experimental Results
Emission Spectra Properties of DCS.
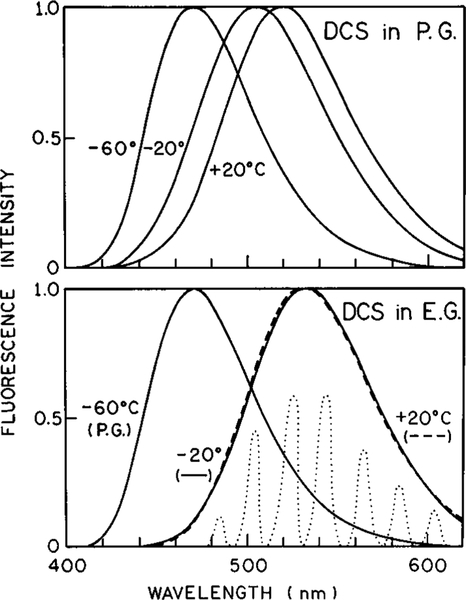
Prior to describing the effects of FQ by SE on DCS, it is informative to understand the spectral properties of DCS in polar solutions. Emission spectra of DCS are shown in Figure 2 in propylene glycol (top) and ethylene glycol (bottom) at −60, −20, and +20 °C. At low temperature the emission is blue-shifted because the vitrified solvent cannot reorient during the excited state lifetime. As the temperature is increased the emission spectra shifts progressively toward longer wavelengths. Essentially the same emission spectra are observed in ethylene glycol at −20 and 20 °C, indicating that spectral relaxation is essentially complete during the excited state lifetime in ethylene glycol at −20 °C or higher. In contrast, the temperature-dependent red shift is not yet complete in propylene glycol at −20 °C, indicating that time-dependent spectral relaxation is not complete during the lifetime of DCS in propylene glycol at 20 °C. Since picosecond time delays in light quenching are easily obtained, we selected DCS in ethylene glycol at −20 °C, where relaxation is nearly completed during the excited state lifetime, to test the resolution of light quenching to study rapid spectral relaxation.
Figure 2.
Emission spectra of DCS in propylene glycol (top) and ethylene glycol (bottom). The dotted lines in the bottom panel show the emission seen through the interference filters used to determine the time-resolved emission spectra.
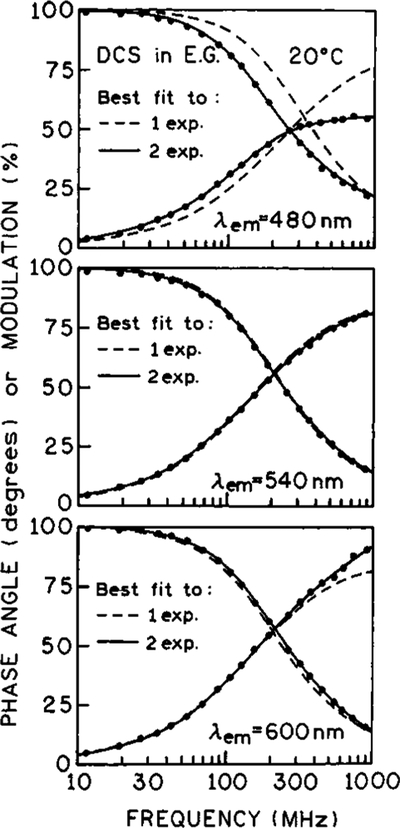
In later experiments we describe the use of time-delayed light quenching to estimate the spectral relaxation time of DCS in ethylene glycol. To provide a basis for comparison, we used frequency-domain measurements to determine the rate of spectral relaxation of DCS in ethylene glycol at 20 °C. Intensity decay data were recorded at wavelengths scanning the emission spectrum of DCS using the interference filters shown in Figure 2. Typical frequency responses on the blue, central, and red sides of the emission spectra are shown in Figure 3. On the blue side of the emission (480 nm) a multiexponential decay was observed (Table 1). The intensity decay of DCS becomes nearly a single exponential near the emission peak at 535 nm. At higher wavelengths (600 nm) the phase angles exceed 90°, which demonstrates that the emission at this wavelength is not the result of direct excitation but rather results from a relaxation process.34
Figure 3.
Frequency-domain intensity decays of DCS in ethylene glycol at 20 °C observed on the blue (top), center (middle), and red (bottom) side of the emission spectra.
TABLE 1:
Global Analysisa of the Intensity Decay of DCS in Ethylene Glycol at 20 °C
| wavelength (nm) | τ1 = 77 psc | τ2 = 1088 psc | χR2 | ||
|---|---|---|---|---|---|
| α1(λ) | f1b(λ) | α2(λ) | f2(λ) | ||
| 480 | 0.680 | 0.130 | 0.320 | 0.870 | 1.5b (176.9)d |
| 500 | 0.466 | 0.058 | 0.534 | 0.942 | |
| 520 | 0.308 | 0.030 | 0.692 | 0.970 | |
| 540 | 0.000 | 0.000 | 1.000 | 1.000 | |
| 560 | −0.043 | −0.003 | 0.957 | 0.997 | |
| 580 | −0.135 | −0.011 | 0.865 | 0.989 | |
| 600 | −0.294 | −0.028 | 0.706 | 0.972 | |
The χR2 values were calculated using δφ = 0.3° and δm = 0.007, as the uncertainties in the phase and modulation, respectively.
The value of fi(λ) describes the fractional steady state intensity at each wavelength λ and is given by fi(λ) = αi(λ)τi/Σαj(λ)τj.
Decay times from the global analysis for all wavelengths.
The χR2 values are for global analysis of the data at all emission wavelengths. The number in parentheses is the χR2 value obtained for the single decay time fit, and the value of 1.5 is for the global two decay time fit.
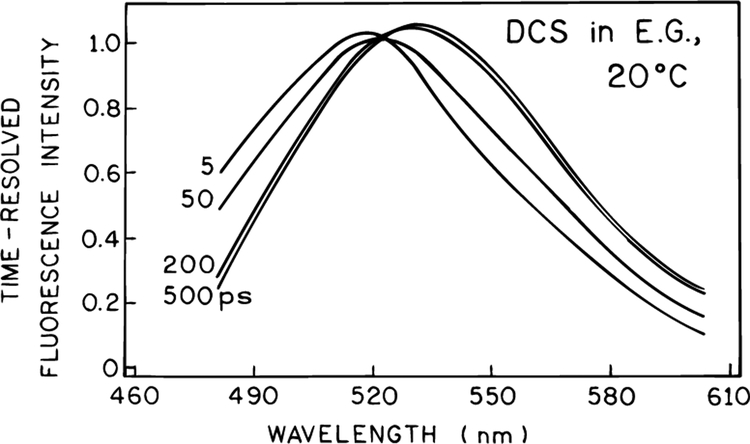
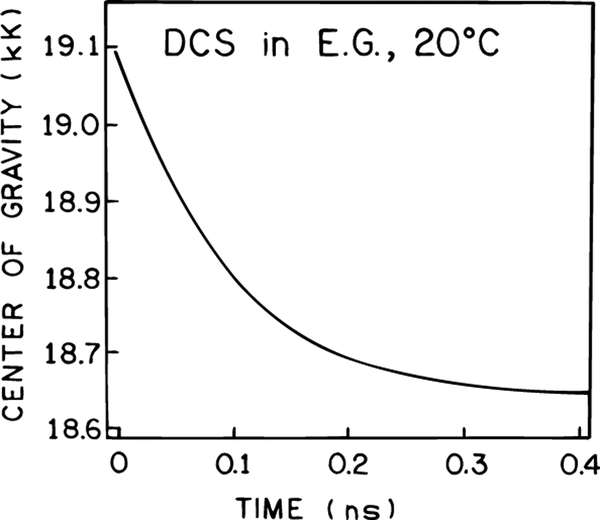
The data were analyzed globally using two wavelength-independent decay times and wavelength-dependent amplitudes. The wavelength-dependent decay times are summarized in Table 1. As the emission wavelength increases, one observes a component with a negative preexponential factor, which is also proof of an excited state process.35,36 These data were used to calculate the time-resolved emission spectra of DCS (Figure 4) and the time-dependent emission center of gravity (Figure 5). The time-resolved spectra show that the spectral relaxation occurs dominantly within the first 100 ps and is essentially complete by 200 ps (Figure 4). The emission center of gravity (CG) is close to its long-time limit by 200 ps (Figure 5). However, closer examination of the time-resolved emission spectra in Figure 4 shows that at 5 ps the emission spectrum of DCS is already strongly red-shifted from the unrelaxed state seen at −60 °C (Figure 2). This suggests that spectral relaxation of DCS occurs dominately in less than 5 ps, with the remaining relaxation occurring on the 100−200 ps time scale.
Figure 4.
Time-resolved emission spectra of DCS in ethylene glycol at 20 °C.
Figure 5.
Time-resolved emission center of gravity of DCS in ethylene glycol at 20 °C.
These experiments suggest that DCS in ethylene glycol at 20 °C is well suited for testing the use of light quenching to investigate time-dependent spectral relaxation. Spectral relaxation appears to occur on at least two time scales (<5 and 100 ps), and the effects of light quenching should thus be sensitive to the time delay td. Unless indicated otherwise, the description of experimental results refers to these specific conditions. Our R6G dye laser can provide quenching pulses at the long-wavelength side of the emission near 575 nm (Figure 1). The emission at this wavelength is dominantly due to the solvent-relaxed state of DCS. There is little contribution from the unrelaxed state at 575 nm, as can be seen from the low intensity of the DCS emission at 575 nm when the temperature is reduced to −60 °C (Figure 2). Hence, light quenching with 575 nm illumination should reveal whether the relaxed state will be selectively quenched and whether light quenching can be used to detect spectral relaxation on the 5–100 ps time scale. Of course, the ultimate temporal resolution will depend on the pulse widths, and still higher resolution can be expected with femtosecond pulses as compared to the present pulse widths near 10 ps.
Time-Dependent FQ by SE of DCS.
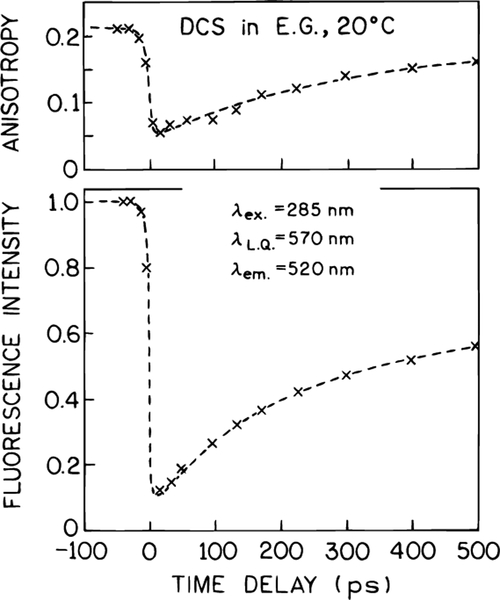
We used time-correlated single photon counting (TCSPC) to investigate the effect of a time-delayed 575 nm pulse on the intensity and anisotropy decay of DCS, using the apparatus shown in Figure 1. From the slope of the time-dependent anisotropy prior to arrival of the quenching pulse one can estimate a rotational correlation time of about 2 ns. Hence, for the delay times of 15 and 48 ps described below, the emission is mostly polarized upon arrival of the quenching pulse. Upon arrival of the quenching pulse at td = 680 ps there is a decrease in the intensity (top) and anisotropy (bottom) (Figure 6). Following the quenching pulse the intensity continues with its original decay time near 1 ns. The decrease in intensity can be understood as being due to a decrease in the observed excited state population. Of course, the decrease in emission is due to stimulated emission which occurs along the same direction as the quenching beam. The decrease in anisotropy is a result of the photoselective property of FQ by SE and our use of vertically polarized excitation and quenching beams. It is known that light quenching displays the same cos2 θ dependence as does absorption, where θ is the angle between the electric vector of the incident light and the transition moment of the molecule.16,37 Consequently, FQ by SE preferentially depletes the vertically or nearly vertically oriented fluorophores, which results in a decreased anisotropy. These results demonstrate that the effect of the quenching pulse occurs within the time resolution of the instrument, which argues against thermal effects due to the intense 575 nm illumination. It is known that the lifetime of DCS is strongly dependent on temperature and if heating occurred one would expect a shorter lifetime.
Figure 6.
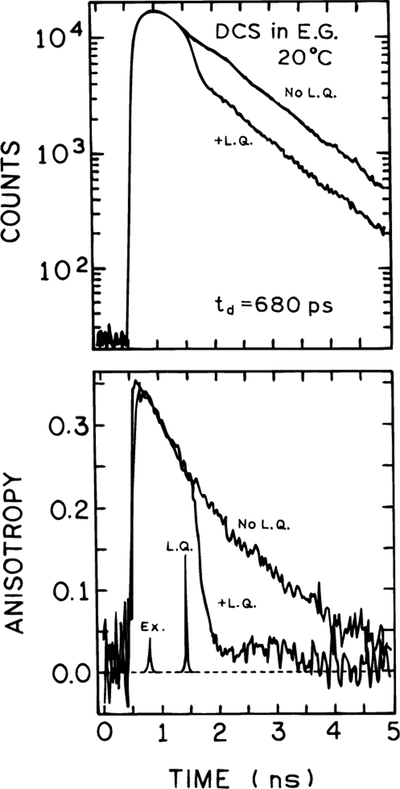
Effect of a time-delayed quenching pulse on the intensity (top) and anisotropy decay (bottom) of DCS. In the absence of FQ by SE the observed lifetime and correlation times are 1.1 and 1.67 ns, respectively.
It is not necessary to use time-resolved measurements to obtain useful information using FQ by SE. One can measure the steady-state intensity or anisotropy as the sample is continuously illuminated with excitation and quenching pulses (Figure 7). As the delay time is increased, the extent of quenching is also decreased (bottom), as in the change in anisotropy (top). This effect is easily understood. At longer delay times the excited state population has decayed, and there are fewer excited state molecules to be quenched by the stimulating beam. Similarly, at longer delay times a greater fraction of the emission has already occurred, so that only smaller changes on anisotropy are observed since a smaller portion of the excited state population is affected by the quenching pulse. As mentioned above, more detailed anisotropy data in presence of FQ by SE will be described in a separate paper.
Figure 7.
Effect of a time-delayed or the steady-state anisotropy (top) and intensity (bottom) of DCS.
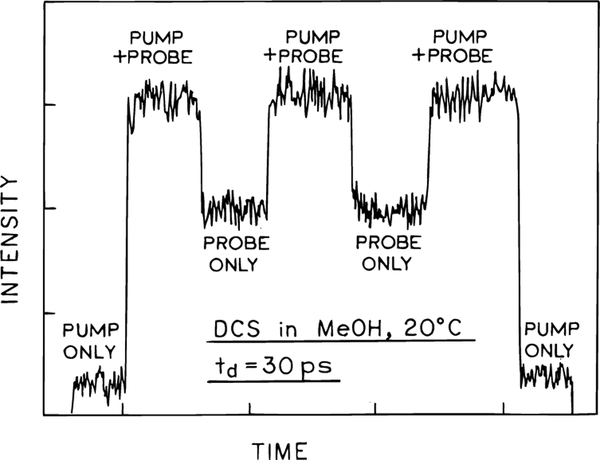
Prior to describing our detailed experimental results for FQ by SE of DCS we describe the detection of stimulated emission. This experiment was performed to support our assertion that the changes in intensity seen in Figures 6 and 7, and below, are due to stimulated emission. In order to detect stimulated emission, the excitation was not attenuated, but rather we used the full available power of about 2 mW at 3.8 MHz, so as to provide the highest practical excited state population. The quenching beam was attenuated 108-fold using neutral-density filters, and after passing through the excited volume directed to the detector via an optical fiber. The intensities observed in the presence of the excitation, quenching, or both beams is shown in Figure 8. The excitation beam alone results in a low signal of less than 10% of full scale (Figure 8). The stimulating beam results in a signal near 50% full scale. The presence of both the excitation and quenching beam results in a 2-fold amplification of the quenching beam, an effect which can only be attributed to simulated emission. These results of detected stimulated emission provides strong support for interpretation of the subsequent results as due to FQ by SE.
Figure 8.
Detection of stimulated emission of DCS at 578 nm. The pump pulses at 289 nm were from the UV output of the frequency-doubled dye laser, and the probe pulses were from the fundamental output at 578 nm (see Figure 1).
Effects of Light Quenching on the Emission Spectra of DCS.
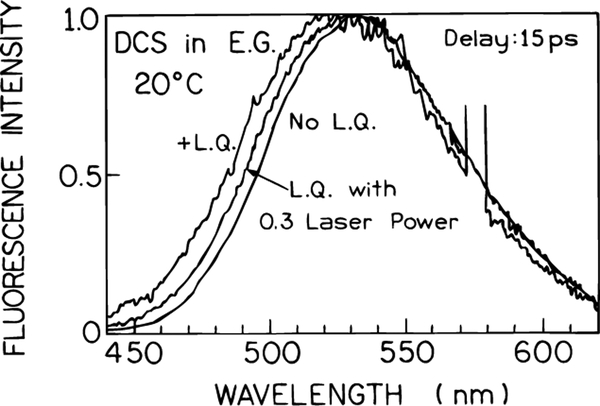
The results shown in Figures 2–5 demonstrated that spectral relaxation of DCS occurred in 5–100 ps. We questioned whether light quenching on the long-wavelength side of the emission would result in selective depletion of the solvent-relaxed state or uniform depletion of DCS at all emission wavelengths. Emission spectra are shown in Figure 9 for unquenched DCS, and for increasing laser power at 575 nm at a delay time of 15 ps. The intensity-normalized spectra show that the emission spectra are blue-shifted by 575 nm light quenching. These results demonstrate that stimulated emission selectively occurs for the solvent relaxed state whose emission wavelength overlaps with the light-quenching wavelength.
Figure 9.
Effect of FQ by SE (td = 15 ps) on the emission spectra of DCS in ethylene glycol at 20 °C.
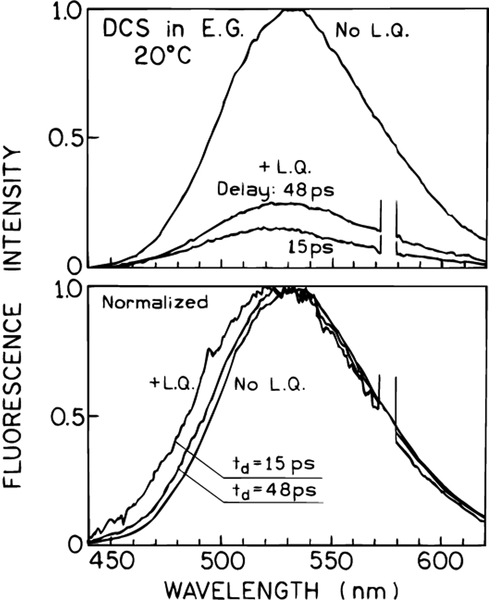
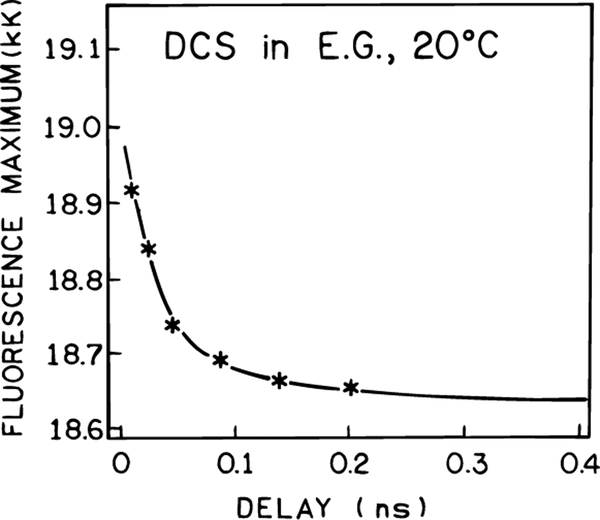
Additional spectra are shown in Figure 10 for different delay times of 15 and 48 ps but with comparable laser power. The extent of light quenching is less at the longer 48 ps delay time, and the blue shift is smaller than seen for the 15 ps delay time. These results can be understood as due to there being more time for both emission and spectral relaxation with a longer delay time. In fact, one can use the dependence of the spectral shift on the delay time to obtain information on the rate of spectral relaxation. The fluorescence maximum for various delay times is shown in Figure 11. These data are roughly comparable to the time-resolved center of gravity shown in Figure 5. A quantitative theory for interpretation of such spectral data in terms of the spectral relaxation times is described in section V.
Figure 10.
Effect of various time delays on the emission spectrum of DCS in ethylene glycol at 20 °C.
Figure 11.
Effect of td on the emission maximum of DCS.
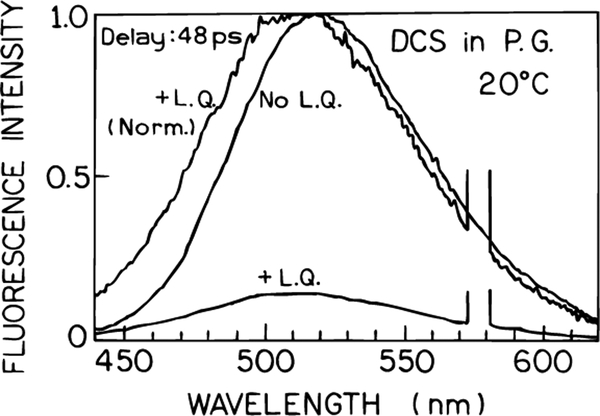
We used several additional samples to demonstrate that the spectral shifts seen in Figures 9–11 were in fact related to the rates of spectral relaxation. Emission spectra for DCS in the more viscous solvent propylene glycol are shown in Figure 12. One notices that the spectral shift for td = 48 ps is several fold larger than observed in ethylene glycol under similar conditions (Figure 10, td = 48 ps, bottom panel). This is consistent with the emission spectra shown in Figure 2 which indicated that the spectral relaxation of DCS in propylene glycol is slower than in ethylene glycol.
Figure 12.
FQ by SE of DCS in propylene glycol at 20 °C.
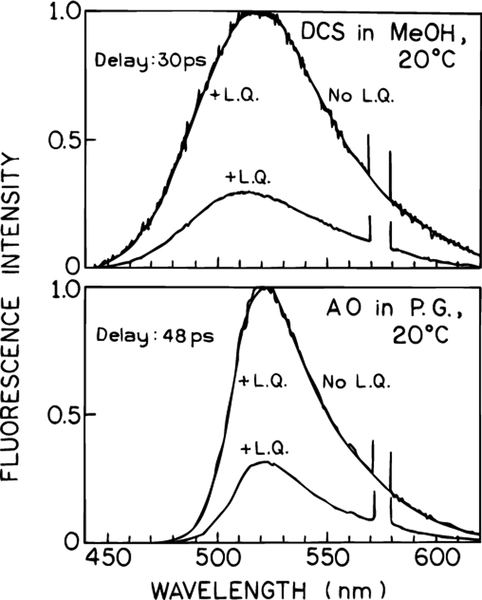
We questioned whether the spectral shifts seen in Figures 9–12 were due to the combined effects of spectral relaxation and wavelength-selective light quenching, or had some other origin. We examined samples where solvent relaxation was either complete prior to arrival of the quenching pulse, or where time-dependent spectral shifts were not expected to be significant. To obtain complete relaxation we chose DCS in the highly fluid solvent methanol, where the relaxation is expected to be complete in 30 ps.38 In this case light quenching decreased the emission intensity but did not result in any spectral shift (Figure 13, top). Additionally, we examined acridine orange in propylene glycol at 20 °C (Figure 13, bottom). Acridine orange is relatively insensitive to solvent polarity, so that there is only one emitting state. No spectral shift was seen for acridine orange with light quenching (Figure 13, bottom). There is only one emitting species to be affected by light quenching, and one finds a uniform decrease in intensity across the emission spectrum of acridine orange. These results demonstrate that light quenching can be used to selectively deplete those fractions of the fluorophore population which overlap with the quenching wavelength and is sensitive to the rates and extent of spectral relaxation.
Figure 13.
FQ by SE of DCS in methanol (top) and of acridine orange in propylene glycol (bottom).
V. Theory and Discussion
The objective of this paper is to demonstrate the usefulness of FQ by SE in studying the excited state processes, not to develop the advanced relaxation models. Therefore, we attempted to describe our initial experimental results within the framework of a reasonable and simple model. Of course, in the future we will adopt also more complex models for excited state processes with FQ by SE.
The experimental data presented in this paper can be explained by a two-state model (Scheme 2). The emission spectra of the initial (F) and relaxed (R) states are assumed to be centered at and , respectively. Both states are assumed to return to the ground state with the rate constant Γ = 1/τ, but in general these rates can be unequal for the F and R states. The process of spectra relaxation from the initially excited state into the relaxed state is assumed to be heterogenous, i.e., described by more than one relaxation rate. This is justified by our observation that the time-resolved emission spectrum of DCS very shortly after excitation (~5 ps) is almost completely shifted toward the spectrally relaxed emission (Figure 4), as can be judged by comparison with the unrelaxed emission at −60 °C (Figure 2). This indicates the presence of at least one additional relaxation rate which is much faster than the value (~10 ns−1) found from the analysis of the time-resolved spectra for times ≥5 ps. Similarly, two different relaxation rates have been reported for the molecule DCM,39,40 which is structurally similar to the DCS molecule discussed in this paper. Multiexponential relaxation processes have been also reported for many other systems, e.g., refs 41 and 42. Although it is difficult to recover more than two relaxation rates from our data, for clarity of the derived expressions we assume presence of n relaxation rates kRj = 1/τRj (j = 1, …, n) with respective amplitudes presence of n relaxation rates kRj = 1/τRj (j = 1, …, n) with respective amplitudes ξj. The amplitudes ξj are normalized according to the equation Σjξj) 1. Rotational diffusion of the fluorophore is assumed to be described by one correlation time Θ. In this simple model we do not consider the effects due to possible isomerization in the excited state.
FQ by SE and Fluorescence Decays of the Solvent-Sensitive Fluorophore.
For simplicity, we assumed the shapes of the emission spectra for both the unrelaxed and relaxed species is Gaussian on the wavenumber scale and have the same half-width hw = 2.355σ. These shapes are described by
| (2) |
| (3) |
where is the energy in cm−1 and and are the maxima on the wavenumber scale. The representations of eqs 2 and 3 on the wavelength scale are
| (4) |
| (5) |
where and . The integrals of these shapes are normalized to unity. If the emission maxima and of the F and R states are known, then the parameters λF and λR can be calculated from the relations and .
The fluorescence decays IF(λ,t) and IR(λ,t) of the F and R states at any wavelength λ can be written as the products of the amplitude factors IF(t), IR(t) and the shape factors fF(λ), fR(λ)
| (6) |
| (7) |
Following δ-pulse excitation the fluorescence decays IF(t), IR(t) are then given by
| (8) |
| (9) |
where γj = Γ + kRj and IF0 is the total fluorescence intensity of the unrelaxed species at time t = 0, and τ = Γ−1 is the lifetime in the absence of spectral relaxation. We assumed that the relaxation is irreversible, as is known to be true for coumarins in polar solvents.43 For n = 1 eqs 8 and 9 reduce to the respective solutions for homogenous relaxation.38,44–45
In the presence of FQ by SE the intensity decays (8) and (9) display an instantaneous decrease in intensity at the arrival time of the quenching pulse at time t = td
| (10) |
where
| (11) |
| (12) |
The parameters qF, qR, and qE describe the relative changes caused by the quenching pulse in the excited F and R populations and in the entire (E) excited fluorophore population, respectively. These parameters can be expressed as qk = (nkb − nka)/nkb, where nkb and nka are the respective numbers of excited molecules immediately before (b) and after (a) the quenching pulse and k is F, R, or E. The fluorescence decay given by the second line of eq 11 takes into account the possibility of repopulation of the R state after its quenching by light, due to the relaxation from the usually less quenched F state. Notice that eqs 8 and 9 describing the fluorescence decays in the absence of light quenching may be easily obtained from eqs 10 and 11 by setting qF = qR = 0.
Influence of FQ by SE on Steady-State Fluorescence Spectra.
In the presence of FQ by SE the shapes and amplitudes of the steady-state fluorescence spectra of the unrelaxed and relaxed species can be obtained by integration of eqs 6 and 7 over time
| (13) |
| (14) |
where the amplitude factors JF and JR are given by
| (15) |
| (16) |
Equations 15 and 16 describe the case without FQ by SE when qF = qR = 0. The steady-state fluorescence spectrum J(λ) of the solvent-sensitive fluorophore, resulting from simultaneous emission of both species, is a sum of eqs 13 and 14
| (17) |
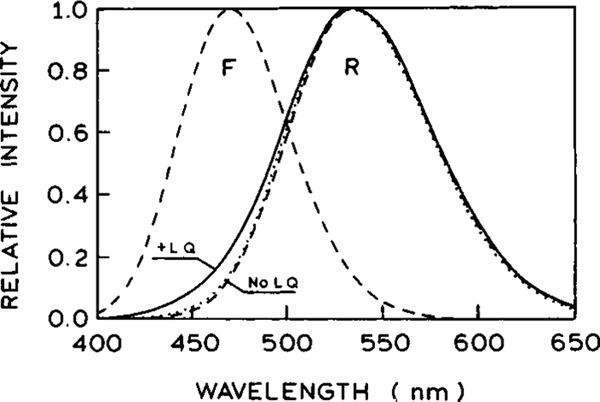
We used the theory discussed above, eqs 13–17, to calculate the steady-state emission spectra in the absence (dotted lines) and presence (solid lines) of light quenching (Figure 14). The dashed lines show the assumed emission spectra of the pure unrelaxed and/or relaxed forms of the fluorophore. All spectra are normalized to unity at the maximum. The values of parameters (Table 2) were chosen to simulate the emission spectra of the DCS in ethylene glycol at 20 °C: , , σ = 1300 cm−1, τ = 1 ns. The light-quenching parameters are td = 15 ps, qF = 0.2, qR = 0.95. The difference between qF and qR reflects the higher probability of quenching of the relaxed form due to the different emission spectra of species F and R at the quenching wavelength (575 nm). The process of relaxation was assumed to be described by τR1 = 2 ps, ξ1 = 0.9, τR2 = 120 ps, ξ2 = 0.1. In the absence of FQ by SE the emission spectrum is essentially that of the relaxed state (no LQ, …). In the presence of FQ by SE the simulations show that with the parameter values in Table 1, light quenching changes the shape on the blue side of the steady-state spectrum, whereas the red side remains almost unchanged in the normalized emission spectra. This behavior is similar to that observed experimentally (Figures 10, 11, and 12). Despite the relatively large assumed value of the parameter qR, the overall shift of the spectrum due to the FQ by SE is rather small. This is mainly caused by the repopulation of the R state by relaxation of the partially quenched F state after the quenching pulse.
Figure 14.
Normalized steady-state fluorescence spectra calculated from eqs 13–17 in the absence (dotted line) and presence (solid line) of FQ by SE. The values of parameters are chosen to simulate the emission spectra of the DCS shown in Figure 8 and are detailed in Table 2. The dashed lines show the assumed emission spectra of the pure unrelaxed and/or relaxed forms of the fluorophore.
TABLE 2:
Parameter Values Used in Simulations
|
(nm) |
(nm) |
σ (103 cm−1) |
τ (ns) |
qF | qR |
τR1 (ps) |
ξ1 |
τR2 (ps) |
ξ2 |
|---|---|---|---|---|---|---|---|---|---|
| 470 | 535 | 1.3 | 1.0 | 0.2 | 0.9 | 2.0 | 0.9 | 120 | 0.1 |
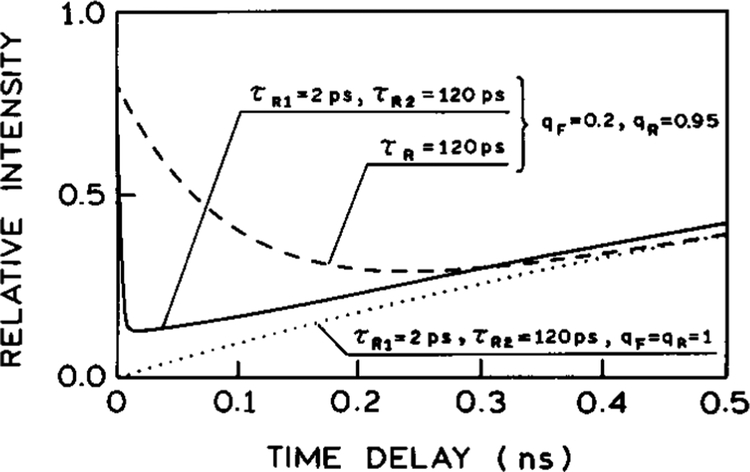
The dependence of the steady-state intensity on the time delay of the quenching pulse, calculated from eq 17, is shown in Figure 15. The intensities are calculated for λobs = 520 nm and normalized to the respective intensities calculated in the absence of FQ by SE. The solid line shows the results obtained for parameter values listed in Table 2, with two spectra relaxation times 2 and 120 ps. In this case the relative steady-state intensity starts from the value 0.8 (reflecting the assumption qF = 0.2, Table 2) at td = 0. In our present theory td = 0 means that the excitation and quenching pulses are δ-functions and the quenching pulse arrives immediately after the excitation pulse. The intensity decreases rapidly with td to the value at ~0.1 at td ≈ 20 ps, and then monotonically increases to achieve unity at td = ∞. One can see that these results are similar to those obtained experimentally (Figure 7, bottom panel). We note that there was some uncertainty in the time delay near zero in our experiments, so that we are not certain of the time scale of the rapid intensity drop observed for DCS. Nonetheless, it is evident that there is a rapid decrease in intensity near td = 0, followed by a slower rise for longer delay times. If only a single relaxation time of 120 ps is present, then the simulations show a more gradual decrease with increasing values of td (Figure 15, dashed line). The experimental data also requires that both the F and R states be quenched, but to different extents. The dashed line in Figure 15 shows the results of the analogous simulation assuming only one relaxation time τR = 120 ps. In this case the simulated dependence of the steady-state intensity on the delay time significantly differs from the experimental results, indicating the necessity of two relaxation times to stimulate the experimental results.
Figure 15.
Dependence of the steady-state intensity of the solvent-sensitive fluorophore on the time delay of the quenching pulse. The intensities are calculated for λobs = 520 nm and normalized to respective intensities calculated in the absence of FQ by SE. The solid line is for the parameter values from Table 2, the dashed line shows the analogous results obtained assuming only one relaxation time τR = 120 ps, and the dotted line illustrates the case with 100% quenching at time t = td (qF = qR = 1), and represents the fraction of the emission occuring between t = 0 and t = td, relative to the absence of FQ by SE.
Effect of FQ by SE on the Center of Gravity of the Emission Spectrum of a Solvent-Sensitive Fluorophore.
The position of the center of gravity (CG) of the emission spectrum of the solvent-sensitive fluorophore moves with time. In our description the initial (t = 0) and final (t = ∞) positions of the CG are given by and , respectively. For intermediate times the value of can be calculated as
| (18) |
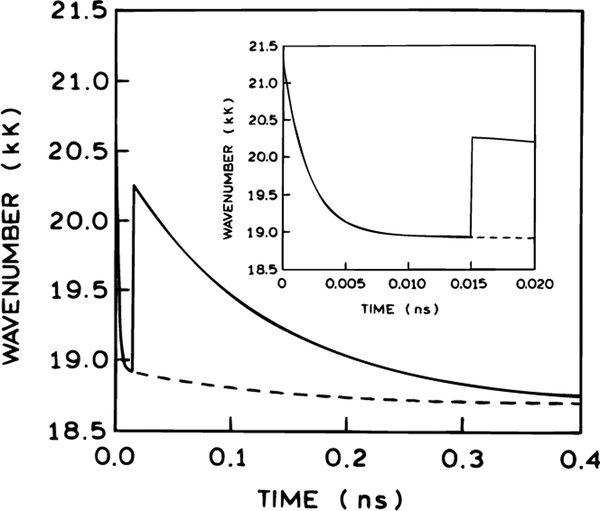
The results of calculations using eq 18 and the parameters values listed in Table 2 are illustrated in Figure 16. In the absence of FQ by SE (dashed line) the change of the position of the CG is biexponential and reflects the presence of two relaxation times τR1 and τR2. At times 10–15 ps after excitation the relaxation characterized by the shorter lifetime (τR1) is practically complete. The part of the dashed line for t > 10 ps corresponds to the experimental data shown in Figure 5. The solid line in Figure 16 shows the time dependence of the position of the CG on time in the presence of FQ by SE. The quenching pulse arrives with a delay td = 15 ps after the excitation pulse and significantly shifts the CG towards the blue region. This shift decays with time due to the process of relaxation.
Figure 16.
Dependence of the position of the center of gravity of the emission spectrum on time in the presence (solid line) absence (dashed line) of FQ by SE calculated from eq 18. Parameter values are listed in Table 2. The insert shows the first 20 ps in more detail.
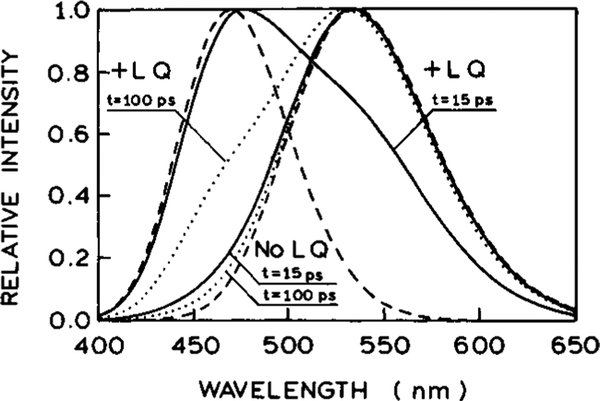
It is informative to examine the instantaneous time-resolved emission spectra which would be observed in the absence and presence of light quenching at various times t following the excitation pulse. These spectra are shown in Figure 17. At t = 15 ps, prior to the quenching pulse, the emission spectrum is almost completely relaxed to the R state (solid line, no LQ, t = 15 ps). The quenching pulse at td = 15 ps results in a large blue shift of the emission spectrum (solid line, +LQ, t = 15 ps). The emission spectrum then continues to shift to longer wavelengths with a relaxation time of 120 ps. A potentially valuable future of this effect is that the second slower relaxation term now makes the dominant contribution to spectral relaxation. For example, a significant fraction of the unrelaxed state can be seen at t = 100 ps, even though this state is nearly absent at t = 15 ps without light quenching. In the absence of FQ by SE the slower relaxation accounts for a small portion of the total spectral shift. The relaxation appears to be slower because light quenching does not create the F state, but rather removes part of the red-shifted population. In this population the fast part of the relaxation is already complete. These simulations suggest that time-delayed FQ by SE will be valuable for studies of spectral relaxation and in particular can be used to alter the fractions of the spectral shift which decay by the faster and slower relaxation processes. Such altered contributions can be expected to provide additional information of complex relaxation processes.
Figure 17.
Instantaneous time-resolved emission spectra in the absence (no LQ) and presence (+LQ) of FQ by SE. The time delay of the quenching pulse is 15 ps, and other assumed parameter values are listed in Table 2. The solid lines show the time-resolved emission spectra observed at td = 15 ps (immediately after the quenching pulse when the FQ by SE is present) and the dotted lines show the spectra observed at t = 100 ps following a quenching pulse at td = 15 ps. The dashed lines show the emission spectra of the F and R states.
In the present experiments we did not recover the instantaneous spectra after light quenching, which will require further development of our experimental methods, theory and software. However, we were able to recover the steady state emission spectra with the time-delayed quenching pulses. The position of the CG of the steady-state fluorescence spectra can be calculated as
| (19) |
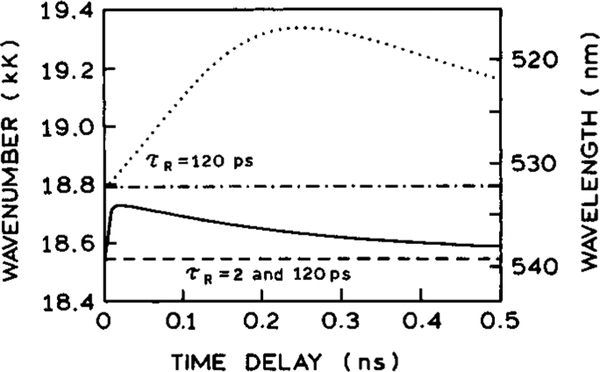
The influence of light quenching on given by eq 19 depends on values of parameters qF and qR and on the time delay, td, of the quenching pulse. Figure 18 (solid line) shows how the position of the steady-state emission CG depends on td for the parameter values listed in Table 2. For comparison, the dashed line in this figure shows the corresponding position of the CG in the absence of light quenching. For times longer than 20 ps the emission spectra with light quenching display smaller blue shifts for longer delay times. This effect can be understood as selective removal of the relaxed form by the light quenching. For longer delay times over 20 ps there is less remaining F state. Consequently, even with depletion of the R state by light quenching, a smaller blue shift is observed. One can see that there exists a specific value of time delay near 10 ps at which the shift of the CG is maximal and that at very short delays the position of the CG is not affected. This effect can be explained by the fact that at very short times less than 10 ps the concentration of the relaxed form is very low and only the unrelaxed form is available to be quenched. However, FQ by SE of the unrelaxed form does not affect the CG because relaxation (after the quenching pulse) of the remaining unquenched part of the unrelaxed form has the same properties as in the absence of FQ by SE. The effects of time delay on the emission spectra depend strongly on whether spectral relaxation proceeds with one or two relaxation times. The dotted and dash-dotted lines in Figure 18 show the results analogous to these shown by the solid and dashed lines, but assuming only one relaxation time τR = 120 ps. One can see that absence of the faster relaxation results in a steady-state CG shifted more toward the blue region than in the presence of the faster relaxation. This can be seen from the dotted line for τR = 2 ps and τRz = 120 ps which is below that of the dashed-dotted line for τR = 120 ps. Additionally, the maximum spectral shift is observed for a much longer delay time near 250 ps when there is only a single relaxation time. It is evident from Figure 18 that the spectral shift of the CG is highly sensitive to td and the presence of one or more relaxation times.
Figure 18.
Effect of time delay of the quenching pulse on the position of the steady-state emission center of gravity (solid line) for the parameter values are listed in Table 2. The dashed line shows the position of the center of gravity in the absence of FQ by SE. The dotted and dash-dotted lines show the analogous simulations assuming only one relaxation time τR = 120 ps.
In summary, the experimental results demonstrated that solvent sensitive fluorophores can be quenched in a wavelength-selective manner, which for long-wavelength quenching depends on the extent of spectral relaxation. The steady-state emission is strongly dependent on the rates of spectral relaxation and can be expected to reveal whether spectral relaxation proceeds by one or more relaxation times. These experimental data and simulations suggests that time-delay light quenching can be particularly informative for studies of complex relaxation processes.
Acknowledgment.
This work was supported by grants RR07510, RR10416, and RR-08119, and in part by grant P01–48571 (Z.G.) from the National Institutes of Health. J.R.L. also expresses appreciation for support from the Medical Biotechnology Center at the University of Maryland.
Glossary
- AO
Acridine orange
- CG
center of gravity
- DCS
4-(dimethylamino)-4′-cyanostilbene
- EG
ethylene glycol
- FD
frequency domain
- FQ by SE
fluorescence quenching by stimulated emission
- LQ
light quenching
- PG
propylene glycol or 1,2-propanediol
- TCSPC
time-correlated single photon counting
- TD
time domain
References and Notes
- (1).Maroncelli J J. Mol. Liq 1993, 57, 1–37. [Google Scholar]
- (2).Jimenez R; Fleming GR; Kumar PV; Maroncelli M Nature 1994, 471–473. [Google Scholar]
- (3).Simon JD; Rorsky P Nature 1994, 270, 263–269. [DOI] [PubMed] [Google Scholar]
- (4).Rips I; Klafter J; Jortner J J. Chem. Phys 1988, 89(7), 4288–4299. [Google Scholar]
- (5).Barbara PF; Jarzeba W Acc. Chem. Res 1988, 21, 195–199. [Google Scholar]
- (6).Jarzeba W; Walker GC; Johnson AE; Kahlow MA; Barbara PF J. Phys. Chem 1988, 92, 7039–7041. [Google Scholar]
- (7).Su S-G; Simon JD J. Phys. Chem 1987, 91, 2693–2696. [Google Scholar]
- (8).Maroncelli M; MacInnis J; Fleming GR Science 1989, 243, 1674–1680. [DOI] [PubMed] [Google Scholar]
- (9).Rosenthal SJ; Jiminez R; Fleming GR; Kumar PV; Maroncelli M J. Mol. Liq 1994, 60, 25–56. [Google Scholar]
- (10).Horman A; Jarzeba W; Barbara PF J. Phys. Chem 1995, 99, 2006–2015. [Google Scholar]
- (11).Lian T; Kholodenko Y; Hochstrasser RM J. Phys. Chem 1995, 99, 2546–2551. [Google Scholar]
- (12).Goldberg SY; Bart E; Meltsin A; Fainberg BD; Huppert D Chem. Phys 1994, 183, 217–233. [Google Scholar]
- (13).Chapman CF; Fee RS; Maroncelli M J. Phys. Chem 1995, 99, 4811–4891. [Google Scholar]
- (14).Gryczynski I; Bogdanov V; Lakowicz JR J. Fluoresc 1993, 3, 85–92. [DOI] [PubMed] [Google Scholar]
- (15).Gryczynski I; Bogdanov V; Lakowicz JR Biophys. Chem 1994, 49, 223–232. [DOI] [PubMed] [Google Scholar]
- (16).Lakowicz JR; Gryczyński I; Bogdanov V; Kuśba J J. Phys. Chem 1994, 98, 334–342. [DOI] [PMC free article] [PubMed] [Google Scholar]
- (17).Gryczyński I; Kuśba J; Lakowicz JR J. Phys. Chem 1994, 98, 8886–8895. [DOI] [PMC free article] [PubMed] [Google Scholar]
- (18).Lakowicz JR; Gryczynski I; Kuśba J; Bogdanov V Photo-chem. Photobiol 1994, 60, 546–562. [DOI] [PubMed] [Google Scholar]
- (19).Rubinov AN; Tomin VI; Zhivnov VA Opt. Spectrosc 1973, 35, 451–452. [Google Scholar]
- (20).Butko AI; Voropai ES; Gaisenok VA; Saechnikov VA; Sarzhevskii AM Opt. Spectrosc. (USSR) 1982, 52, 153. [Google Scholar]
- (21).Voropai ES; Gaisenok VA; Kirsanov AA; Saechnikov VA; Sarzhevskii AM Opt. Spectrosc. (USSR) 1984, 57, 140–142. [Google Scholar]
- (22).Kuśba J; Bogdanov V; Gryczynski I; Lakowicz JR Biophys. J 1994, 67, 2024–2040. [DOI] [PMC free article] [PubMed] [Google Scholar]
- (23).Rudik KI; Pikulik LG; Senkevich LP; Kostko MY; Maksimov AI Z. Prikl. Spektrosk 1976, 25, 450–454 (trans.). [Google Scholar]
- (24).Galanin MD; Kirsanov BP; Chizhikova ZA ZHETF Pis. Red 1969, 9, 502–507. [Google Scholar]
- (25).Gryczynski I; Kuśba J; Lakowicz JR, manuscript in preparation.
- (26).Einstein A Phys. Z 1917, 18, 212 Reprinted in Barnes, F. S. Laser Theory; IEEE Press: New York, 1972. [Google Scholar]
- (27).Laczko G; Lakowicz JR; Gryczynski I; Gryczynski Z; Malak H 1990 ReV. Sci. Instrum 1990, 61, 2331–2337. [Google Scholar]
- (28).Lakowicz JR; Gryczynski I In Topics in Fluorescence Spectroscopy, Vol. 1 Techniques; Lakowicz JR, Ed.; Plenum Press: New York, 1991; pp 293–355. [Google Scholar]
- (29).Time-correlated Single Photon Counting; O’Connor DV, Phillips D, Eds.; Academic Press: New York, 1984; 288 pp. [Google Scholar]
- (30).Birch DJS; Imhof RE In Topics in Fluorescence Spectroscopy, Vol. 1 Techniques; Lakowicz JR, Ed.; Plenum Press: New York, 1991; pp 1–95. [Google Scholar]
- (31).Lakowicz JR; Gratton E; Laczko G; Cherek H; Limkeman M Biophys. J 1984, 46, 463–477. [DOI] [PMC free article] [PubMed] [Google Scholar]
- (32).Gratton E; Limkeman M; Lakowicz JR; Maliwal BP; Cherek H; Laczko G Biophys. J 1984, 46, 479–486. [DOI] [PMC free article] [PubMed] [Google Scholar]
- (33).Lakowicz JR; Cherek H; Laczko G; Gratton E Biochim. Biophys. Acta 1984, 777, 183–193. [Google Scholar]
- (34).Lakowicz JR; Balter A Biophys. Chem 1982, 16, 99–115. [DOI] [PMC free article] [PubMed] [Google Scholar]
- (35).Laws JR; Brand L J. Phys. Chem 1979, 83, 795–802. [Google Scholar]
- (36).Gafni A; Brand L Chem. Phys. Lett 1978, 58, 346–350. [Google Scholar]
- (37).Nemkovich NA; Rubinov AN; Tomin VI Top. Fluoresc. Spectrosc 1991, 2, 387–428. [Google Scholar]
- (38).Simon JD Acc. Chem. Res 1988, 21, 128–134. [Google Scholar]
- (39).Easter DC; Baronavski AP Chem. Phys. Lett 1993, 201, 153–158. [Google Scholar]
- (40).Barbara PF; Jarzeba W AdV. Photochem 1990, 15, 1. [Google Scholar]
- (41).Ware WR; Lee SK; Brant GJ; Chow PP J. Chem. Phys 1970, 54, 4729–4737. [Google Scholar]
- (42).Mazurenko Yu. T. Opt. Spectrosc 1973, 34, 527–529. [Google Scholar]
- (43).Yip RW; Wen Y-X; Szabo AG J. Phys. Chem 1993, 97, 10458–10462. [Google Scholar]
- (44).Lakowicz JR Principles of Fluorescence Spectroscopy; Plenum Press: New York, 1983; pp 388–391. [Google Scholar]
- (45).Laws JR; Brand L J. Chem. Phys 1979, 83, 795–802. [Google Scholar]


