Abstract
The purpose of this work is to present a new method that can be used to estimate and mitigate RF induced currents on Deep Brain Stimulation (DBS) leads. Here, we demonstrate the effect of RF induced current mitigation on both RF heating and image quality for a variety of brain MRI sequences at 3 T.
We acquired pre-scan images around a DBS lead (in-situ and ex-vivo) using conventional Gradient Echo Sequence (GRE) accelerated by parallel imaging (i.e GRAPPA) and quantified the magnitude and phase of RF induced current using the relative location of the B1+ null with respect to the lead position. We estimated the RF induced current on a DBS lead implanted in a gel phantom as well as in a cadaver head study for a variety of RF excitation patterns. We also measured the increase in tip temperature using fiber-optic probes for both phantom and cadaver studies. Using the magnitude and phase information of the current induced separately by two transmit channels of the body coil, we calculated an implant friendly (IF) excitation. Using the IF excitation, we acquired T1, T2 weighted Turbo Spin Echo (TSE), T2 weighted SPACE-Dark Fluid, and Ultra Short Echo Time (UTE) sequences around the lead.
Our induced current estimation demonstrated linear relationship between the magnitude of the induced current and the square root SAR at the tip of the lead as measured in phantom studies. The “IF excitation pattern” calculated after the pre-scan mitigated RF artifacts and increased the image quality around the lead. In addition, it reduced the tip temperature significantly in both phantom and cadaver studies compared to a conventional quadrature excitation while keeping equivalent overall image quality.
We present a relatively fast method that can be used to calculate implant friendly excitation, reducing image artifacts as well as the temperature around the DBS electrodes. When combined with a variety of MR sequences, the proposed method can improve the image quality and patient safety in clinical imaging scenarios.
Keywords: Deep Brain Stimulation, MR Safety, RF Heating, Image Artifacts
Introduction
Magnetic Resonance Imaging (MRI) of patients with metallic implants is becoming a significant issue as more and more patients are being implanted with various medical devices. For example, Deep Brain Stimulation (DBS) is a therapy which involves implanting electrodes within certain areas of the brain to deliver electrical impulses for the treatment of movement and neuropsychiatric disorders. However, for these patients, MRI scans can induce radio-frequency (RF) currents on elongated metallic leads which may critically increase the temperature at the lead tip1.
From a strictly clinical perspective DBS leads are stereotactically placed in structures requiring submillimeter positioning precision in order to improve therapeutic benefits. This is due to the fact that the outcomes are highly dependent on the location of the stimulating electrode with respect to the anatomical target region2 Once placed, electrode location is confirmed both intra-operatively and post-operatively. In some cases, placement is guided by intra-operative MRI. Post-operative CT images fused with pre-operative MR images have also been used for localizing DBS leads3,4. Although effective, post-operative morphological information is lost in a CT image. In addition, the patient is exposed to radiation and precise localization based on the fused images can be compromised by an intra-operative brain shift if acquired shortly following the surgery5,6. In the current state, MR imaging is either limited to MR Conditional parameters (i.e. SAR, B1+) provided by the DBS manufacturer or is performed outside of these parameters despite of the risk of heating of the DBS hardware7. Therefore, restoring a wider range of MRI capabilities available to patients following DBS lead implantation would be highly beneficial for improving localization of the lead and for other potential diagnostic purposes. However, the largest hurdle to date is the potential for irreversible damage due to MRI related heating of the DBS lead8.
In the last decade, a number of studies were published investigating the feasibility of optimized transmit RF coils and/or RF excitation to mitigate metallic device heating in MRI. Initially, a method based on the use of linearly polarized birdcage coils was proposed to minimize RF heating at the wire tips. It was shown that RF heating around metallic wires can be reduced by coinciding the wire with the reduced-electric field plane of a linear birdcage coil9. In a separate study, it was also shown that the location of this reduced electric field plane can be steered in the angular direction by using a dual-drive excitation10. Later, various different studies were performed to demonstrate RF heating reduction using rotating bird-cage transmitters11,12, and various other parallel transmit (pTx) approaches.13-16
Practical application of the solutions described above usually requires a pre-scan of the subject. It is crucial to acquire subject-specific pre-scan images with very low power settings, ensuring that the pre-scan does not cause any heating itself. In addition, the pre-scan needs to be as fast as possible so that it can be performed practically in a clinical scenario. Parallel imaging has a potential for accelerating such pre-scans17. Previously proposed pre-scan imaging methods estimated the magnitude of induced currents based on analyzing MR image artifacts18,19. These methods utilized transmitter-receiver (tx/rx) coils for acquiring artifact images. However, acceleration using parallel imaging with multi-channel receiver arrays has not been demonstrated. Van den Bosch presented a method based on calculation of B1+ maps using a GRE sequence with different flip angles (acquisition time 82-109 seconds) as well as an IR sequence to generate T1 maps (acquisition time: 42-214 seconds). On the other hand, Griffin et al. used a method based on analyzing signal intensity around the lead. They reported 55 seconds for the pre-scan acquisition time needed to measure the RF induced currents (for a given RF excitation pattern).
It is possible to estimate the magnitude of the current with these approaches; however, it would also be useful to estimate the relative phase of the induced current in order to design an implant friendly (IF) excitation scenario. The feasibility of such estimation was not demonstrated in these studies.
Furthermore, although previous methods demonstrated induced current detection19 and heating prediction 18, these methods were demonstrated for only simple conductor geometries; in fact, DBS leads/electrodes have complex geometries involving electrically conductive wires, insulators and contacts arrays. For example, in the study by Griffin et al, a method was proposed to measure the induced current along a wire in order to calculate the SAR and temperature increase at the tip of the wire. However, for most of the DBS leads, it is not possible to measure the induced current close to the contacts due to image artifacts and because of the complex geometry of wire-to-contact connections at the tip. This problem is more constraining for DBS lead designs consisting of multiple contacts. Yet the maximum heating occurs near the contacts, and therefore, the current needs to be measured on the conductor close to the contacts to accurately predict the heating. However, this is practically difficult to achieve because the magnetic field distribution at the vicinity of the contact is distorted by the conductor geometry. Therefore, the simplified view of the magnetic field being generated due to a single current element flowing on a wire is not valid around the contacts.
It was previously demonstrated that the tip’s SAR and the temperature can be reduced by optimizing the RF excitation and minimizing the RF induced currents on metallic conductors9-16,20. However, the effect of this modification on the image quality (around the DBS leads) was not investigated in detail. Considering that there is an increasing interest in performing MRI and functional MRI (fMRI) around neural implants 21,22, it is potentially important to demonstrate the effects of optimizing RF excitation on the image artifacts observed with conventional sequences.
In this work we used a low power GRE sequence which is incapable of inducing significant temperature increase on the metallic leads. Unlike previous work, the pre-scan method presented here does not rely on B1+ mapping sequences or complex matching between modeled and measured B1+ variations around metallic wires. The proposed method is based on performing basic geometric measurements on the image artifact and therefore is easy to implement. Furthermore, the new method utilizes multi-channel receivers and thus can easily be accelerated with parallel imaging approaches. The magnitude and the phase of the induced current estimated by the proposed pre-scan can be used to reduce the current on the lead and the tip RF heating, generating the implant friendly excitation10.
We demonstrated the performance of the proposed method using a commercial DBS lead (directional lead for the Infinity DBS system, Abbott Laboratories, Chicago, IL). For that purpose, we compared the temperature increase and the image quality obtained by conventional method versus the proposed method. The image quality around the DBS lead was investigated visually and via changes in signal intensity and variation, whereas the image quality elsewhere in the sample was compared by calculating the correlation coefficient between two images (excluding the pixels at the vicinity of the DBS lead). Both excitation methods were used to acquire conventional MR images using T1-TSE Dark Fluid, T2-Space Dark Fluid and T2-TSE.
Methods
Induced Current Calculation
First, an assumption is made that a multi-channel receiver array is used to acquire images of a DBS implant lead. Let be the receiver sensitivity of the mth individual receiver coil observed at the vicinity of the lead. Let be the current that would be induced on the lead due to reciprocity when the mth receiver coil was used as transmit coil and excited with a unit current. Let ø and r denote the cylindrical coordinates centered on the lead at a given plane of interest. In that case, we can write the signal intensity of the image obtained from the mth receiver coil as follows:
| (1) |
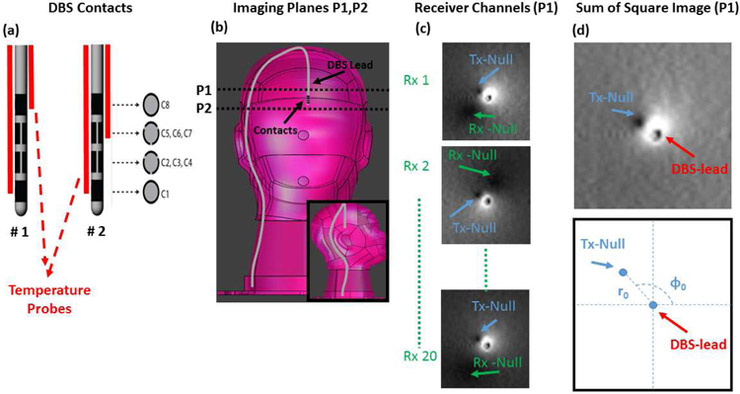
In the above equation B1+ denotes the transmit sensitivity of the body coil and It denotes the current induced on the lead due to excitation of the body coil. Note that this equation assumes a small flip-angle approximation. When equation 1 is set to zero, there are two solutions. Therefore, for each image acquired from an individual receiver element, we expect to have two null-locations for the signal intensity. These two null locations occur due to the interaction of the lead with the receive and transmit elements separately. Figure 1 shows example images where the two null points around the lead are shown. Note that the location of the receiver null is different for each receiver element. However, the location of the transmit null is fixed among receivers and depends only on the current flowing on the DBS lead and the transmit field excited by the body coil.
Figure 1.
A)Diagram of DBS electrode contacts and the position of temperature probes are shown.
B)Two imaging planes used to image the DBS in the pre–scan are shown.
C)Images acquired by 3 of 20 individual receiver channels are shown. Note that the individual images show two null-locations due to interaction of the lead with the receiver and the transmitter coils.
D) Sum of Square image (reconstructed from individual receiver channels) shows the location of a single Tx-Null whose location strictly depends on the RF induced current and the transmit field of the body coil.
Now, assume we perform a simple sum-of-squares reconstruction (which is available on all commercial scanners) and we look at the magnitude of the resulting image. Equation 2 shows the signal intensity observed around the lead in that case:
| (2) |
Note that the equation 2 has a single null (i.e SI=0). Since the receive coils are geometrically distributed, and each receive element contributes to a different receive-null location, the sum-of-squares expression is a non-zero function. In fact, assuming the signal contribution of all channels are comparable, we expect to have a relatively uniform receive profile as a result of this reconstruction. Therefore the magnitude sum-of-squares image has a single null whose location is determined by only B1+(the transmit field of the coil) and It (the current induced on the lead by the transmit coil). This is a critical observation which enables us to use multi-channel receiver coils and parallel acquisition for measuring the RF induced current, It.
It is impossible to find the exact value of B1+from a single image of the artifact around the lead. However it can be approximated by the B1+underneath the contact where the contribution of the RF induced current, It, is approximately zero. Assuming that the nominal flip angle prescribed by the scanner αnom at an imaging plane lying underneath the tip (plane 2 in Figure 1) is accurate, we can approximate the B1+as follows:
| (3) |
Here p(t) denotes the RF pulse waveform and TR denotes the repetition time of the GRE sequence. Once B1+ is found, then the magnitude and the phase of the It can be calculated from the null location (r0, ø0) as follows:
| (4) |
Once the measurement is performed with quadrature excitation, a similar measurement can be repeated with an arbitrary excitation pattern. In that case, B1+ can be calculated simply by scaling quadrature with the term Where Squad and S are the mean image intensities measured underneath the lead (plane 2) due to quadrature and the arbitrary excitation pattern, respectively.
Phantom Experiments
We experimented with a commercial DBS lead (directional Infinity DBS system, Abbott Laboratories, Chicago, IL) placed in a head shaped phantom in a generic orientation (Figure 1). The phantom was prepared using an aqueous gel solution comprising Hydroxyl Ethyl Cellulose (14g/L), NaCl (2 gr/L) and CuSo4 (0.5 gr/L) which mimics electromagnetic and thermal properties of the human brain at 3 T. The electrical conductivity and relative permittivity of the HEC gel was measured as 0.66 S/m and 78, respectively. The specific heat capacity was measured as 4.08kJ/kg/K.
We placed two temperature probes (STB, Lumasense, Santa Clara, CA) on two contacts and recorded the time variation of the temperature in real time. Two temperature probes were taped to the shaft of the DBS electrode using surgical tape (Micropore, 3M, Minnesota). In configuration 1, the temperature probes were placed on the insulator of the DBS electrode ensuring close proximity of the temperature probe tips to contacts C1 & C8 of the DBS electrode. Similarly, in configuration 2, the temperature probes were placed on the insulator, this time ensuring that the probes tips were in close proximity to contacts C1 & C 5,6,7 of the DBS electrode. (See figure 1, panel a)
We acquired the MR images of the phantom at two planes of interest (See Figure 1) using a conventional GRE sequence (Flip Angle=30°, TR=200 msec, TE=3.66 msec, 0.5×0.5×5mm, FOV: 16cm× 16 cm, GRAPPA acc. n=4) resulting in a scan time of 21 seconds. Images were acquired on a Siemens 3T Prisma system using the Siemens 20 Channel Head/Neck receiver coil.
Plane 1 was chosen to be perpendicular to the shaft of the electrode, close to the contacts but not at the contacts’ levels. This allows approximation of the B1+ field perturbation using the quasistatic field expression due to a current flowing on a simple conductor. Plane 2 was chosen right below the contacts (but not intersecting them) where the contribution of the RF induced current is approximately zero. Plane 1 and plane 2 were located 2.5 cm and 0.5 cm from the electrode tip (C1) respectively.
We changed the amplitudes and phases of the body coil using the “patient specific” B1 shimming option provided on the Siemens 3T Prisma System. We adjusted the amplitudes and phases of the body coil in order to acquire images with 5 different RF excitation patterns,namely: Quadrature, Ch1, Ch2, Ch1+2, Ch1-2.
We calculated the current induced on the lead for different excitation patterns (Iquad, I1, I2, I1+2, I1-2) by using the equation given in the previous section. First, we located the B1+ null and the lead center by finding the minima of the image inside hand-drawn ROIs around the two points. Second, we calculated the radial and angular location of the B1+null with respect to the lead center (see Figure 1).
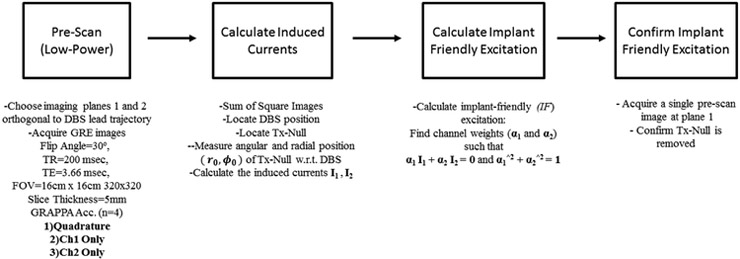
The pre-scan images used for the proposed method were acquired in 21 seconds and the post-processing phase was performed almost instantaneously (< 1 sec). The entire pre-scan requires running the same sequence at least with 3 different excitation patterns (Ch1, Ch2 and Quadrature) resulting in 3 × 21 = 63 seconds. The details of the pre-scan method are shown in the flowchart in Figure 2.
Figure 2.
A flow chart that summarizes, step-by-step, the instructions required for the pre-scan and implant friendly (IF) excitation is shown.
Using the current values estimated for, I1 and I2, we can calculate an implant-friendly (IF) excitation which comprises of weights (α1 and α2) satisfying α1 I1 + α2 I2 = 0 and α1ˆ2+ α2ˆ2= 1. As it was shown in previous work, this excitation can be used to minimize temperature observed around metallic devices.10 Note that, in order to measure I1 and I2, separate scans using Ch1, Ch2 and quadrature mode are needed. A scan with quadrature mode provides signal calibration data for Ch1 and Ch2 and also additional data regarding the unmitigated induced current as a comparison.
Finally, we scanned the phantom with a TSE sequence (Flip Angle=150°, TR=6000 msec, Echo Train Length=15). We scanned the phantom with all excitation patterns previously described: Quadrature, IF, Ch1, Ch2, Ch1+2, Ch1-2. We measured and recorded the tip temperature at two contact locations using fluoroscopic temperature probes. After the end of each TSE sequence, we waited (~10-20 minutes) before we apply a new RF pattern. Then we calculated the SAR at the contacts using the time variation of the temperature data measured by the probes: a linear fit was performed on the temperature-time curve and the slope of the fit was divided by the specific heat capacity of the gel. Note that temperature data is non-linear for implants in general but the initial regime can be approximated by a linear expression as shown in a previous study.23
Cadaver Experiments
For additional validation of our method, we conducted a study in which we implanted a DBS electrode (Infinity DBS system, Abbott Laboratories, Chicago, IL) into a cadaver head and measured the actual temperature increase and evaluated the image artifacts under a more realistic configuration and geometry. A single temperature probe was taped to the shaft of the DBS electrode using surgical tape (Micropore, 3M, Minnesota). The tip of the temperature probe was positioned on the insulator of the DBS lead ensuring close proximity to contact 1 of the DBS electrode.
The Stealth navigation (Stealth FrameLink, Medtronic, Minneapolis, MN) system was loaded with the 3.0 T MRI of the cadaver’s brain. The image was then used for neuronavigation to stereotactically localize the target using an AC-PC line localization technique to extract the target coordinates. Next, medial-lateral and anterior-posterior trajectory angles as well as planned target depth were recorded for the left side of the brain. Once trajectory angles and target depth were obtained, measurements were taken for determining incision and burr hole location.
The cadaveric specimen was fixed and prepared prior to DBS lead placement in the following fashion: The arteries and veins of the specimen were carefully flushed with an anti-coagulant solution under high pressure and low flow. The specimen was then injected with a formaldehyde solution and placed in cold storage for 24 hours. Finally, the specimen underwent a secondary injection with an anatomical fluid solution and allowed to settle for 24 hours prior to use.
A straight incision was made, skin was retracted, and the burr hole was drilled. A guide tube cannula measuring 1.8 mm in diameter with an inner stylet was freely inserted into the cadaver without the use of a stereotactic frame and placed approximately 5 mm above the target depth. The inner stylet was removed from the cannula and the DBS lead (Infinity DBS system, Abbott Laboratories, Chicago, IL) and temperature probe (STB, Lumasense, Santa Clara, CA) were inserted into the cannula and placed at the target depth. The cannula was then removed and both the DBS lead and the temperature probe were secured within the burr hole with glue and sutured to the cadaver scalp. The skin at the site of the incision was then re-approximated with sutures.
The cadaver head was then scanned on the Siemens 3T Prisma System. We repeated the sequences that we used for phantom imaging and acquired GRE images using the Ch1, Ch2 and IF patterns only. The IF pattern was calculated using the estimated current values, I1 and I2. Finally, we acquired an array of standard clinical protocols images using T1-TSE Dark Fluid (Flip Angle=150°, TR=2000 msec, Inversion Time=900 msec, Echo Train Length=4), T2-Space Dark Fluid (Flip Angle=120°, TR=5000 msec, Inversion Time=1800 msec, Echo Train Length=246), T2-TSE (Flip Angle=150°, TR=6240 msec, Echo Train Length=15 )sequences using Quadrature and IF patterns for each sequence.
Results
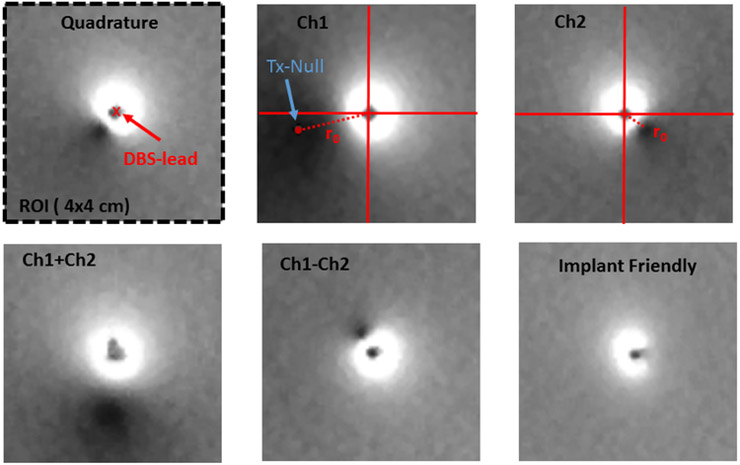
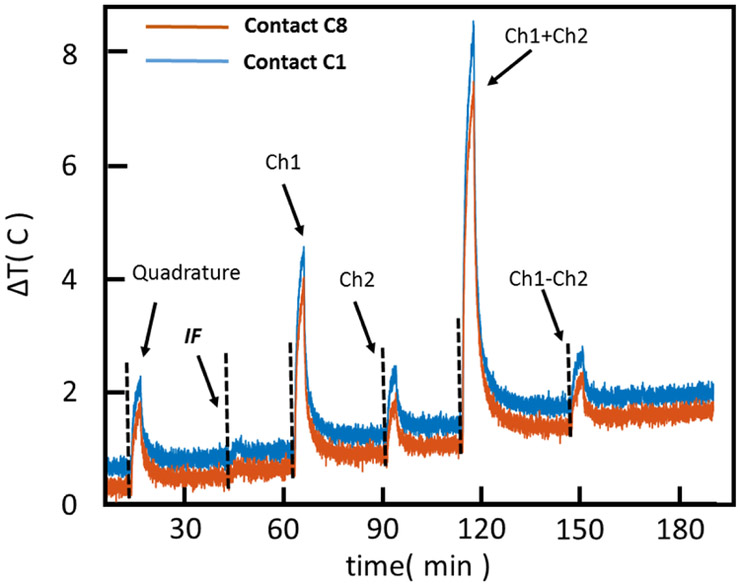
Figures 3 and 4 show the location of the B1+ null(s) around the lead for different RF excitation patterns in the phantom and cadaver, respectively. Note that both the radial and angular location of the null is shifted as the excitation is changed. Figure 5 shows the six heating curves observed at the top and bottom row of contacts due to different excitation patterns in the phantom. A maximum heating of 6.4 C was observed as a result of Ch1+2 pattern in comparison with a minimum of 0.3 C with the IF pattern.
Figure 3.
The location of the B1+ null around the lead in phantom is shown. (Blue arrow points to the exact location of the tx-null as calculated in matlab). Note that both the radial and angular location of the null are shifted as the excitation changes. The null disappeared for the IF excitation.
Figure 4.
The location of the B1+ null around the lead in the cadaver is shown. Note that both the radial and angular location of the null are shifted as the excitation changes. The null disappeared for the IF excitation.
Figure 5.
Heating curves (phantom) observed at the contacts (C1 and C8) due to different excitation patterns is shown. A maximum heating of 6.4 C was observed as a result of Ch1+2pattern in comparison with a minimum of 0.3 C with IF pattern. TSE sequence was used for all excitation patterns.
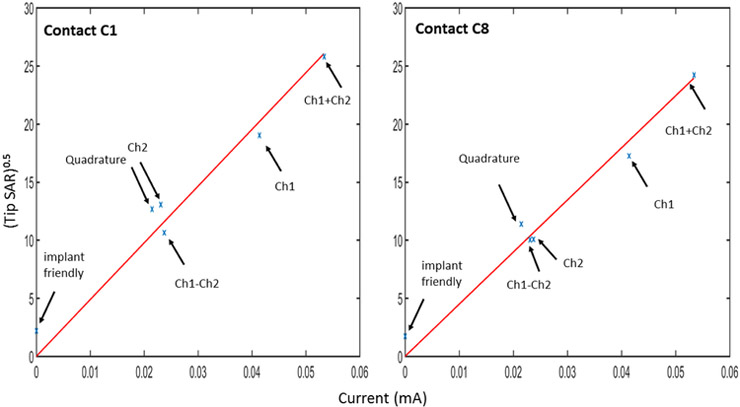
Figure 6 shows the plot of (calculated from the temperature data in Figure 5) vs the induced RF current (calculated from the B1+ null locations at Plane 1, See Figure 3). SAR data are pointwise results and they do not correspond to 10g average SAR values. Note that plane 1 was located sufficiently close to the tip in order to ensure that the induced current is linearly proportional to the observed at the contacts. Matlab’s “fitlm” routine was used to fit the best line to the and induced current data resulting in an RMS error of 1.74 for contact 1 and 1.28 for contact 8 ; hence, a linear pattern is observed between and the induced current.
Figure 6.
calculated from the temperature data shown in Figure 5 is plotted with respect to induced RF current calculated from the B1+null locations in Figure 3. Matlab’s “fitlm” routine was used to fit the best line to the data resulting in an RMS error of 1.74 for contact 1 and 1.28 for contact 8. A linear pattern is observed between the two quantities. Note thatCh1+Ch2 and Ch1-Ch2 used twice as much transmitted power in comparison to other excitation patterns.
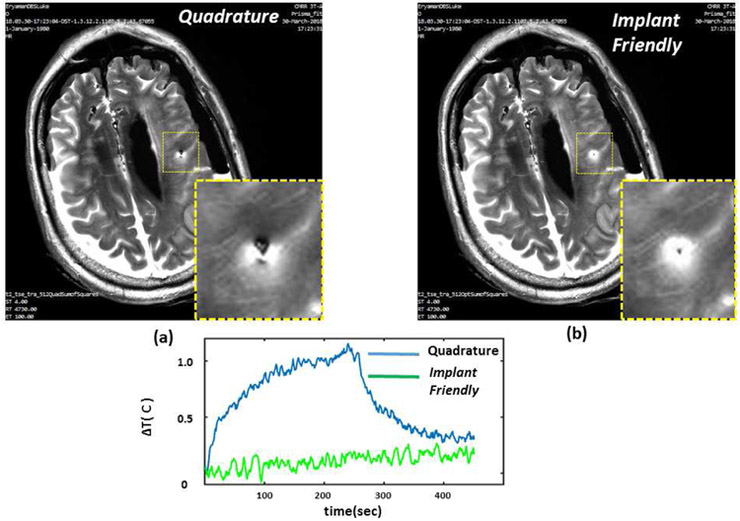
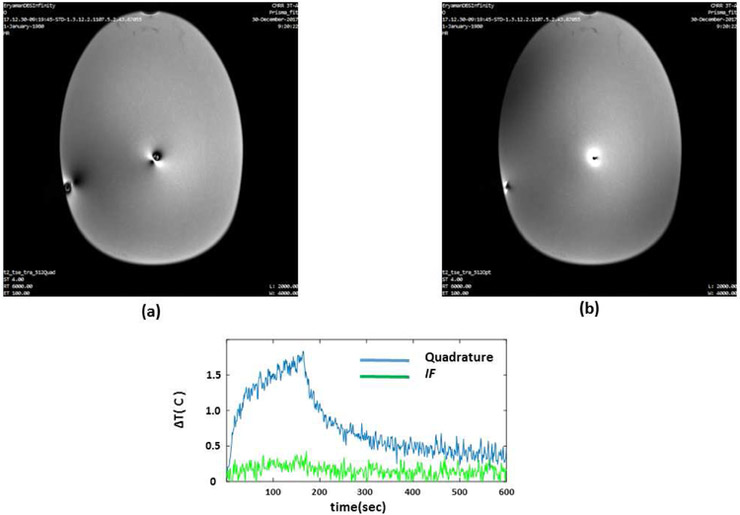
Figures 7 and 8 show the TSE images obtained around the lead using standard quadrature and IF patterns in the phantom and cadaver, respectively. Quadrature pattern excitation resulted in signal attenuations across the image with loss mainly due to over-flipping of the spins at the vicinity of the lead. On the contrary, when the IF excitation pattern was used, an increase in signal was observed at the vicinity of the DBS lead. As shown in Figures 7 and 8, the image quality was improved as a result of using the IF pattern. In order to quantify the improvement in image quality we calculated the following metrics:
Figure 7.
TSE images obtained around the lead using quadrature and IF patterns in the phantom are shown. Quadrature pattern results in a signal loss mainly due to over-flipping of the spins at the vicinity of the lead. Axial image shows improved image quality as a result of using the IF pattern. In addition, IF pattern reduced the contact temperature significantly in comparison to quadrature excitation.
Figure 8.
TSE images obtained around the lead using quadrature and IF patterns in the cadaver brain are shown. Quadrature pattern results in a signal loss mainly due to over-flipping of the spins at the vicinity of the lead. Axial image shows improved image quality as a result of using the IF pattern. In addition, IF pattern reduced the contact temperature significantly in comparison to quadrature excitation.
1) Sum of Square Mean Signal Intensity for IF and Quadrature Patterns near the lead and excluding the near-lead region.
2) Standard Deviation of Signal Intensity IF and Quadrature Patterns near the lead and excluding the near-lead region.
The IF excitation was able to increase the mean signal intensity and decrease the percent signal variation around the lead compared to the Quadrature excitation (Table 2). In addition, we calculated the correlation coefficient between T2-TSE coronal images acquired by quadrature and implant friendly excitation excluding the voxels immediately around the lead.. The immediate voxels around the DBS lead were excluded from the analysis by using a rectangular mask of 55mm × 15mm around the DBS lead, and correlation in the remaining voxels was calculated as 0.992.
Table 2.
Mean signal intensity and percent signal variation are calculated near DBS and elsewhere. IF excitation was able to increase the mean signal intensity and decrease the percent signal variation around the lead compared to the Quadrature excitation.
| Mean Signal Intensity (Near DBS) |
Mean Signal Intensity (Elsewhere) |
Percent Signal Variation (Near DBS) |
Percent Signal Variation (Elsewhere) |
|
|---|---|---|---|---|
| Implant Friendly | 1180 | 564 | %45 | %27 |
| Quadrature | 592 | 587 | %67 | %16 |
Thus, the “IF method” did not degrade the overall image quality while it improved the image quality around the DBS lead. Furthermore, the temperature increase using the IF solution was significantly less than the quadrature acquisition in both phantom and cadaver studies.
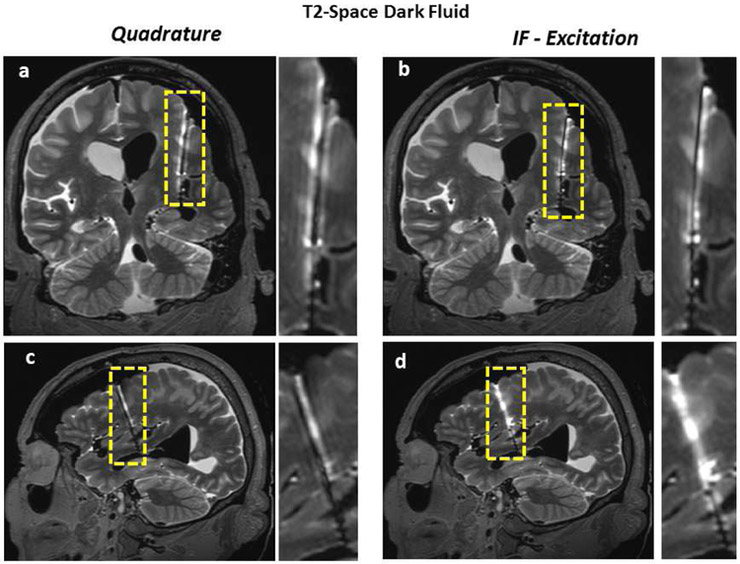
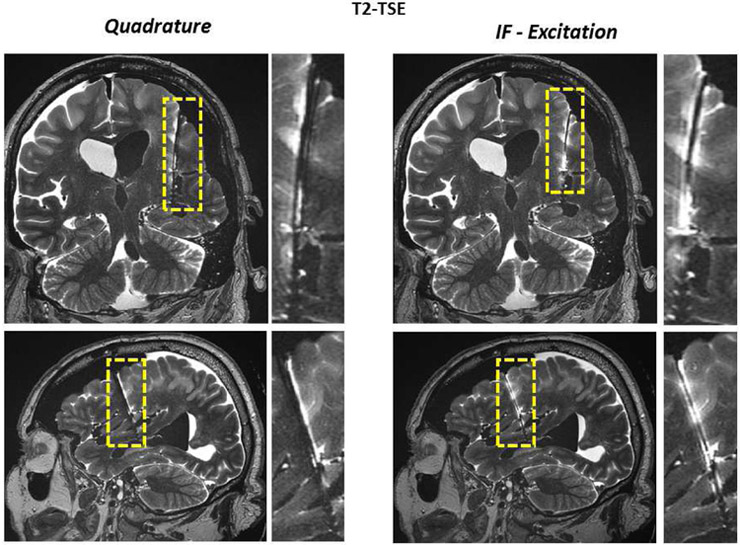
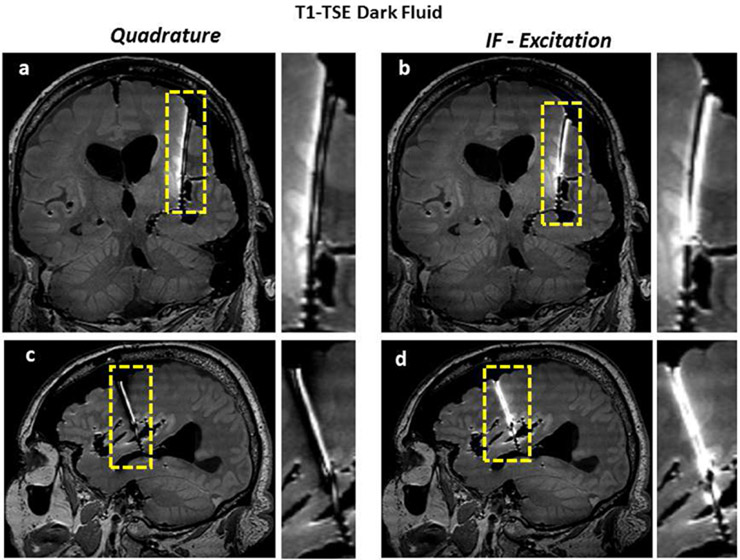
Figures 9-11 demonstrate the benefits of the “IF excitation” over the quadrature excitation using multiple standard sequences including T1-TSE Dark Fluid, T2-Space Dark Fluid, T2-TSE. All results showed improvement in image quality around the lead with IF excitation whereas overall image quality elsewhere remained almost unchanged.
Figure 9.
T1-TSE Dark Fluid images of the cadaver head (obtained with quadrature and IF patterns) are shown. Coronal and sagittal images show the improvement of image quality along the lead.
Figure 11.
T2-TSE images of the cadaver head (obtained with quadrature and IF patterns) are shown. Coronal and sagittal images show the improvement of image quality along the lead.
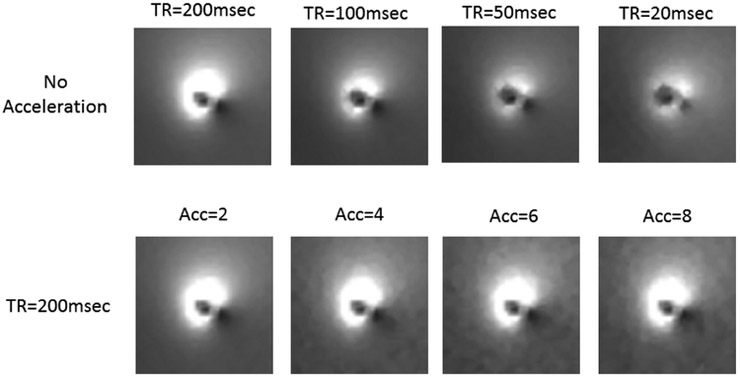
We acquired sum of square images of the image artifact around the lead for different TR and different acceleration factors. The results demonstrate that the pre-scan acquisition time can easily be shortened by reducing the TR and/or and increasing the acceleration factor. (See Figure 12)
Figure 12.
Sum of Square images of the image artifact were acquired around the lead for different TR and different acceleration factors. The results demonstrate that the pre-scan acquisition time can easily be shortened by reducing the TR and/or and increasing the acceleration factor.
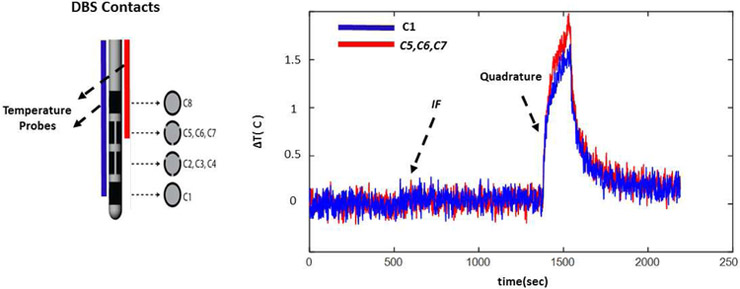
Finally, Figure 13 shows the temperature increase at the contacts C1 and C5-C7. (Configuration 2, Figure 1 panel a.) Similar to configuration 1, the temperature at both contact points (C1 and C5-C7) were mitigated simultaneously as a result of using the implant friendly excitation.
Figure 13.
The temperature increase at the contacts C1 and C5-C7 (Configuration 2, Figure 1 panel a.) is shown. Similar to configuration 1, the temperature at both contact points were mitigated simultaneously as a result of using the implant friendly excitation.
Discussion
The need for developing safe methods for imaging patients with implanted devices has become an important issue in recent years. All DBS manufacturing companies are currently working on certifying their devices to become MR compatible, mainly focusing on the implantable pulse generator (IPG) while significant risk of tissue heating still exists with the implanted leads due to the electrode-RF interactions. We used a 2D GRE sequence for our pre-scan measurements. A 3D sequence can also be used for the same purpose, although the additional imaging planes do not provide any additional information beyond what is necessary to calculate the implant friendly excitation. On the other hand, multi-slice excitation was not preferred because it would require higher power and might potentially cause significant temperature increase at the contact points. We demonstrated the performance of the method by comparing the induced current values calculated from pre-scan images and the √ SAR calculated from each excitation pattern. SAR is a quantity that is related to the dissipated power and therefore is quadratically dependent on the induced current. Therefore √SAR is linearly dependent. We demonstrated this linear relationship by performing 6 independent measurements obtained from 6 excitation patterns to validate our approach (see Figure 6).
We minimized the heating at the contacts using implant friendly excitation. For that purpose, we minimized the current flowing on the lead at a single point close to the contacts. This was sufficient to minimize heating at all contacts. Two imaging planes were needed to estimate the current. One pre-scan imaging plane close to the contacts, (intersecting the shaft of the lead, containing the Tx Nul, plane 1) and a second imaging plane below the contacts (used to predict the incident B1+ of the transmit coil, plane 2). Plane 1 must be perpendicular to the axis of the electrode shaft, otherwise induced current calculation will be compromised.The proposed method requires B1+ homogeneity at the vicinity of the DBS lead tip. This requirement is satisfied for imaging at 3T (or lower field strengths) and for current approved DBS targets (Basal ganglia and Thalamic regions) in which the electrode tip locations are close to the center of the brain.
The induced current calculations assume that the nominal flip angle prescribed by the scanner is accurate. As expected, any errors on the nominal flip angle may also introduce errors in the calculated induced current. However, because the error would scale with the current calculated for all excitation patterns, it would have no net effect on the calculation of the implant-friendly excitation pattern.
Susceptibility artifacts may negatively affect the localization of the DBS lead and the null. In order to minimize this effect, we minimized our TE during the pre-scan. Although this adjustment worked well for the DBS electrode we use, further modification may be needed for different configurations of electrodes. One possible solution would be to use sequences that are immune to susceptibility artifacts (i.e. Ultra Short TE ) The use of UTE with the current method is currently under investigation and will be reported in a follow-up manuscript.
The accuracy of locating the tx-null depends on SNR, image resolution and the location of the null with respect to the lead. Any errors made in tx-null location could potentially impact the current estimation The pre-scan acquisition time can easily be shortened by reducing the TR and/or and increasing the acceleration factor. The effect of such modifications on the current calculation is presented in this paper. For our results, we used a repetition time of TR = 200 msec and an acceleration factor of n=4 which provided accurate measurement of induced current as well as enabling calculation of the implant friendly excitation.
The pre-scan utilized a multi-channel head coil and GRAPPA acceleration. Different acceleration techniques, acceleration factors, coils and g-factor values might influence the accuracy of the pre-scan.
Using the proposed IF method, we observed enhancement in image quality in the vicinity of the DBS lead due to mitigation of RF induced currents in all of the sequences. Sequences where image intensity is highly dependent on flip angle homogeneity benefitted the most from the proposed method (i.e TSE and SPACE).
We observed almost no increase in the temperature as a result of using the IF pattern with clinical sequences suggesting that a significant safety limitation is resolved with the proposed method. In addition, we observed an enhanced image quality around the lead while the overall image quality remained the same.
Note that, SAR calculations were based on temperature data acquired in a homogenous phantom. The EM properties of the gel used in this study were chosen to approximate the average EM properties of the human brain. However, for in-vivo applications, the spatial variation of tissue properties as well as the existence of perfusion may have an effect on the temperature. Therefore, the in-vivo tip temperatures may be different then what is measured in the phantom.
The temperature probes measured the temperature at the DBS lead tip (which is located very close to the center of the phantom). During each experiment, the phantom/cadaver was exposed to various RF power levels/excitation patterns. Due to thermal conduction, a net increase in the base temperature over the time course of the entire experiment was observed, even when RF was off. The rate of this temperature increase was significantly smaller than what was observed during each RF excitation period. Therefore, the effect of the base temperature increase was neglected in our calculations
The proposed method was validated for unilateral, single DBS implant scenario. Although the proposed method can be used to predict the current on two leads at the same time, an implant friendly excitation that simultaneously minimizes the current on both leads is not feasible using a 2 Channel transmission body coil. However, in the near future, with systems having a larger number of transmission channels, an implant friendly excitation solution may be developed using the principles presented in this work.
The proposed IF method has the potential for enabling fMRI studies as the signal in the vicinity of the DBS lead increases and does not suffer from the signal loss that is observed under the quadrature acquisition. Without signal dropouts around the electrode, it would be possible to perform fMRI experiments and map responses close to the electrode. This would allow mapping of functional responses of regions directly targeted by the electrode.
The proposed method was specifically developed and tested for imaging unilateral DBS leads at 3 T using a dual-drive birdcage coil. The feasibility of the method was not tested for different coil geometries, other neural implants, or different field strengths. For higher field strengths and other coil geometries, further investigation is necessary.
We used the Abbott segmented lead (8 contacts) which has a complicated contact geometry, and therefore is a challenging but practical case for demonstrating the proposed method. After performing additional safety validation studies, the method could be used for imaging around leads from other manufacturers as well.
Clinical implications of the IF method:
As more patients are being implanted with therapeutic devices and as the general population is getting older, the chances that a patient with an implanted device will need an MRI scan has significantly increased and will continue to increase over time. As such, methods that allow for a safe scanning procedure are needed and the proposed IF method is one such example. The simple implementation of the method on standard clinical MRI systems should provide the clinical community with a safe way of obtaining MRI of patients following DBS implantation, immediately opening avenues for improving DBS programming strategies and significantly improving long-term care by enhancing post-implant diagnostic capabilities. For the research community, this method will open vast, novel opportunities for investigating the underlying mechanisms of DBS.
Conclusions
We demonstrated a simple geometric image analysis method that can be used to measure and mitigate RF induced currents on DBS leads. During the pre-scan, 2D GRE images (accelerated by GRAPPA) were acquired around the lead (in-situ and ex-vivo) using a multi-channel receiver head coil. Using the induced current information calculated from different excitation scenarios, we minimized total current on the lead and RF heating at the contacts. The proposed method improved the image quality for TSE Dark Fluid, T2-Space Dark Fluid and T2-TSE sequences.
Figure 10.
T2-Space Dark Fluid images of the cadaver head (obtained with quadrature and IF patterns) are shown. Coronal and sagittal images show the improvement of image quality along the lead.
Table 1.
Relative amplitudes and phases used to realize different excitation patterns are shown
| Excitation Pattern | Ch1 | Ch2 |
|---|---|---|
| Quadrature | 0.7∠0° | 0.7∠90° |
| Ch1 Only | 1 | 0 |
| Ch2 Only | 0 | 1 |
| Ch1+Ch2 | 1∠0° | 1∠0° |
| Ch1–Ch2 | 1∠0° | 1∠180° |
| IF, Phantom Exp | 0.49∠0° | 0.87∠140° |
| IF, Cadaver Exp | 0.4∠0° | 0.91∠40° |
Highlights:
Implant-friendly patient-specific MR scans
Mitigating induced currents on DBS leads
Validation with phantom and cadaver studies
Improvement in image artifacts around the DBS leads
Reduction of temperature increase at the contacts
Acknowledgements:
Research reported in this publication was supported by the National Institute of Biomedical Imaging And Bioengineering of the National Institutes of Health under Award Number K99EB021173. This study was partially supported by the NIH R01-NS085188; P41 EB015894; P30 NS076408 and the University of Minnesota Udall center P50NS098573.
Footnotes
Publisher's Disclaimer: This is a PDF file of an unedited manuscript that has been accepted for publication. As a service to our customers we are providing this early version of the manuscript. The manuscript will undergo copyediting, typesetting, and review of the resulting proof before it is published in its final citable form. Please note that during the production process errors may be discovered which could affect the content, and all legal disclaimers that apply to the journal pertain.
References
- 1.Henderson JM et al. Permanent neurological deficit related to magnetic resonance imaging in a patient with implanted deep brain stimulation electrodes for Parkinson’s disease: case report. Neurosurgery 57, E1063; discussion E1063 (2005). [DOI] [PubMed] [Google Scholar]
- 2.Butson CR, Cooper SE, Henderson JM, Wolgamuth B & McIntyre CC Probabilistic analysis of activation volumes generated during deep brain stimulation. Neuroimage 54, 2096–2104, doi: 10.1016/j.neuroimage.2010.10.059 (2011). [DOI] [PMC free article] [PubMed] [Google Scholar]
- 3.Hebb AO & Miller KJ Semi-automatic stereotactic coordinate identification algorithm for routine localization of Deep Brain Stimulation electrodes. J Neurosci Meth 187, 114–119, doi: 10.1016/j.jneumeth.2009.12.016 (2010). [DOI] [PubMed] [Google Scholar]
- 4.Husch A, Petersen MV, Gemmar P, Goncalves J & Hertel F PaCER - A fully automated method for electrode trajectory and contact reconstruction in deep brain stimulation. Neuroimage-Clin 17, 80–89, doi: 10.1016/j.nicl.2017.10.004 (2018). [DOI] [PMC free article] [PubMed] [Google Scholar]
- 5.Khan MF, Mewes K, Gross RE & Skrinjar O Assessment of brain shift related to deep brain stimulation surgery. Stereotact Funct Neurosurg 86, 44–53, doi: 10.1159/000108588 (2008). [DOI] [PubMed] [Google Scholar]
- 6.Bentley JN, Guan Z, Cummings KS, Chou KL & Patil PG Influence of Intracranial Air on Electrode Position and Clinical Outcomes following Deep Brain Stimulation for Parkinson’s Disease. Stereot Funct Neuros 95, 6–12, doi: 10.1159/000452843 (2017). [DOI] [PubMed] [Google Scholar]
- 7.Coffey RJ, Kalin R & Olsen JM Magnetic resonance imaging conditionally safe neurostimulation leads: investigation of the maximum safe lead tip temperature. Neurosurgery 74, 215–224; discussion 224–215, doi: 10.1227/NEU.0000000000000242 (2014). [DOI] [PubMed] [Google Scholar]
- 8.Erhardt J et al. Should patients with brain implants undergo MRI? J Neural Eng, doi: 10.1088/1741-2552/aab4e4 (2018). [DOI] [PubMed] [Google Scholar]
- 9.Eryaman Y, Akin B & Atalar E Reduction of implant RF heating through modification of transmit coil electric field. Magn Reson Med 65, 1305–1313, doi: 10.1002/mrm.22724 (2011). [DOI] [PubMed] [Google Scholar]
- 10.Eryaman Y, Turk EA, Oto C, Algin O & Atalar E Reduction of the radiofrequency heating of metallic devices using a dual-drive birdcage coil. Magn Reson Med 69, 845–852, doi: 10.1002/mrm.24316 (2013). [DOI] [PubMed] [Google Scholar]
- 11.Golestanirad L et al. Construction and modeling of a reconfigurable MRI coil for lowering SAR in patients with deep brain stimulation implants. Neuroimage 147, 577–588, doi: 10.1016/j.neuroimage.2016.12.056 (2017). [DOI] [PMC free article] [PubMed] [Google Scholar]
- 12.Golestanirad L et al. Feasibility of using linearly polarized rotating birdcage transmitters and close-fitting receive arrays in MRI to reduce SAR in the vicinity of deep brain simulation implants. Magn Reson Med 77, 1701–1712, doi: 10.1002/mrm.26220 (2017). [DOI] [PMC free article] [PubMed] [Google Scholar]
- 13.Gudino N et al. Parallel transmit excitation at 1.5 T based on the minimization of a driving function for device heating. Med Phys 42, 359–371, doi: 10.1118/1.4903894 (2015). [DOI] [PMC free article] [PubMed] [Google Scholar]
- 14.McElcheran CE, Yang B, Anderson KJ, Golenstani-Rad L & Graham SJ Investigation of Parallel Radiofrequency Transmission for the Reduction of Heating in Long Conductive Leads in 3 Tesla Magnetic Resonance Imaging. PLoS One 10, e0134379, doi: 10.1371/journal.pone.0134379 (2015). [DOI] [PMC free article] [PubMed] [Google Scholar]
- 15.Eryaman Y et al. Parallel transmit pulse design for patients with deep brain stimulation implants. Magn Reson Med 73, 1896–1903, doi: 10.1002/mrm.25324 (2015). [DOI] [PMC free article] [PubMed] [Google Scholar]
- 16.Etezadi-Amoli M, Stang P, Kerr A, Pauly J & Scott G Controlling radiofrequency-induced currents in guidewires using parallel transmit. Magn Reson Med 74, 1790–1802, doi: 10.1002/mrm.25543 (2015). [DOI] [PMC free article] [PubMed] [Google Scholar]
- 17.Griswold MA et al. Generalized autocalibrating partially parallel acquisitions (GRAPPA). Magn Reson Med 47, 1202–1210, doi: 10.1002/mrm.10171 (2002). [DOI] [PubMed] [Google Scholar]
- 18.Griffin GH, Anderson KJ, Celik H & Wright GA Safely assessing radiofrequency heating potential of conductive devices using image-based current measurements. Magn Reson Med 73, 427–441, doi: 10.1002/mrm.25103 (2015). [DOI] [PubMed] [Google Scholar]
- 19.van den Bosch MR, Moerland MA, Lagendijk JJ, Bartels LW & van den Berg CA New method to monitor RF safety in MRI-guided interventions based on RF induced image artefacts. Med Phys 37, 814–821, doi: 10.1118/1.3298006 (2010). [DOI] [PubMed] [Google Scholar]
- 20.Bachschmidt TJ et al. Polarized multichannel transmit MRI to reduce shading near metal implants. Magn Reson Med 75, 217–226, doi: 10.1002/mrm.25621 (2016). [DOI] [PubMed] [Google Scholar]
- 21.Min HK et al. Deep brain stimulation induces BOLD activation in motor and non-motor networks: an fMRI comparison study of STN and EN/GPi DBS in large animals. Neuroimage 63, 1408–1420, doi: 10.1016/j.neuroimage.2012.08.006 (2012). [DOI] [PMC free article] [PubMed] [Google Scholar]
- 22.Younce JR, Albaugh DL & Shih YY Deep brain stimulation with simultaneous FMRI in rodents. J Vis Exp, e51271, doi: 10.3791/51271 (2014). [DOI] [PMC free article] [PubMed] [Google Scholar]
- 23.Yeung CJ, Susil RC & Atalar E RF safety of wires in interventional MRI: using a safety index. Magn Reson Med 47, 187–193 (2002). [DOI] [PubMed] [Google Scholar]


