Abstract
Insulin receptor substrate 1 (IRS1) is one of the major substrates for the IR, and their interaction mediates several downstream insulin signaling pathways. In this study, we have identified three novel mutations in the IRS1 gene of type 2 diabetic (T2D) patients, which reflected in the amino acid changes as I65S, R66S, and G86R in the phosphotyrosine binding domain of the IRS1 protein. The impact of these mutations on the structure and function of the IRS1 protein was evaluated through molecular modeling studies, and distinct conformational fluctuations were recorded. The variable binding affinities and positional displacement of these mutant models were observed in the ligand-binding cleft of IR. The mutant IRS1 models triggered conformational changes in the L1 domain of IR upon their binding. Such structural variations in IRS1 and IR structures due to mutations resulted in variable molecular interactions that could lead to altered insulin transduction, followed by insulin resistance and T2D.
Introduction
Type 2 diabetes (T2D) is a late onset polygenic disease, which is caused by relative rather than absolute insulin deficiency. Several genes and their combinations of common variants contributing to the risk of T2D have been identified using investigations of candidate genes.1−3 Identification of disease susceptibility genes, which leads to the T2D risk, is one of the major tasks as T2D results from multiple complications. The genes which are thought to be involved in the pancreatic cell function, insulin action/glucose metabolism, and other metabolic conditions are considered as candidate genes for identifying the disease susceptibility genes.4,5 So far, no single gene mutation has been identified as sole contributor to cause T2D.6−10 Several genes such as inwardly rectifying potassium channel (KIR6.2), insulin receptor substrate 1 (IRS1), sulfonylurea receptor (SUR-1), glucokinase (GK), insulin (INS), fatty acid binding protein (FABP2), LPL (lipoprotein lipase), and so on were reported to be associated with the risk of developing T2D.9−12
In the present study, we aimed on the IRS1 gene, which plays a key role in downstream signaling of insulin and insulin-like growth factors (IGFs). IRS1 transmits the signals from insulin and insulin growth factors (IGFs) to P13K/Akt and Erk map kinase pathways and plays an important role in the metabolic and mitogenic functions.13−15 Perturbations in IRS1 complexes may lead to the progression of insulin resistance and T2D as IRS1 plays a central role in the insulin metabolism. Earlier, it has been reported that the G972R mutation in the IRS1 gene has shown to impair its function and also to be associated with coronary artery disease (CAD). This mutation was observed to be highly significant with insulin resistance in the T2D patients, and the frequency of the G972R mutation was found to be higher among the patients with CAD. This mutation greatly increases the risk of CAD in obese patients having abnormalities in the insulin resistance syndrome. This represents that such mutations in the IRS1 gene can be used as genetic markers to predict the risk of CAD in T2D patients.16 Experimental studies in mice with combined IR and IRS1 mutations showed that IRS1 is an important factor to mediate the action of insulin in peripheral tissues and the mutant IRS1 induced T2D in the experimental models. The IRS1 mutant models were specifically observed to develop severe insulin resistance in skeletal muscle and liver, with compensatory β-cell hyperplasia. This indicates that insulin resistance is tissue-specific in vivo with IRS1 mutations.17 IRS1 forms signaling complexes with IR and several intracellular signaling partners that act as key networks and link the intracellular machinery with the plasma membrane. IRS1 contains two domains such as pleckstrin homology and phosphotyrosine binding (PTB) domains, through which it interacts with IR and IGF 1 receptor.18,19 IRS1 is a major substrate for IR and implicated in the insulin signaling pathways where a cytoplasmic protein is rapidly phosphorylated by receptor tyrosine kinases at multiple tyrosine residues in the PTB domain, which is followed by autophosphorylation of IR. The tyrosine-phosphorylated IRS1 then interacts with a variety of partners among which the major one is IR.20−23 Because IRS1 is the key mediator, the regulation of interaction between IRS1 and IR is considered to be primarily important for the insulin signaling.24 Abnormal protein–protein interactions involving IRS1 with its interacting partners such as IR may interfere with altered insulin transduction and lead to insulin resistance and T2D. Several variants in the coding region of the IRS1 gene have been reported to contribute to the susceptibility of T2D.25−33 These variants cause altered functioning of IRS1 and affect its interaction with its major interacting partner, IR. The responsible factors for the invariable interactions due to IRS1 mutations are to be delineated, and their molecular mechanism is also to be determined. Earlier studies reported that the presence of natural mutations in the IRS1 gene is responsible for decreased interaction with IR and leads to the development of insulin resistance and T2D.34 However, the molecular basis behind the development of T2D due to invariable interactions between IRS1 and IR has not been explained so far. In this concurrence, we aimed to screen the mutations in the IRS1 gene in a population of T2D patients and projected to predict the mechanism of their interaction and variable factors in the mutant condition when compared to the wild type. We have carried out the similar kind of study where we identified the impact of mutations in the GK gene and explained their consequences, leading to T2D through molecular modeling studies.35 Such encouraging results and the availability of crystal structures of IRS1 and IR in the protein data bank (PDB) database helped us to step forward to find out the significant factors responsible for their interactions under wild-type and mutated conditions.
Results and Discussion
Identification of Mutations
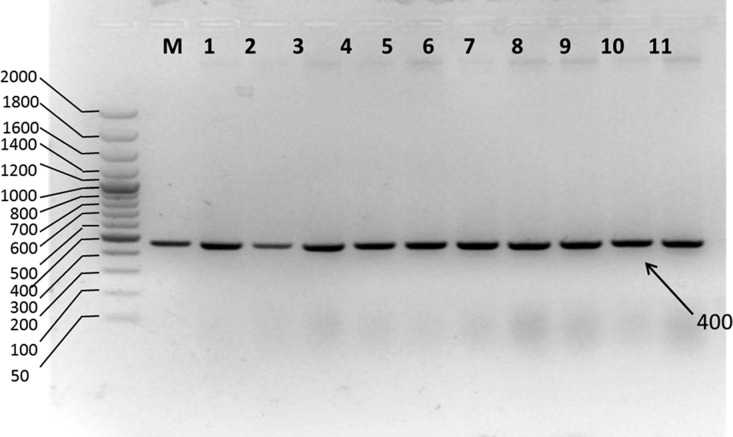
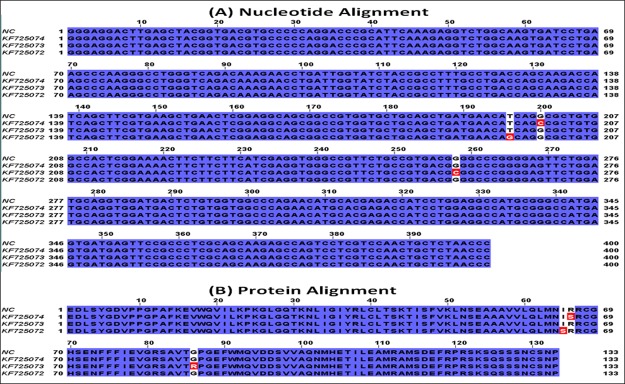
Agarose gel electrophoretic analysis of isolated genomic DNA showed sharp bands below the wells, which indicates the well integrity of isolated genomic DNA (Supporting Information, Figure S5). Amplified products when run on 2% agarose gel showed a 400 bp product, which was evident when compared with a molecular marker (Figure 1). The genetic analysis of the IRS1 gene in 30 T2D patients revealed that one patient showed T–G transversion and two patients showed G–C transversions at different locations. No mutations were observed in the remaining patients and normal controls. These nucleotide changes reflected as I–S, R–S, and G–R amino acid changes. The identified mutations, change in codons, and the respective change in the amino acids along with their positions in the IRS1 protein are shown in the Supporting Information (Table S1), and the corresponding sequence alignments are represented in Figure 2. So far, several mutations have been identified in the IRS1 gene and were reported to contribute a high risk of T2D and obesity.23−31 Although these mutations and their physiological impact have been reported in the earlier studies, their molecular mechanism and structural basis behind the development of T2D due to IRS1 mutations have not been reported so far. Hence, in the present study, we aimed to predict the structural variations at the molecular level that are aroused because of mutations through molecular modeling studies. We found three novel mutations in the current study such as I65S, R66S, and G86R, and we have characterized them to know their impact on the IRS1 protein conformational changes and its invariable molecular interactions with its interacting partners especially IR.
Figure 1.
Electrophoretic gram of the PCR-amplified IRS1 gene from normal and type 2 diabetic patients. Lane M: molecular size marker (50, 100, 200, 300, 400, 500, 600, 700, 800, 1000, 1200, 1400, 1600, 2000). Hyper ladder 50 bp (Bio-33054, Bioline Pvt ltd); lanes 1 to 11: PCR products of 400 bp size obtained from custom-designed primers in T2D patients and normal control blood samples.
Figure 2.
Sequence alignment of IRS1 (A) nucleotide and (B) protein sequences obtained from T2D patients. The mutations in the nucleotide sequences and the respective amino acid changes in the proteins are shown in red color. NC indicates normal control, and KF725074, KF725073, and KF725072 indicate the NCBI accession numbers.
In Silico Characterization of Mutations
The wild-type model of IRS1 was obtained from PDB, and it was used as a reference model to study the effect of mutations on the protein conformation so that its pathogenicity can be predicted. Introduction of mutation into the wild-type model and generation of the mutated IRS1 structures will not justify the answer where the molecular dynamics (MD) simulations will play a major role in estimating the probabilities of how far the mutated structures will behave in the diabetic patients with mutations in the IRS1 gene, thereby contributing to the pathogenicity. Hence, we have performed 50 000 ps MD protocol to observe the behavior of mutated IRS1 structures when compared with the wild-type model. Initially, all the models were optimized, refined, and subjected to simulations. The simulated structures showed the best stereochemical quality validated by using Ramachandran plots where all the residues of wild-type and mutant IRS1 structures were observed to fall in the allowed regions only (Supporting Information, Figures S6–S9). The energy levels and conformational variations of the structures were given major priority, which are the major factors that will affect the reactivity and behavior of IRS1. The MD simulations revealed some interesting points about the mutated structures, that is, initially, the total energy (potential + kinetic) plot of the IRS1 structures revealed that the wild-type IRS1 tend to be stabilized at the energy levels of 1400 kcal/mol and was found to be in a stable condition throughout the 50 000 ps simulation period. However, these energy levels were reduced to 1300 kcal/mol in the three mutated IRS1 structures at the starting phase of simulation and continued to be stabilized at the same value up to 50 000 ps (Figure 3). Further, there also exist clear-cut fluctuations in the root-mean-square deviation (rmsd) ranges of mutated IRS1 structures when compared to wild type (Figure 4). The wild-type model showed fluctuations up to 40 000 ps, and after that, it started to stabilize at a range of 5.8 Å. However, this case is completely different for the mutated structures where all the three mutated structures showed fluctuations in initial stages only and they started to stabilize further, but surprisingly around different rmsd ranges. The I65S-mutated IRS1 model stabilized around 6.8 Å, R66S around 4.5 Å, and G86R around 7.2 Å. Further, the final conformations at the end of the simulation period were superimposed together, and the rmsd matrix showed that there exist huge rmsd variations (Figure 5).
Figure 3.
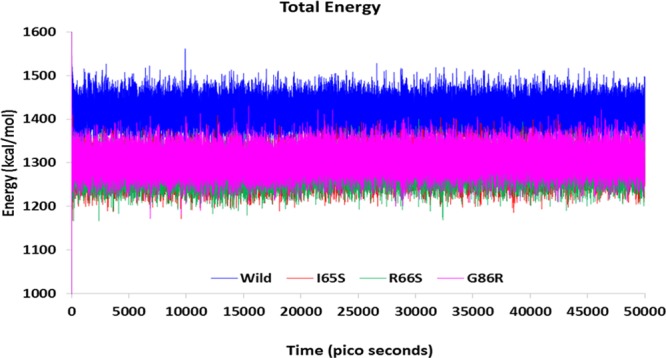
Total energy transitions of wild-type and mutated IRS1 models during 50 000 ps simulation period. Further, there exist clear-cut fluctuations in the rmsd ranges of mutated IRS1 structures also when compared to wild type.
Figure 4.
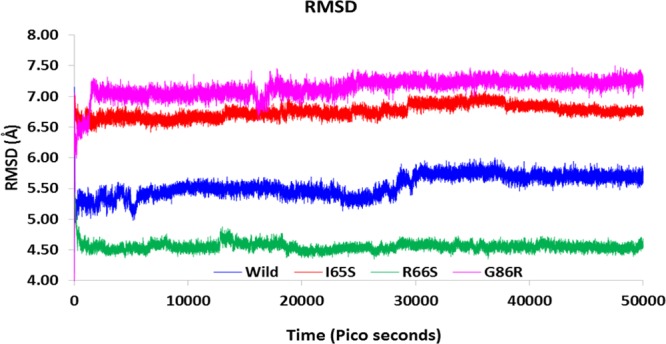
Rmsd fluctuations in the wild-type and mutated IRS1 models during 50 000 ps simulation period.
Figure 5.
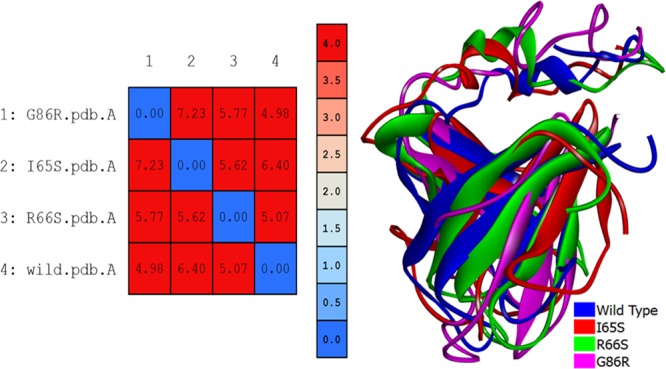
Superimposition of wild-type and mutated IRS1 structures. The values from the rmsd matrix indicate the extent of rmsd variation among the structures. The blue to red color indicates the increasing rate of variation in rmsd.
Observation of conformational elements from PDBsum analysis revealed that there is a loss of one sheet in the R66S-mutated structure and a loss of three beta hair pins and one strand in the G86R structure. The wild-type model has only one helical element in its structure, and this element has been lost in the G86R structure and an additional helix was formed in the R66S-mutated structure. Variations were also observed in the number of beta bulges, beta turns, and gamma turns (Supporting Information, Table S2). It is clear from these observations that the mutations may not affect the energy levels, but there are considerable variations in the conformation of the protein. There exists a clear spatial restraint in the orientation of the conformational elements after mutations, which is evident from the PDBsum and rmsd observations. Such conformational fluctuations result in the altered activity of the protein, causing the pathogenic condition in the patients with mutations in the IRS1 gene. Finally, it could be said that MD studies pave the best way to expel the effect of the mutation on the protein conformation and catalysis through in silico means within a very less span of time and also the cost of the experimental analysis can be reduced to maximum extent.49 This study may need to be investigated furthermore, where the variation in its activity is to be revealed, so that the molecular basis for the T2D condition due to IRS1 mutations could be cleared. Hence, the current study was progressed to find out its intermolecular interactions with its major interacting partner IR in both wild-type and mutated conditions so that the variable and responsible factors will be identified, which could be even plausible factors disturbing the insulin signaling network.
MD simulations were also carried out for the IR structure to get reliable binding poses during the docking process. The simulation results of IR showed that the structure was stabilized at an energy level of 9500 kcal/mol and an rmsd of 3 Å. The lowest energy conformation was taken for performing protein–protein docking studies with the IRS1 protein. The energy and rmsd plots of the IR structure generated during 50 000 ps simulation period are provided in the Supporting Information (Figures S10 and S11).
Protein–Protein Docking Studies of IRS1 and IR
The protein–protein docking study was successfully implemented between the stabilized structures of IRS1 and IR using Z-dock module of Discovery Studio. One hundred top pose clusters were generated from each docking process with a total of 2000 poses. Among all the poses, the dock conformation with the best Z-dock score and Z-rank score was considered for the interpretation of the results. We have observed some noteworthy results with the docking scores of IRS1 wild-type and mutated structures against the IR protein. Analyses of Z-dock scores revealed that the wild-type IRS1 dock pose showed a docking score of 15.72 kcal/mol. According to the Z-dock algorithm of Discovery Studio, the higher the docking score, the higher will be the strength of the complex. The Z-rank scores evaluate the top poses in the top cluster of each docking process, and the lowest Z-rank score indicates the best docked pose among the total poses. Such top poses with the lowest Z-rank scores will be having the highest dock score in such a cluster and indicate to consider that pose with the lowest Z-rank and the highest Z-dock score. When compared to the docking score of the wild-type IRS1 docking pose, all the mutant IRS1 docked poses such as I65S, R66S, and G86R showed increased docked scores of 15.74, 20.30, and 18.06 kcal/mol (Supporting Information, Table S3). These docking scores were observed to be surprising where the presence of each mutation increases the interaction with IR, where among all, R66S showed the highest Z-dock score. It could be predicted from these Z-dock scores that these mutations may be responsible for the increased binding of IRS1 with IR, making its dissociation a bit complicated so that it may be unavailable for further interacting partners to proceed for next downstream steps in the insulin signaling pathway.
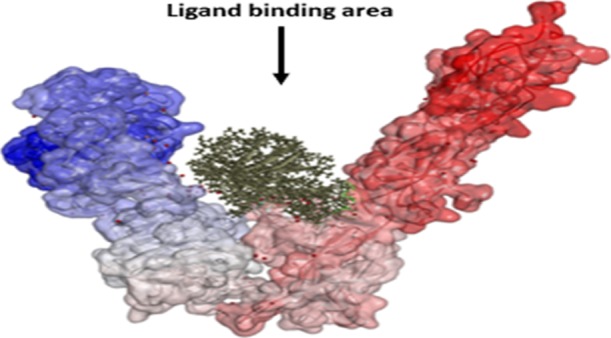
The interactions between IRS1 and IR were not only defined in terms of affinities based on Z-dock scores, but also the orientations and intermolecular interactions were analyzed in wild-type and mutated conditions. Before discussing the orientation of IRS1 structures with IR, it is necessary to know the structural organization of IRS1 and IR proteins. The IRS1 protein taken in this study is the PTB domain, which is a single A chain containing two alpha helices and eight beta strands.50 The PDBsum analysis of IRS1 showed that it contains a protein interface binding domain formed with Leu208, Met209, Asn210, Ile211, Arg212, Arg213, Cys214, Gly215, His216, Ser217, Phe222, Gly226, Arg227, Leu254, Met257, Arg258, Met260, and Ser261 residues. These residues are known to be involved in protein–protein interactions forming nonbonded interactions (Figure 6A). IR contains six domains in its structure such as L1 (leucine-rich repeat 1), CR (cysteine-rich), L2 (leucine-rich repeat 2), FnIII-1 (fibronectin-type III-1), FnIII-2 (fibronectin-type III-2) and FnIII-3 (fibronectin-type III-3) organized in a V-shape manner among which the first three domains form one leg of V and another three domains form another leg of V. The N-terminus of the IR protein starts with the L1 domain, and the FnIII-3 domain ends with the C-terminus. L2 and FnIII-1 domains join the two legs of the V shape at its apex (Figure 6B). A high-affinity state of IR is formed by the rearrangement of these domains, which results in trans-phosphorylation of intracellular kinases and binding of other regulatory partners such as IRS1. The ligand-binding region is accomplished by the extensive interaction between L1 and CR domains and the rigidity of FnIII-2 and FnIII-3 domains. Potential rearrangements and movements occur at the junctions of CR-L2, L2–FnIII-1, and FnIII-1–FnIII-2 domains. The apex of the V shape possessing L2 and FnIII-1 does not have any extensive contact areas as most of their molecular surface areas are buried inside the apex. The region ahead of these two domains in the V shape offers the interaction site to bind with the interacting partners.51
Figure 6.
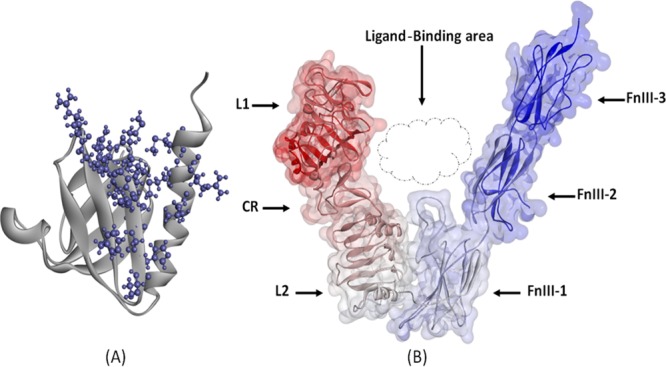
(A) Structure of the IRS1 protein (Cartoon model) showing the protein interface binding domain represented in a ball and stick model and (B) structural organization of the IR protein represented with various domains along with the ligand-binding area.
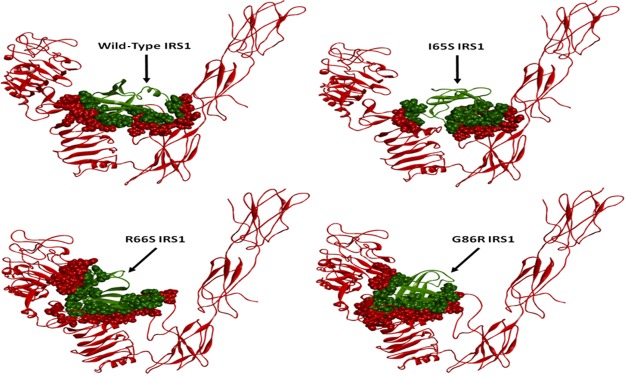
Such an extensive availability of experimental information made us to strengthen our predicted interactions among IR and IRS1 wild-type and mutant structures. As a standard reference, we initially observed the molecular interactions formed in the docking complex of wild-type IRS1–IR. The IRS1 structure formed 10 hydrogen bonds and 3 π-interactions with the IR protein. The residues such as pro158, lys171, gln175, asn198, ser199, glu200, and ser261 from IRS1 were found to form hydrogen bond interactions with ser290, glu355, ala356, phe518, pro617, and ser619 residues of IR, whereas the residues such as met156, phe160, and cys186 from IRS1 formed π-interactions with phe518 and trp559 residues of IR. IRS1 was observed to form the contact surface area of 623.36 Å2 with the IR contact surface area of 625.47 Å2 at the binding cleft. With such interactions, IRS1 was being held in the center of two legs of the IR structure contacting the CR domain at one side and both FnIII-1 and FnIII-2 domains at the other side. This orientation and molecular interactions of the IRS1 wild-type model in IR were compared and correlated with mutated conditions (Figure 7 and Supporting Information, Table S4).
Figure 7.
Binding mode orientations of IRS1 wild-type, I65S, R66S, and G86R mutant structures (green) with IR (red). The contacting surfaces are represented as spheres among both the structures. The variations in the position of IRS1 may be observed in the mutated condition when compared to wild type.
The binding orientations of IRS1 mutants were found to be variable with the IR when compared to wild-type IRS1. The number of hydrogen bonds was increased in the mutated structures where I65S, R66S, and G86R formed 11, 12, and 14 hydrogen bonds, respectively. The residue gln175 from the I65S mutant was found to commonly form hydrogen bonding as observed in wild-type IRS1 but with a different residue from IR. All the remaining hydrogen bonds in three mutant IRS1 structures were found to be formed by completely different residues when compared to the wild-type IRS1 model. Further, the interacting residues from IR were also observed to be different to the residues interacting with wild-type IRS1. This indicated the existence of a variable hydrogen bonding pattern between IR and IRS1 mutant models.
Further consideration of π-bond interactions was also found to be variable when compared to wild-type IRS1. No residues were found to form similar kind of π-bonds that were observed in the wild-type IRS1 docking pose. The surface area contacts made in the I65S IRS1–IR docking complex were found to be reduced when compared to the wild-type IRS1–IR docking complex, whereas it was greatly increased in R66S- and G86R-mutated IRS1–IR docking complexes. Such variations in the binding mode of IRS1 mutant models made them to exist in different orientations in the IR ligand-binding region. The I65S mutant IRS1 was observed to move toward the linking region of FnIII-1 and FnIII-2 domains where the R66S and G86R mutant models were observed in completely different orientations when compared to wild-type IRS1. These both mutant models shifted toward the CR domain of IR. In addition to this, the L1 domain of IR was also observed to interact with R66S- and G86R-mutated IRS1 structures. Positional variation in the L1 domain of IR was observed in the docking poses of R66S and G86R IRS1 mutants where the domain was slightly moved toward the IRS1 structure inside the cleft of V-shape. These conformational variations observed in the IRS1 structure due to mutations could be the responsible factors for the variable docking scores and altered binding mode orientations within the IR ligand-binding region. Finally, all such variations contributing to the invariable interactions of IRS1 and IR disturb the insulin signaling pathway.
Conclusions
In this work, we have identified three novel mutations in the IRS1 gene, viz., I65S, R66S, and G86R, in a population of T2D patients. The impact of these mutations on the IRS1 structural conformation was studied, and the variable factors were identified in terms of rmsd and conformational elements. The mutant IRS1 models showed variable binding energies with IR and triggered conformational variations in the IR structure especially in the L1 domain. Variable binding mode orientations of mutant IRS1 structures were observed in the ligand-binding region of the IR structure, resulting in their positional displacement. All these factors could be responsible for the variable interaction of IRS1 and IR, resulting in altered insulin transduction, leading to the development of T2D. This study had explained at its best and provided a probable molecular mechanism behind the development of T2D in the people with mutations in the IRS1 gene.
Materials and Methods
The ethical committee of CKS Teja Institution, Tirupati, India, had reviewed the present study protocol and given clearance to carry out the work under the reference number CKS/Ethical/JAN/2013 dated 21.01.2013. All methods were performed in accordance with the relevant guidelines and regulations by institutional ethical guidelines. A study participant was identified, and specific consent was obtained and informed to publish the information willingly. The chemicals used in this study were purchased from Sigma Chemical Co. (St. Louis, MO, USA) and Hi Media Pvt Ltd, and plastic wares were purchased from Oxygen Co. Pvt.
Retrieval of Gene Sequence and Primer Designing
The IRS1 gene sequence was retrieved from the National Center for Biotechnology Information (NCBI) (ID: 3667), the PTB domain was taken as the target, and primers were designed spanning the coding region of about 400 bp (forward: 5′GGGAGGACTTGAGCTACGG3′; reverse: 5′GGGTTAGAGCAGTTGGACGA3′). Primers were verified for secondary structures and primer–dimer formation by using the Sigma DNA Calculator (http://www.sigma-genosys.com/calc/DNACalc.asp), and the designed primers were synthesized from Europhins Pvt. Ltd, India.
Sample Collection
Whole blood samples of 10 normal and 30 T2D patients were obtained from CKS Teja Hospital, Tirupati, India. The samples were stored at 4 °C in a refrigerator temporarily and used for the isolation of genomic DNA. Sequence data have been deposited at NCBI https://www.ncbi.nlm.nih.gov/under accession numbers: AHG12642.1, AHG12643.1, AHG12644.1 of IRS1, partial (Homo sapiens).
Isolation Genomic DNA from Blood
Genomic DNA was isolated from whole blood samples by a salting-out method as per the protocol of Lahiri et al.36 Concentration and purity of the obtained DNA were estimated by spectrophotometric analysis, and the integrity of DNA was analyzed by running agarose gel electrophoresis.
Polymerase Chain Reaction (PCR)
A PCR was set to amplify the PTB domain region of 400 bp from the IRS1 gene by using the custom-designed primers. The PCR mixture included 2× ready mix Taq PCR master mix (Sigma p4600), 500 ng of template DNA, and 0.5 μM of forward and reverse primers. Thermal profile parameters include initial denaturation at 95 °C for 5 min, denaturation at 95 °C for 30 s, annealing temperature at 55.2 °C for 30 s, extension at 72 °C for 1 min, and final extension at 72 °C for 5 min. The obtained PCR products were sent for sequencing to Bio Corporals Pvt. Ltd, Chennai, India.
Sequence Analysis and Identification of Mutations
The obtained IRS1 gene sequences of normal and T2D patients were subjected to sequence alignment using ClustalX tool37 where ungapped alignment was carried out and the mismatch regions were identified, which represent the change in the nucleotides. Further, the nucleotide sequences were translated into protein sequences, again ungapped alignment was carried out and the change in amino acid residues was identified.
In Silico Characterization of Mutations
Three mutations I65S, R66S, and G86R were identified from three T2D patients and subjected to in silico characterization where the effect of each mutation on the IRS1 protein was studied individually. The NMR-resolved structure of the IRS1 protein was retrieved from the PDB (ID: 1IRS) and loaded into molecular operating environment (MOE) software.38 The ligand groups and hetero atoms such as IL-4 receptor phosphopeptide present in the structure were removed, and hydrogen atoms were added to the structure. Protonation was done, followed by energy minimization in MMFF94x39−44 force field to an rms gradient of 0.05. This energy-minimized structure was used to generate the mutated structures by introducing the mutations I65S, R66S, and G86R at their respective locations. The energy minimization process was iterated with the same conditions, and finally, the optimized mutated structures were obtained. The energy-minimized conformations of wild-type and mutated IRS1 structures were subjected to MD simulations individually in the same force field.45 The NPT (number of particles, pressure, and temperature) statistical ensemble was specified by fixing the temperature and pressure with constant values. Nose–Poincare–Anderson algorithm was specified, and the temperature was started at 30 K and increased to 300 K during the run time. The heat time was set to 30 picoseconds (ps), followed by the equilibration of the system for 1000 ps, and the production time of simulations was carried out for 50 000 ps in an implicit solvent environment. The total energy and rmsd values of each conformation were plotted as a graph to observe and correlate the energy variations among wild-type and mutated IRS1 conformations.
The detailed structural analyses of all the simulated structures were studied using PDBsum web interface.46,47 The stabilized conformations of wild-type and mutated IRS1 structures obtained at the end phase of the production period of MD simulations were submitted to PDBsum, and the conformational variations were identified, which are due to respective mutations in the structure. The conformational variations were measured and correlated in terms of sheets, β-hairpins, β-bulges, strands, helices, β-turns, and γ-turns, which they contained in their conformations. All the mutated IRS1 structures were superimposed with the wild-type IRS1 model, and the variations in the rmsd values were represented as a matrix.
Protein–Protein Docking Studies
All the low-energy-stabilized conformations of wild-type and mutated IRS1 structures obtained at the end phase of the production period of the MD simulations were used to perform protein–protein docking studies against the IR protein. This step is anticipated to identify the binding mode of the IRS1 structure under wild-type and different mutated conditions so that the effect of each mutation on the reactivity of IRS1 could be revealed out. Prior to the docking process, the IR structure was processed and prepared where the X-ray crystal structure of IR was obtained from PDB (ID: 2DTG) at a resolution of 3.80 Å. This structure is a dimer and found to have fab fragments. While processing the structure, fab fragments, water molecules, and other hetero atoms were removed and subjected to protonation, followed by energy minimization. The energy-minimized structure was further subjected to MD simulations in MOE with the same conditions used for the simulations of the IRS1 structure, and the finally obtained IR conformation was used for docking studies.
Molecular docking between IRS1 (wild type and three mutants) and IR was carried out individually using the Z-dock module of Discovery Studio v.4.0. Initially, IRS1 and IR structures were loaded in the Discovery Studio working space, and the IR structure was set as the receptor and IRS1 structures as ligands. Four individual docking reactions were carried out for wild-type, I65S, R66S, and G86R mutants, respectively, against the IR protein. A rigid body docking method was used with an angular step size of 6 Å for the rotational sampling of IRS1 orientations. A distance cutoff value of 10 Å was specified, and a maximum of 2000 docked poses were generated in each docking process. The poses were ranked using the Z-rank algorithm that includes detailed electrostatics, van der Waals, and desolvation energy terms.48 The top poses were grouped into 100 maximum clusters with an rmsd cutoff of 10 Å and an interface cutoff of 10 Å. After the docking process, the largest cluster with top poses was taken, and the pose with the best Z-rank and Z-dock score was saved. The intermolecular interactions formed in the docking complexes of IRS1 and IR were analyzed by protein interface analysis module of Discovery Studio where hydrogen bonds, π-bonds, and salt bridges were analyzed along with the interacting amino acid residues. Further, the contacting interface areas of IRS1 and IR in the docking complexes were also determined.
Acknowledgments
We thank Dr.V.Koteswara Rao, Kansas University, USA, for his kind help to work with MOE software which has been used for the molecular modeling studies.
Supporting Information Available
The Supporting Information is available free of charge on the ACS Publications website at DOI: 10.1021/acsomega.8b01712.
Genetic analysis of the IRS1 gene in T2D patients showing the identified mutations and their reflection in amino acid changes, PDBsum analysis of wild-type and mutated IRS1 structures, protein–protein docking of IRS1 wild-type results, analysis of intermolecular interactions through Z-dock results, agarose gel images of genomic DNA isolated from normal controls and T2D patients, Ramachandran plots and total energy plot of IR dynamics simulations, and rmsd plot of IR generated from 50 000 ps MD simulations (PDF)
Author Contributions
P.C.V., N.K.Y., and S.Y. performed experiments, P.K.J.A., N.K.Y., and P.C.V. interpreted the data and wrote the manuscript. B.M. conceived and supervised the work.
The authors declare no competing financial interest.
Supplementary Material
References
- Rich S. S. Genetics of diabetes and its complications. J. Am. Soc. Nephrol. 2006, 17, 353–360. 10.1681/asn.2005070770. [DOI] [PubMed] [Google Scholar]
- St-Pierre J.; Vohl M. C.; Despres J. P.; Gaudet D.; Poirier P. Genetic aspects of diabetes and its cardiovascular complications: contribution of genetics to risk assessment and clinical management. Can. J. Cardiol. 2005, 21, 199–209. [PubMed] [Google Scholar]
- Froguel P. What did we learn from genetics of type 2 diabetes and its 59 complications?. Nephrologie 1999, 20, 59–63. [PubMed] [Google Scholar]
- Barroso I.; Luan J.; Middelberg R. P. S.; Harding A.-H.; Jakes R. W.; Clayton D.; Schafer A. J.; O’Rahilly S.; Wareham N. J.; Wareham N. J. Correction: Candidate Gene Association Study in Type 2 Diabetes Indicates a Role for Genes Involved in β-Cell Function as Well as Insulin Action. PLoS Biol. 2003, 1, e92. 10.1371/journal.pbio.0000092. [DOI] [PMC free article] [PubMed] [Google Scholar]
- Stumvoll M. Control of glycaemia: from molecules to mCen. Minkowski Lecture. Diabetologia 2003, 47, 770–781. 10.1007/s00125-004-1400-0. [DOI] [PubMed] [Google Scholar]
- Klupa T.; Skupien J.; Mirkiewicz-Sieradzka B.; Gach A.; Noczynska A.; Zubkiewicz-Kucharska A.; Szalecki M.; Kozek E.; Nazim J.; Mlynarski W.; Malecki M. T. Efficacy and safety of sulfonylurea use in permanent neonatal diabetes due to KCNJ11 gene mutations: 34-month median follow-up. Diabetes Technol. Ther. 2010, 12, 387–391. 10.1089/dia.2009.0165. [DOI] [PubMed] [Google Scholar]
- Parikh H.; Groop L. Candidate genes for type 2 diabetes. Rev. Endocr. Metab. Disord. 2004, 5, 151–176. 10.1023/b:remd.0000021437.46773.26. [DOI] [PubMed] [Google Scholar]
- Malecki M. T.; Skupien J.; Klupa T.; Wanic K.; Mlynarski W.; Gach A.; Solecka I.; Sieradzki J. Transfer to sulphonylurea therapy in adult subjects with permanent neonatal diabetes due to KCNJ11-activating mutations: evidence for improvement in insulin sensitivity. Diabetes Care 2007, 30, 147–149. 10.2337/dc06-1628. [DOI] [PubMed] [Google Scholar]
- Hattersley A. T.; Ashcroft F. M. Activating Mutations in Kir6.2 and Neonatal Diabetes: New Clinical Syndromes, New Scientific Insights, and New Therapy. Diabetes 2005, 54, 2503–2513. 10.2337/diabetes.54.9.2503. [DOI] [PubMed] [Google Scholar]
- Sagen J. V.; Raeder H.; Hathout E.; Shehadeh N.; Gudmundsson K.; Baevre H.; Abuelo D.; Phornphutkul C.; Molnes J.; Bell G. I.; Gloyn A. L.; Hattersley A. T.; Molven A.; Sovik O.; Njolstad P. R. Permanent neonatal diabetes due to mutations in KCNJ11 encoding Kir6.2: patient characteristics and initial response to sulfonylurea therapy. Diabetes 2004, 53, 2713–2718. 10.2337/diabetes.53.10.2713. [DOI] [PubMed] [Google Scholar]
- Kahn C. R.; Vicent D.; Doria A. Genetics of non-insulin-dependent (type-II) diabetes mellitus. Annu. Rev. Med. 1996, 47, 509–531. 10.1146/annurev.med.47.1.509. [DOI] [PubMed] [Google Scholar]
- Picot J.; Jones J.; Colquitt J. L.; Gospodarevskaya E.; Loveman E.; Baxter L.; Clegg A. J. The clinical effectiveness and cost-effectiveness of bariatric (weight loss) surgery for obesity: a systematic review and economic evaluation. Health Technol. Assess. 2009, 13, 215–357. 10.3310/hta13410. [DOI] [PubMed] [Google Scholar]
- Fukushima T.; Yoshihara H.; Furuta H.; Kamei H.; Hakuno F.; Luan J.; Duan C.; Saeki Y.; Tanaka K.; Iemura S.; Natsume T.; Chida K.; Nakatsu Y.; Kamata H.; Asano T.; Takahashi S.-I. Nedd4-induced monoubiquitination of IRS-2 enhances IGF signalling and mitogenic activity. Nat. Commun. 2015, 16, 6780. 10.1038/ncomms7780. [DOI] [PubMed] [Google Scholar]
- Togashi Y.; Shirakawa J.; Orime K.; Kaji M.; Sakamoto E.; Tajima K.; Inoue H.; Nakamura A.; Tochino Y.; Goshima Y.; Shimomura I.; Terauchi Y. β-Cell Proliferation After a Partial Pancreatectomy Is Independent of IRS-2 in Mice. Endocrinology 2014, 155, 1643–1652. 10.1210/en.2013-1796. [DOI] [PubMed] [Google Scholar]
- Ozaki Y.; Takeda T.; Akanishi N.; Hakuno F.; Toyoshima Y.; Takahashi S.-I.; Takenaka A. Insulin injection restored increased insulin receptor substrate (IRS)-2 protein during short-term protein restriction but did not affect reduced insulin-like growth factor (IGF)-I mRNA or increased triglyceride accumulation in the liver of rats. Biosci., Biotechnol., Biochem. 2014, 78, 130–138. 10.1080/09168451.2014.877825. [DOI] [PubMed] [Google Scholar]
- Baroni M. G.; D’Andrea M. P.; Montali A.; Pannitteri G.; Barillà F.; Campagna F.; Mazzei E.; Lovari S.; Seccareccia F.; Campa P. P.; Ricci G.; Pozzilli P.; Urbinati G.; Arca M. A common mutation of the insulin receptor substrate-1 gene is a risk factor for coronary artery disease. Arterioscler., Thromb., Vasc. Biol. 1999, 19, 2975–2980. 10.1161/01.atv.19.12.2975. [DOI] [PubMed] [Google Scholar]
- Kido Y.; Burks D. J.; Withers D.; Bruning J. C.; Kahn C. R.; White M. F.; Accili D. Tissue-specific insulin resistance in mice with mutations in the insulin receptor, IRS-1, and IRS-2. J. Clin. Invest. 2000, 105, 199–205. 10.1172/jci7917. [DOI] [PMC free article] [PubMed] [Google Scholar]
- Geetha T.; Langlais P.; Luo M.; Mapes R.; Lefort N.; Chen S.-C.; Mandarino L. J.; Yi Z. Label-Free Proteomic Identification of Endogenous, Insulin-Stimulated Interaction Partners of Insulin Receptor Substrate-1. J. Am. Soc. Mass Spectrom. 2011, 22, 457–466. 10.1007/s13361-010-0051-2. [DOI] [PMC free article] [PubMed] [Google Scholar]
- Grimmsmann T.; Levin K.; Meyer M. M.; Beck-Nielsen H.; Klein H. H. Delays in insulin signaling towards glucose disposal in human skeletal muscle. J. Endocrinol. 2002, 172, 645–651. 10.1677/joe.0.1720645. [DOI] [PubMed] [Google Scholar]
- Sun X. J.; Miralpeix M.; Myers M. G.; Glasheen E. M.; Backer J. M.; Kahn C. R.; White M. F. Expression and Function of Irs-1 in Insulin Signal Transmission. J. Biol. Chem. 1992, 267, 22662–22672. [PubMed] [Google Scholar]
- Wick K. R.; Werner E. D.; Langlais P.; Ramos F. J.; Dong L. Q.; Shoelson S. E.; Liu F. Grb10 inhibits insulin-stimulated insulin receptor substrate (IRS)-phosphatidylinositol 3-kinase/Akt signaling pathway by disrupting the association of IRS-1/IRS-2 with the insulin receptor. J. Biol. Chem. 2003, 278, 8460–8467. 10.1074/jbc.m208518200. [DOI] [PubMed] [Google Scholar]
- Wilden P. A.; Broadway D. Combination of insulinomimetic agents H2O2 and vanadate enhances insulin receptor mediated tyrosine phosphorylation of IRS-1 leading to IRS-1 association with the phosphatidylinositol 3-kinase. J. Cell. Biochem. 1995, 58, 279–291. 10.1002/jcb.240580303. [DOI] [PubMed] [Google Scholar]
- Backer J. M.; Myers M. G. Jr.; Sun X. J.; Chin D. J.; Shoelson S. E.; Miralpeix M.; White M. F. Association of Irs-1 with the Insulin-Receptor and the Phosphatidylinositol 3′-Kinase - Formation of Binary and Ternary Signaling Complexes in Intact-Cells. J. Biol. Chem. 1993, 268, 8204–8212. [PubMed] [Google Scholar]
- O’Neill T. J.; Craparo A.; Gustafson T. A. Characterization of an interaction between insulin receptor substrate 1 and the insulin receptor by using the two-hybrid system. Mol. Cell. Biol. 1994, 14, 6433–6442. 10.1128/mcb.14.10.6433. [DOI] [PMC free article] [PubMed] [Google Scholar]
- Celi F. S.; Negri C.; Tanner K.; Raben N.; De Pablo F.; Rovira A.; Pallardo L. F.; Martin-Vaquero P.; Stern M. P.; Mitchell B. D.; Shuldiner A. R. Molecular scanning for mutations in the insulin receptor substrate-1 (IRS-1) gene in Mexican Americans with Type 2 diabetes mellitus. Diabetes/Metab. Res. Rev. 2000, 16, 370–377. . [DOI] [PubMed] [Google Scholar]
- Hitman G. A.; Hawrami K.; McCarthy M. I.; Viswanathan M.; Snehalatha C.; Ramachandran A.; Tuomilehto J.; Tuomilehto-Wolf E.; Nissinen A.; Pedersen O. Insulin receptor substrate-1 gene mutations in NIDDM; implications for the study of polygenic disease. Diabetologia 1995, 38, 481–486. 10.1007/s001250050309. [DOI] [PubMed] [Google Scholar]
- Panz V. R.; Raal F. J.; O’Rahilly S.; Kedda M.-A.; Joffe B. I. Insulin receptor substrate-1 gene variants in lipoatrophic diabetes mellitus and non-insulin-dependent diabetes mellitus: a study of South African black and white subjects. Hum. Genet. 1997, 101, 118–119. 10.1007/s004390050598. [DOI] [PubMed] [Google Scholar]
- Laakso M.; Malkki M.; Kekäläinen P.; Kuusisto J.; Deeb S. S. Insulin receptor substrate-1 variants in non-insulin-dependent diabetes. J. Clin. Invest. 1994, 94, 1141–1146. 10.1172/jci117429. [DOI] [PMC free article] [PubMed] [Google Scholar]
- Alharbi K. K.; Khan I. A.; Munshi A.; Alharbi F. K.; Al-Sheikh Y.; Alnbaheen M. S. Association of the genetic variants of insulin receptor substrate 1 (IRS-1) with type 2 diabetes mellitus in a Saudi population. Endocrine 2014, 47, 472–477. 10.1007/s12020-014-0177-2. [DOI] [PubMed] [Google Scholar]
- Baroni M. G.; Arca M.; Sentinelli F.; Buzzetti R.; Capici F.; Lovari S.; Vitale M.; Romeo S.; Di Mario U. The G972R variant of the Insulin Receptor Substrate-1 (IRS-1) gene, body fat distribution and insulin-resistance. Diabetologia 2001, 44, 367–372. 10.1007/s001250051628. [DOI] [PubMed] [Google Scholar]
- Rieger S.; Endler G.; Mannhalter C.; Hsieh K.; Lalouschek W. The Gly1057Asp polymorphism in IRS-2 interacts with obesity to affect beta cell function. Diabetologia 2004, 47, 761–762. 10.1007/s00125-003-1302-6. [DOI] [PubMed] [Google Scholar]
- Stefan N.; Kovacs P.; Stumvoll M.; Hanson R. L.; Lehn-Stefan A.; Permana P. A.; Baier L. J.; Tataranni P. A.; Silver K.; Bogardus C. Metabolic effects of the Gly1057Asp polymorphism in IRS-2 and interactions with obesity. Diabetes 2003, 52, 1544–1550. 10.2337/diabetes.52.6.1544. [DOI] [PubMed] [Google Scholar]
- Feng X.; Tucker K. L.; Parnell L. D.; Shen J.; Lee Y. C.; Ordovás J. M.; Ling W. H.; Lai C. Q. Insulin receptor substrate 1 (IRS1) variants confer risk of diabetes in the Boston Puerto Rican Health Study. Asia Pac. J. Clin. Nutr. 2013, 22, 150–159. 10.6133/apjcn.2013.22.1.09. [DOI] [PMC free article] [PubMed] [Google Scholar]
- Yoshimura R.; Araki E.; Ura S.; Todaka M.; Tsuruzoe K.; Noboru F.; Motoshima H.; Yoshizato K.; Kaneko K.; Matsuda K.; Kishikawa H.; Shichiri M. Impact of Natural IRS-1 Mutations on Insulin Signals: Mutations of IRS-1 in the PTB Domain and Near SH2 Protein Binding Sites Result in Impaired Function at Different Steps of IRS-1 Signaling. Diabetes 1997, 46, 929–936. 10.2337/diabetes.46.6.929. [DOI] [PubMed] [Google Scholar]
- Yellapu N.; Mahto M. K.; Valasani K. R.; Sarma P. V. G. K.; Matcha B. Mutations in exons 10 and 11 of human glucokinase result in conformational variations in the active site of the structure contributing to poor substrate binding - explains hyperglycemia in type 2 diabetic patients. J. Biomol. Struct. Dyn. 2015, 33, 820–833. 10.1080/07391102.2014.913989. [DOI] [PubMed] [Google Scholar]
- Lahiri D. K.; Numberger J. I. A rapid non-enzymatic method for the preparation of HMW DNA from blood for RFLP studies. Nucleic Acids Res. 1991, 19, 5444. 10.1093/nar/19.19.5444. [DOI] [PMC free article] [PubMed] [Google Scholar]
- Thompson J.; Gibson T. J.; Plewniak F.; Jeanmougin F.; Higgins D. G. The CLUSTAL_X windows interface: flexible strategies for multiple sequence alignment aided by quality analysis tools. Nucleic Acids Res. 1997, 25, 4876–4882. 10.1093/nar/25.24.4876. [DOI] [PMC free article] [PubMed] [Google Scholar]
- Molecular Operating Environment (MOE), C.C.G.I., 1010 Sherbooke St. West, Suite #910, Montreal, QC, Canada, H3A 2R7, 2015.
- Halgren T. A. Merck molecular force field. V. Extension of MMFF94 using experimental data, additional computational data, and empirical rules. J. Comput. Chem. 1996, 17, 616–641. . [DOI] [Google Scholar]
- Halgren T. A. Merck molecular force field. III. Molecular geometries and vibrational frequencies for MMFF94. J. Comput. Chem. 1996, 17, 553–586. . [DOI] [Google Scholar]
- Halgren T. A. Merck molecular force field. I. Basis, form, scope, parameterization, and performance of MMFF94. J. Comput. Chem. 1996, 17, 490–519. . [DOI] [Google Scholar]
- Valasani K. R.; Vangavaragu J. R.; Day V. W.; Yan S. S. Structure based design, synthesis, pharmacophore modeling, virtual screening, and molecular docking studies for identification of novel cyclophilin D inhibitors. J. Chem. Inf. Model. 2014, 54, 902–912. 10.1021/ci5000196. [DOI] [PMC free article] [PubMed] [Google Scholar]
- Valasani K. R.; Chaney M. O.; Day V. W.; Yan S. S. Acetylcholinesterase inhibitors: structure based design, synthesis, pharmacophore modeling, and virtual screening. J. Chem. Inf. Model. 2013, 53, 2033–2046. 10.1021/ci400196z. [DOI] [PubMed] [Google Scholar]
- Valasani K. R.; Hu G.; Chaney M. O.; Yan S. S. Structure-Based Design and Synthesis of Benzothiazole Phosphonate Analogues with Inhibitors of Human ABAD-Aβ for Treatment of Alzheimer’s Disease. Chem. Biol. Drug Des. 2013, 81, 238–249. 10.1111/cbdd.12068. [DOI] [PMC free article] [PubMed] [Google Scholar]
- Arfeen M.; Patel R.; Khan T.; Bharatam P. V. Molecular dynamics simulation studies of GSK-3β ATP competitive inhibitors: understanding the factors contributing to selectivity. J. Biomol. Struct. Dyn. 2015, 33, 2578–2593. 10.1080/07391102.2015.1063457. [DOI] [PubMed] [Google Scholar]
- Laskowski R. A. PDBsum: summaries and analyses of PDB structures. Nucleic Acids Res. 2001, 29, 221–222. 10.1093/nar/29.1.221. [DOI] [PMC free article] [PubMed] [Google Scholar]
- Laskowski R. A.; Hutchinson E. G.; Michie A. D.; Wallace A. C.; Jones M. L.; Thornton J. M. PDBsum: a Web-based database of summaries and analyses of all PDB structures. Trends Biochem. Sci. 1997, 22, 488–490. 10.1016/s0968-0004(97)01140-7. [DOI] [PubMed] [Google Scholar]
- Pierce B.; Weng Z. ZRANK: Reranking protein docking predictions with an optimized energy function. Proteins 2007, 67, 1078–1086. 10.1002/prot.21373. [DOI] [PubMed] [Google Scholar]
- Berhanu W. M.; Masunov A. E. Full length amylin oligomer aggregation: insights from molecular dynamics simulations and implications for design of aggregation inhibitors. J. Biomol. Struct. Dyn. 2014, 32, 1651–1669. 10.1080/07391102.2013.832635. [DOI] [PubMed] [Google Scholar]
- Zhou M.-M.; Huang B.; Olejniczak E. T.; Meadows R. P.; Shuker S. B.; Miyazaki M.; Trüb T.; Shoelson S. E.; Fesik S. W. Structural basis for IL-4 receptor phosphopeptide recognition by thelRS-1 PTB domain. Nat. Struct. Mol. Biol. 1996, 3, 388–393. 10.1038/nsb0496-388. [DOI] [PubMed] [Google Scholar]
- McKern N. M.; Lawrence M. C.; Streltsov V. A.; Lou M.-Z.; Adams T. E.; Lovrecz G. O.; Elleman T. C.; Richards K. M.; Bentley J. D.; Pilling P. A.; Hoyne P. A.; Cartledge K. A.; Pham T. M.; Lewis J. L.; Sankovich S. E.; Stoichevska V.; Da Silva E.; Robinson C. P.; Frenkel M. J.; Sparrow L. G.; Fernley R. T.; Epa V. C.; Ward C. W. Structure of the insulin receptor ectodomain reveals a folded-over conformation. Nature 2006, 443, 218–221. 10.1038/nature05106. [DOI] [PubMed] [Google Scholar]
Associated Data
This section collects any data citations, data availability statements, or supplementary materials included in this article.


