Abstract
A major hallmark of cancer is a perturbed metabolism resulting in high demand for various metabolites, glucose being the most well studied. While glucose can be converted into pyruvate for ATP production, the serine synthesis pathway (SSP) can divert glucose to generate serine, glycine, and methionine. In the process, the carbon unit from serine is incorporated into the one-carbon pool which makes methionine and maintains S-adenosylmethionine levels, which are needed to maintain the epigenetic landscape and ultimately controlling what genes are available for transcription. Alternatively, the carbon unit can be used for purine and thymidylate synthesis. We present here an approach to follow the flux through this pathway in cultured human cells using stable isotope enriched glucose and gas chromatography mass spectrometry analysis of serine, glycine, and methionine. We demonstrate that in three different cell lines this pathway contributes only 1-2% of total intracellular methionine. This suggests under high extracellular methionine conditions, the predominance of carbon units from this pathway are used to synthesize nucleic acids.
Introduction
Human tumors have a distinct metabolism, most notably a predilection for glucose. However, the utility and fate of those carbon atoms remains incompletely understood. Normally in the absence of oxygen glucose is converted to pyruvate and ultimately lactate. This generates only a fraction of the ATP possible by aerobic cellular respiration, which requires oxygen as the final electron donor. While anaerobic glycolysis can be accomplished by most cells, cancer cells have the unusual property of converting much of their glucose to lactate, even in the presence of oxygen. The process is termed aerobic glycolysis. Aerobic glycolysis underlies the Warburg effect, long recognized as a defining property of many cancers [1]. Much of the glucose can of course be used as a source of ATP, albeit less efficiently than oxidative phosphorylation which yield 2 ATP and 36 ATP per equivalent of glucose, respectively. But, there may be some benefits despite the trade-off, such as a higher rate of ATP generation on demand [1,2].
While it may seem paradoxical to use a less efficient system to generate ATP, glycolytic intermediates feed into many other important pathways. For example, the pentose phosphate pathway is used to generate ribose sugars and NADPH, both of which are important in DNA/RNA synthesis and anabolic processes. Others have argued glycolysis allows a tumor a certain plasticity in order to rapidly respond to a changing microenvironment [3]. Additionally the glycolytic intermediate, 3-phosphoglycerate, can be diverted to generate serine which can be utilized to synthesize nucleic acids which are essential for cell proliferation [4].
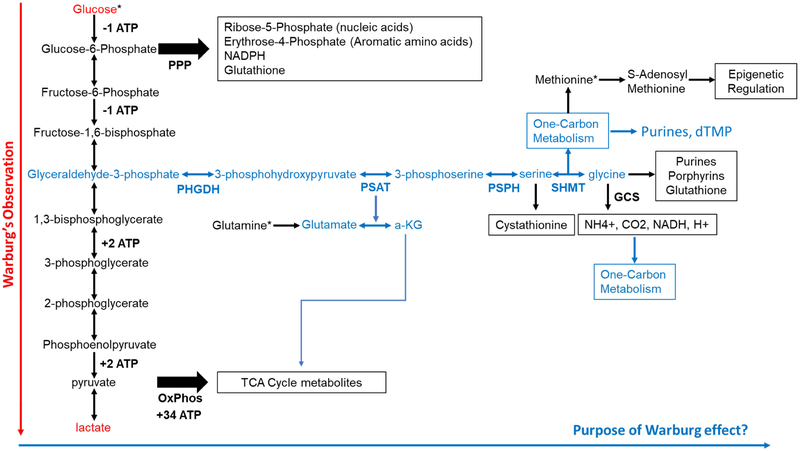
In this study we have investigated the incorporation of carbon from glucose into the amino acids glycine, serine and methionine (Fig. 1). Phosphoglycerate dehydrogenase (PHDGH) is the rate-limiting enzyme in the conversion of 3-phosphoglycerate into serine [5]. Serine can donate a carbon atom to tetrahydrofolate by way of serine hydroxymethyl transferase (SHMT), which can then be used for de novo purine synthesis or thymidylate synthesis [6,7]. Alternatively, the carbon unit can be transferred from serine to homocysteine to form methionine.
Figure 1. Glucose metabolism, energy production, and its importance in DNA replication and epigenetic homeostasis.
Glucose is metabolized to pyruvate which can serve as a substrate for oxidative phosphorylation. It can also be converted from there to lactate to maintain flux through glycolysis. This underlies the Warburg effect (red/red arrow). However, glucose metabolism is much more complex and serves many other purposes other than production of precursors for aerobic respiration, including the pentose phosphate pathway (PPP) and de novo serine synthesis which connects glycolysis to nucleic acid synthesis as well as one carbon metabolism (blue/blue arrow). The synthesis of serine and glycine can also branch into other pathways such as production of cystathionine, which will make cysteine, and glycine is a substrate for heme, glutathione, and purines. Glycine can also be degraded using the glycine cleavage system (GCS) to produce carbon units. An additional product of this pathway is alpha-ketoglutarate (a-KG) which can feed into the citric acid cycle. (*) Represent metabolites that show preferential accumulation in tumors by positron emission tomography scan.
Methionine is not only a structural amino acid, but it is required for the initiation of translation of most proteins. It is also the precursor for S-adenosylmethionine (SAM), the methyl donor for numerous enzymatic methylation reactions of an array of metabolites as well as RNA, DNA and histone proteins. The methylation of selected histone proteins, as well as cytosine bases in DNA, establishes the epigenetic landscape of both normal and cancer cells. Epigenetic patterns determine which genes are available for transcription, providing a pathway by which metabolic disturbances could result in epigenetic perturbations. For example, depleting methionine can completely alter the gene expression patterns via epigenetic remodeling of chromatin due to S-adenosyl-methionine depletion [8].
The underlying metabolic defects of cancer cells often require them to be addicted to select nutrients. Understanding these metabolic aberrations has and could lead to new and targeted chemotherapy approaches [9]. Observations of perturbed metabolism have already made possible the development of Fluorodeoxyglucose positron-emission-tomography (FdG-PET) scanning [1]. Since the discovery of preferential glucose uptake in cancer, there have been an increasing number of other molecules discovered that also drive tumor growth and function including, glutamine, methionine, serine, and glycine [1,6,10].
Worldwide, the use of 11C methionine has been shown to have a high diagnostic performance in detecting human glioma [11]. Additionally, there is evidence that glutamine uptake is preferential in gliomas as well [10,12]. Glutamine is rapidly taken up and converted to glutamate and ultimately alpha-ketoglutarate which feeds into the tricarboxylic acid cycle. Interestingly, the SSP has been shown to produce as much as 50% of the intracellular alpha-ketoglutarate [5]. This suggests a feature of this pathway is the production of TCA intermediates for a yet unknown purpose. Nonetheless the demand for these metabolites and their cellular production are intimately linked to this pathway.
The approach presented here is to study the SSP by culturing human cancer cells with stable-isotope enriched glucose and demonstrate gas chromatography-mass spectrometry can quantitatively measure the flux of carbon from glucose into serine, glycine, and methionine. Selective inhibitors of critical enzymes in this pathway including PHDGH and mitochondrial SHMT2 are currently of high interest as cancer chemotherapy agents. We demonstrate that the efficacy of selective inhibitors of PHDGH and SHMT2 can be measured with the approach presented here.
While numerous studies have examined the flux of carbon from glucose using mass spectrometry methods, this is the first to specifically examine incorporation into one carbon metabolism, specifically methionine. Due to the essential role of methionine and one carbon metabolism in establishing the epigenetic landscape and synthesis of nucleic acids, the approach presented here should prove valuable in understanding how metabolic changes can result in epigenetic reprogramming and DNA replication.
Materials and methods
1.1. Chemicals and reagents
Stable isotope analogs of glucose (Gluc+13; 99% 13C6, 97-98% 1,2,3,4,5,6,6 2H7; ca#:CDLM-3813-PK) glycine (Gly+5; D5, 98%; ca#: DLM-280-PK ), serine (Ser+7; 13C3, 97-99%; D3, 97-99%; 15N, 97-99%; ca#: CDNLM-6813-0.25) and methionine (Met+3; D3, 98%; ca#: DLM-431-PK) were purchased from Cambridge Isotope Laboratories, Tewksbury, MA, USA. Dulbecco's modified eagle medium (DMEM) was purchased from Sigma-Aldrich (ca# : D5546). DMEM without serine, glycine and glucose (ca#: D9800-16) was obtained from US Biological, Salem, MA. Fetal bovine serum (Sigma, ca#: F3297). Antibiotic-antimycotic solution was used for all cell culturing (Corning CellgroTM, ca#: 30-004-CI). The anti-PHGDH antibody (Polyclonal, Thermo Scientific, ca#: PIPA524633), anti-SHMT2 antibody (Polyclonal, Thermo Scientific, ca#: PIPA532228), and anti-GAPDH antibody (Abcam, ca#: ab8245) were purchased from Abcam (Cambridge, MA, USA). Fluorescent secondary antibodies were used for western blotting (LI-COR IRDYE 800CW GT ANTI-RB 0.5MG, ca#: 92632211; LI-COR IRDYE 680RD GT ANTI-RB 0.5MG, ca#: 92668071). The PHGDH inhibitor (PHGDHi; PH-RAZ-2016-006-0 purity> 99% and soluble in DMSO) and the SHMT2 inhibitor (SHMT2i; PH-739-009N purity >99% and soluble in DMSO) were obtained from Dr. Vipin Suri from Raze Therapeutics, Cambridge, MA. For amino acid purification Amicon ultra-0.5 centrifugal filter unit with ultracel-3 membrane, MilliporeSigma, Ca# UFC500396) were used.
1.2. Cell lines and cell culture conditions
The cell lines, U251 and U87 were generously obtained from MD Anderson cancer center as previously described and A375 were obtained from ATCC [13]. The PHDGH over expressing cell line of A375 was generated as previously described [14].
DMEM media without glycine and serine containing glucose was prepared by adding 3.5g Gluc+13 to 1 L of DMEM media. Cells were grown in regular DMEM and 10% FBS and seeded into 6 well plates. Media was removed, cells were washed with PBS, and DMEM with labeled glucose (Gluc+13), no serine, no glycine, and 10% FBS was added. Cells were grown under standard culture conditions until 80-90% confluence (~3 days).
1.3. Extraction of amino acids and analysis by gas chromatography/mass spectrometry
After removal of the media, cells were rinsed with cold PBS at 4° C twice before adding 700 μL 90% methanol at 4° C to lyse the cells. The lysate containing the cell contents was placed into a 2 mL Eppendorf tube and sonicated on ice at 30 amps for 3 × 30 sec for extraction of small molecules. The cell lysate was centrifuged for 5 min at 10,000 G. The pellet was used to estimate total protein content (1 mg protein = 100 uL cells). Filtered lysates (100 μL) were placed into GC-MS vials and 20 μL of an internal standard solution was added. The standard solution contained Ser+7, Gly+5 and Met+3. at a concentration of 2×10⁻⁵M. The supernatant was filtered through a centrifugal filter to remove molecules larger than 3 kD.
Samples were evaporated under reduced pressure. Acetonitrile (20 μL) and 20 μL of a solution containing MTBSTFA plus 1% TBDMCS were added, vials were sealed and then heated at 60°C for 1 h. Three technical replicates and at least three biological replicates were prepared for each sample.
A total of 1 μL of sample was then injected into the GC-MS (Agilent 5975C GC-MSD mass spectrometer). Single-Ion-Monitoring (SIM) mass spectrometry was performed. The inclusion list of SIM contained serine isotope cluster ions at m/z 390, 394, 395, 397 (IS, Ser+7), glycine isotope cluster ions at m/z 246, 247, 248, 251 (IS, Gly+5), and methionine cluster ions at m/z 320, 321, 322, and 323 (IS, Met+3).
The instrument had the following conditions. Inlet temperature: 290 °C, Initial oven temperature: 100 (hold time: 1 min) °C, Oven Ramp: 10 °C/min to 300 °C then hold at 300 °C for additional 15 min, Total run time: 36 min. Scan method: Scan range from 50 to 600 m/z, Source temperature: 230 °C, Quad temperature: 150 °C, Solvent delay: 5 min.
1.4. Western Blotting
Relative expression of PHGDH and SHMT2 were measured by Western blot. Cell lysates containing ~30 ug of total protein per sample were electrophoresed on an SDS-PAGE gel and transferred to a nitrocellulose membrane. Membranes were first probed with either anti-PHGDH or anti-SHMT2 and then washed and a second fluorescent antibody was added. Fluorescence was measured with a LI-COR Odyssey imaging system (Lincoln, NE, USA).
1.5. Statistical Analysis
Determination of statistical significance of measurements among different treatment groups was completed using two-way ANOVA in GraphPad Prism v6 (https://www.graphpad.com/quickcalcs/pValue1/). A web based Java code based on the Sattherwaite equation was written for calculation of the degrees of freedom (DF) and t-values that were used for calculation of p values [15]. Significance is defined as a p-value less than 0.05.
Results
2.1. Gas Chromatography Mass Spectrometry Isotope Stable Labeling
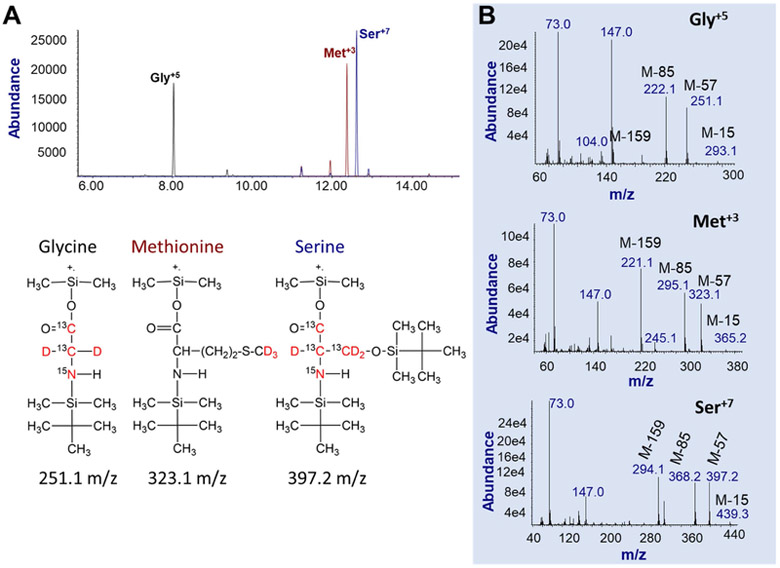
Chromatographic separation of the TBDMS derivatives of glycine, serine and methionine is shown in Fig. 2A. The structures and formulas of the isotopomers of glucose, glycine, serine and methionine as well as the mass spectra of the stable isotope enriched internal standards are also shown (Fig. 2B). These data establish the identity and purity of the enriched amino acid isotopomers used here.
Figure 2. The GC/MS ion chromatograms and mass spectra of internal standard amino acids.
A. Selective ion monitoring (SIM) using the precursor (M+.)-57 ions. Show is the total-ion-current (TIC) elution profile of internal standard stable-isotope labeled (IS) amino acids Gly+5, Met+3, and Ser+7. The chemical structures of the three IS amino acids are presented below the TIC. Red colored atoms are the stable-isotope labeled atoms.
B. The full-scan spectra of IS amino acids including Gly+5 (top panel), Met+3 (middle panel) and Ser+7 (bottom panel). While molecular ions are not present, major fragmented ions are M+.-15, M+.-57, M+.-85, and M+.-159. In this study, M+.-57 ions were used for quantification using the SIM mode.
Standard curves were constructed to establish the relationship between amount of each amino acid and the integrated area of the selected ion peak and to demonstrate that peak size and concentration are linear (Table 1). In order to determine the method’s ability to recover the measured amino acids we prepared a mixture of serine, glycine, and methionine at a defined concentration and spiked them in U87 cell lysates after the centrifugation step. This is the step where our isotope standards are also added. We followed our extraction protocol and measured the recovery rates after subtracting a blank sample where no prepared mixture was added (Table 2). Samples after derivatization were stable for at least two weeks. Repeated analyses had inter- and intra-day variation less than 10%.
Table 1.
Standard curves established for the analysis of amino acids by GC/MS
| Standard curve equation: y = fx + b | ||||
|---|---|---|---|---|
| AA | Internal Standards |
f (slope) | b (y-intercept) | r2 (regression) |
| Glycine (Gly) | Gly+7 | 0.918 | 0.00156 | 1.000 |
| Met+3 | 0.713 | +0.160 | 0.998 | |
| Ser+3 | 0.813 | +0.0925 | 1.000 | |
| Serine (Ser) | Ser+3 | 1.152 | +0.0172 | 1.000 |
| Met+3 | 1.309 | +0.0107 | 1.000 | |
| Methionine (Met) | Met+3 | 0.993 | −0.0037 | 1.000 |
| Ser+3 | 0.874 | +0.00250 | 1.000 | |
Table 2.
Recovery rates for quantification of AAs
| Amino Acids (femtomoles on column) |
Recovery rate (%) |
|---|---|
| Glycine | |
| 6250 | 112 ± 5.0 |
| 2000 | 110 ± 3.7 |
| 200 | 97 ± 5.9 |
| 20 | 100 ± 19.5 |
| Methionine | |
| 6250 | 105 ± 0.1 |
| 625 | 106 ± 1.5 |
| 62.5 | 85 ± 14.0 |
| Serine | |
| 6250 | 114 ± 0.3 |
| 625 | 112 ± 2.7 |
| 62.5 | 110 ± 3.4 |
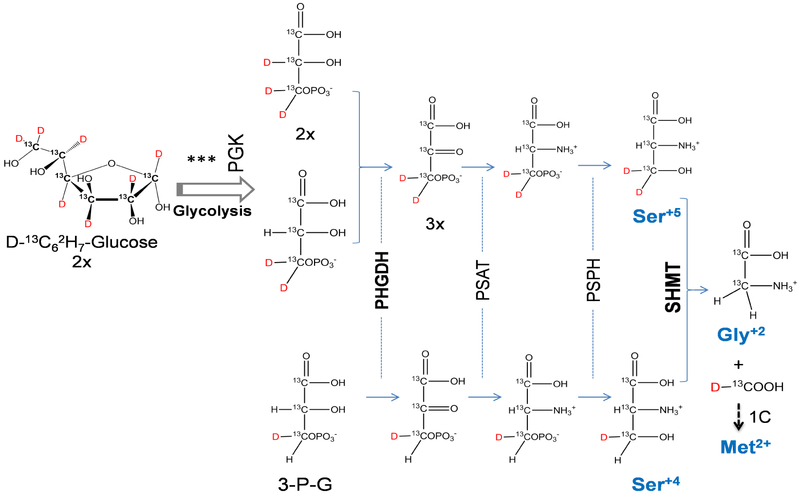
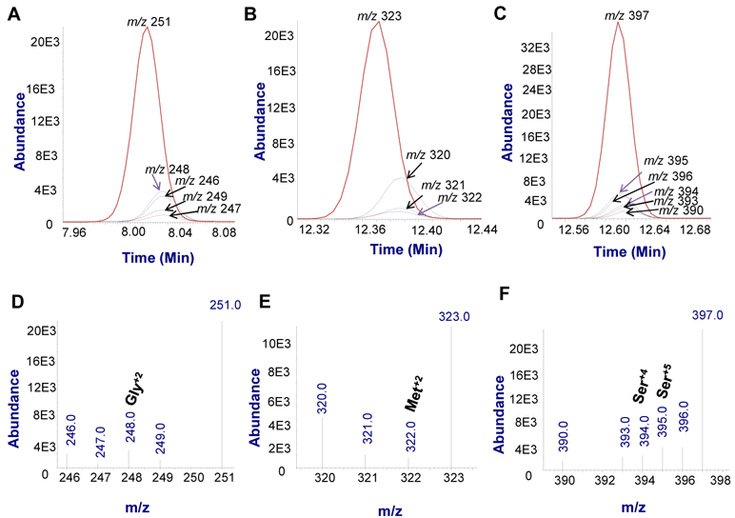
As shown in Fig. 3, Gluc+13 is converted to Ser+4/Ser+5, Gly+2, and Met+2. The measured concentrations of these amino acid isotopomers were calculated based on their relative peak size compared to the internal isotope standard, after correcting for the natural isotopic envelope (Fig. 4, Supplemental_calculations.xlsx).
Figure 3. Scheme for isotope tracking of glucose into serine, glycine, and methionine.
3-phosphoglycerate (3-PG), formed at sixth step of glycolysis, by phosphoglycerate kinase (PGK) can be converted into phosphohydroxypyruvate by phosphoglycerate dehydrogenase (PHGDH) and through successive steps into serine. Serine is then converted by serine hydroxymethyltransferase 2 (SHMT2) into glycine. The carbon unit is incorporated into the folate cycle which transfers the carbon unit to homocysteine to generate methionine. The asymmetric hydrolysis of glucose causes two isotopomers of serine, Ser+4 and Ser+5. Decarboxylation of serine by SHMT results in a single isotopomer of glycine, Gly+2. The carbon unit from serine has two deuterium and a 13C; however, it is oxidized to formate causing a loss of a deuterium before incorporation into the folate cycle and ultimately generates Met+2.
Figure 4. Representative Expanded SIM ion chromatograms and mass spectra of amino acids in A375+PHGDH cells.
A. SIM ion chromatogram of glycine;
B. SIM ion chromatogram of methionine;
C. SIM ion chromatogram of serine;
D. SIM mass spectrum of glycine;
E. SIM mass spectrum of methionine;
F. SIM mass spectrum of serine.
The SIM of an amino acid (Gly, Met or Ser) includes the ions corresponding to the isotope standard, glucose-derived labeled amino acid, unlabeled media amino acids.
2.2. Comparing cell lines with differential PHGDH expression
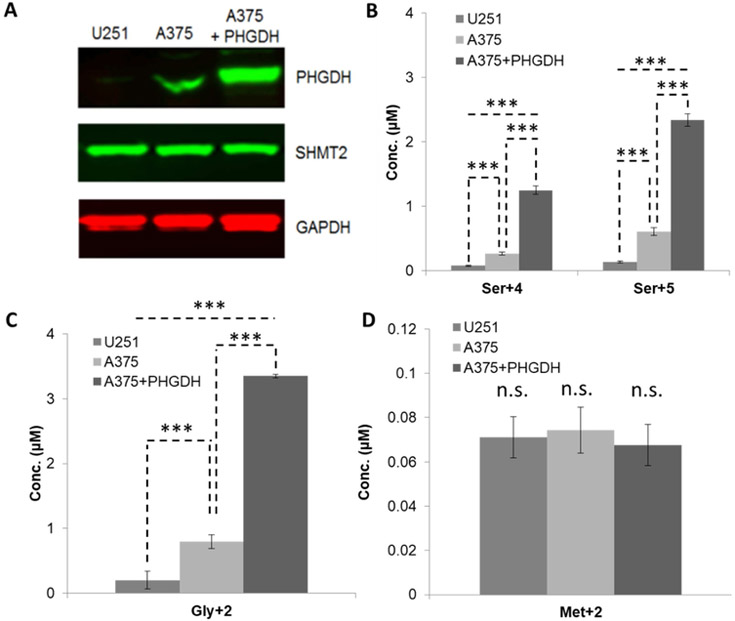
To test the argument that PHGDH is the rate-limiting enzyme into de novo serine synthesis, three cell lines were chosen with varying levels of PHGDH expression. U251 had the least PHGDH expression while the cell line, A375, and a A375 cell line that overexpresses PHGDH had progressively increasing amounts. The derived cell line, A375+PHGDH, expressed PHGDH at approximately 4 times the level of the parent cell line (Fig. 5A). While PHGDH expression varied, SHMT2 levels appeared to be equal across cell lines.
Figure 5. Measurement of glucose-derived amino acids in cancer cells that differentially express PHGDH.
A. Western-blot analysis of PHGDH and SHMT2 in U251, A375 and A375 overexpressing PHGDH (A375+PHGDH) cells; loading controls were GAPDH;
B. Concentrations of Ser+4 and Ser+5 in the cells measured by GC-MS;
C. Concentrations of Gly+2 in the cells measured by GC-MS;
D. Concentrations of Met+2 in the cells measured by GC-MS.
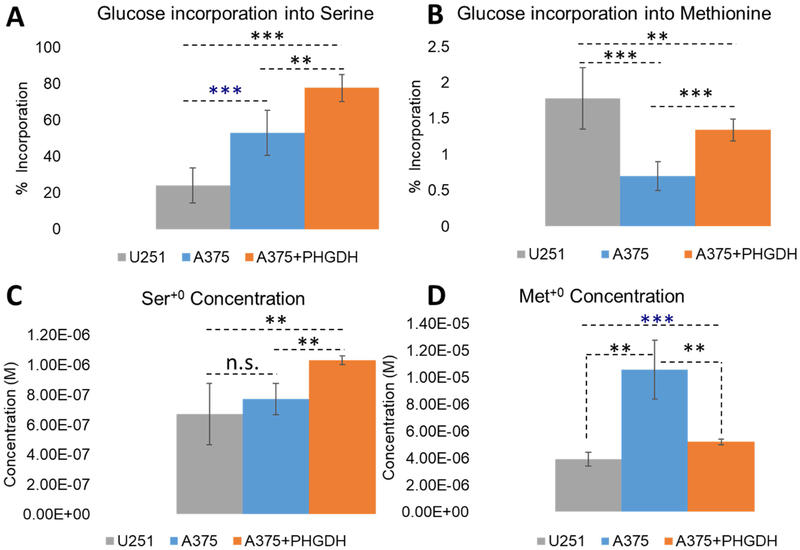
Flux through the pathway was consistent with protein expression by western blots as the contribution of glucose-derived serine increased with PHGDH expression (Fig. 6A). Interestingly, Ser+0 was also positively correlated which suggests this pathway makes use of both sources of serine for production of one-carbon units (Fig 6C). Unlabeled serine and glycine come from the 10% FBS that was added as per standard cell culture conditions of cancer cells. However, DMEM was prepared without serine and glycine. Concentrations of serine and glycine are expected to be ~30uM and ~60uM, respectively [16].
Figure 6. Measuring serine and methionine intracellular pools in three different cell lines and the fraction produced from de novo synthesis from glycolytic precursors.
P-values are reported as: * = p < 0.05, ** = p < 0.01, *** = p < 0.0001, relative to the control sample with no inhibitor. Otherwise the P-values were found to be not significant and are labeled n.s.
Although isotopically labeled serine and glycine levels correlated with PHGDH expression, Met+2 levels remained unchanged across all cell lines and absolute Met+2 concentration is ~50-fold lower than either Ser+4/Ser+5 or Gly+2 levels (Fig 5 B,C,D). Further, relative to the total intracellular concentration of methionine, this pathway contributed only 1-2% of the total intracellular methionine pool (Fig. 6B). However, typical cell culture conditions contain 200uM methionine. It was then somewhat surprising to have discovered that intracellular methionine concentrations were found to be significantly lower than that of DMEM, 4-10uM depending on the cell line (Fig. 6D).
2.3. A375 PHGDH Overexpressing cell line treated with PHGDH and SHMT2 inhibitors
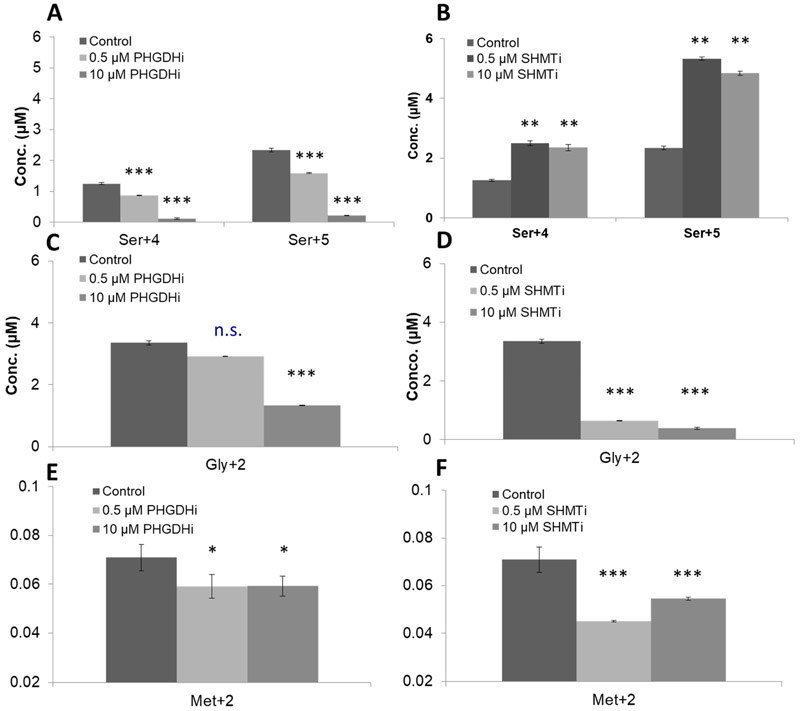
Experiments were then repeated with an inhibitor of PHGDH (PHGDHi) and SHMT2 (SHMT2i). Results are shown in Fig. 7 A-F. As anticipated, inhibition of PHGDH resulted in a concentration-dependent decrease in the conversion of Gluc+13 to labeled serine, glycine, and methionine while inhibition of SHMT2 also decreased glycine and methionine but expectedly increased the serine concentration.
Figure 7. Measurement of glucose-derived amino acids in cancer cells treated with PHGDH or SHMT2 inhibitors.
A-C. Concentrations of Ser+4/Ser+5, Gly+2, and Met+2 measured by GC/MS in the A375+PHGDH cells treated with PHGDH inhibitors at two doses, 0.5 μM and 10 μM;
D-F. Concentrations of Ser+4/Ser+5, Gly+2, and Met+2 measured by GC/MS in the A375+PHGDH cells treated with SHMT2 inhibitors at two doses, 0.5 μM and 10 μM.
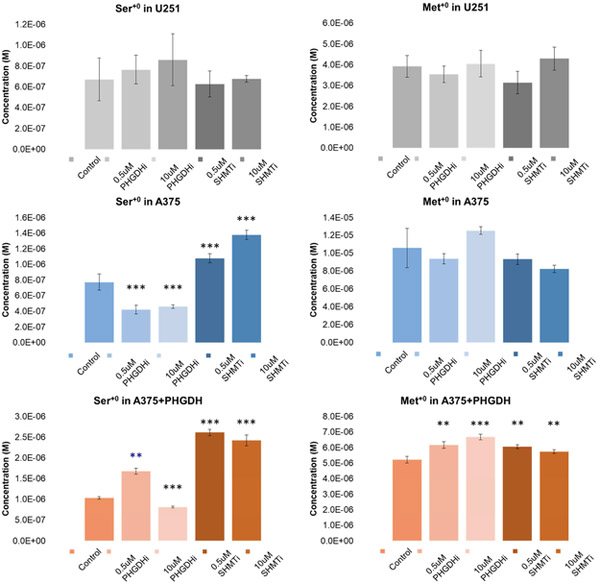
We also wanted to see how the effects of these inhibitors would affect the unlabeled amino acid pool as this presumably represents flux of amino acids into the cell. For U251 cells treated with varying concentrations of either PHGDHi or SHMT2i, neither Ser+0 nor Met+0 levels appeared to have changed (Fig. 8). In contrast, Ser+0 levels decreased in A375 cells with PHGDHi but increased with SHMT2i which is consistent with the trend seen in labeled serine. However, Met+0 levels did not change despite Met+2 levels having been decreased with either inhibitor. In A375 PHGDH overexpressing cells, Ser+0 levels increased with 0.5uM PHGDH inhibitor but then decreased at 10uM inhibitor relative to cells not treated with any drug. Otherwise, trends in A375+PHGDH were the same as seen in A375. The results here suggest that the different inhibitors may have cell-type dependent effects on amino acid flux into cells.
Figure 8. Unlabeled serine and methionine pools in three different cell lines and the effects of PHGDH and SHMT2 inhibitors.
P-values are reported as: * = p < 0.05, ** = p < 0.01, *** = p < 0.0001, relative to the control sample with no inhibitor. Otherwise the P-values were found to be not significant.
Discussion
We present here a method to monitor the de novo synthesis of serine, glycine, and methionine in human cancer cell lines as well as unlabeled intracellular amino acid pools. The metabolites are efficiently extracted from cultured cells, and they are easily separated and unambiguously identified and quantified by GC-MS. Good extraction is reproducibility obtained, and reliable quantitation is made when using isotope-enriched internal standards. This method allows for monitoring how this pathway may be altered by growth conditions and as well as to test the selectivity and efficacy of potential chemotherapy drugs targeted at PHGDH, SHMT2, or other enzymes in this pathway.
3.1. De novo serine pathway used to make intermediates for nucleic acid synthesis rather than produce methionine
The rate-limiting step in the synthesis of serine, glycine, and methionine is the conversion of 3-phosphoglycerate to 3-phosphohydroxypyruvate by PHGDH. We show that production of these amino acids in U251 cell line is minimal due to low endogenous levels of PHGDH, while over-expression of PHGDH in the PHGDH overexpressing A375 cell line provides the greatest conversion to Ser+4/Ser+5. All three cell lines had measurable SHMT2 protein, and all generated similar amounts of Met+2. We note that levels of Met+2 are substantially lower than levels of either Gly+2 or Ser+4/Ser+5, ~50-fold.
This result can likely be attributed to alternative fates of methylated folate analogs in that once a labelled methyl group is transferred to tetrahydrofolate, it can transfer to thymidylate or two positions of the purine ring, in competition to synthesis of methionine. Because Met+2 is only 1-2% of total intracellular methionine and levels are much lower than the other labeled amino acids, we believe the predominance of these carbon units are being incorporated into nucleic acid synthesis. Our data is further supported by Snell et al. who first demonstrated that serine was directly incorporated into DNA and PHGDH activity preceded a rapid increase in cell proliferation [17]. Together these data support that extracellular serine and serine derived from glucose can be used for cell proliferation in cancer.
However, typical culture conditions with DMEM contain 200uM methionine which is at least 20-fold excess of what we measured intracellularly. While this may be the standard in the field, our measurements suggest that this is in vast excess. Further studies need to be done on optimal cell culturing conditions to better reflect in vivo conditions and how these metabolic pathways might respond. Perhaps under high methionine conditions cells can rapidly proliferate by shunting carbon units to nucleic acid synthesis while under other conditions those carbon units may instead be directed towards methionine. This may also explain why tumors may have an addiction to methionine as it may free up carbon units that would otherwise be diverted.
3.2. Behavior of amino acid pools under different inhibitors
Rapidly growing cancer cells become dependent upon de novo purine synthesis for nucleotides required for DNA and cell replication. We show as much as ~80% of intracellular serine is made using the SSP (Fig. 6A). Naturally, there is substantial interest in inhibiting glucose conversion to serine and glycine as it would effectively block purine and pyrimidine synthesis which may slow tumor growth. Our method may facilitate these efforts as we demonstrate, quantitatively, the activity of selective inhibitors of PHDGH and SHMT2 on this pathway.
Indeed, inhibitors of PHGDH and SHMT2 do affect de novo synthesis of serine and glycine. However, prior to this study a potential concern of PHGDH inhibitors may have been their theoretical limited efficacy if extracellular levels of serine were sufficiently high to effectively bypass the need for the SSP. However, our data suggests that inhibition of PHGDH in some cells decrease intracellular Ser+0, except in A375+PHGDH cells treated with 0.5uM PHGDHi. But, a limitation of our method is that we cannot rule out if Ser+0 is imported extracellularly or remaining unlabeled glucose is producing serine via the SSP and is why we may see decreased Ser+0 levels with PHGDHi. Interestingly, while Ser+0 levels fluctuate with PHGDHi and SHMT2i, Met+0 levels remain largely constant across all cell lines independent of inhibitors.
3.3. GC-MS isotope tracing study method limits
As with any isotope tracing method there is always the concern of incomplete incorporation. Cells were initially expanded with unlabeled glucose, washed, and replaced with media and 10% FBS with Gluc+13. To maximize incorporation of Gluc+13, cells were grown for three days before GC-MS measurements.
An additional known challenge with isotope tracing studies with GC-MS is the derivatization using TBDMS. The silyl groups distribute the original metabolites natural isotopic envelope over a greater range and thus can complicate quantitation on lower resolution instruments. However, others have previously shown that this is nonetheless a reliable method of quantitation as the natural isotopic envelope can be subtracted from the observed spectra [18] (example_calculations.xlsx).
3.4. Conclusion
We have demonstrated that the GC-MS method described herein is capable of quantifying amino acids produced from glucose metabolism through the de novo serine and one-carbon metabolic pathways. The method is straightforward without laborious sample preparation and, is highly sensitive and reproducible. This method can be applied to measure the selectivity and sensitivity of inhibitors of selected pathways in cancer cells. This approach can also be used to study how changes in nutrients, oxygen, and enzymatic activities in the tumor microenvironment can alter the flow through the pathways discussed. For example, flux of methyl groups to DNA and histones thus modulating the epigenetic landscape. Future work is being conducted to measure the interplay between these pathways, cellular proliferation, and epigenetic modification.
Supplementary Material
Acknowledgements
We thank Dr. Vipin Suri in Raze Therapeutics (Cambridge, MA, USA) for providing the small molecule compounds selectively inhibiting the expression of PHDGH or SHMT1/2.
Footnotes
Publisher's Disclaimer: This is a PDF file of an unedited manuscript that has been accepted for publication. As a service to our customers we are providing this early version of the manuscript. The manuscript will undergo copyediting, typesetting, and review of the resulting proof before it is published in its final citable form. Please note that during the production process errors may be discovered which could affect the content, and all legal disclaimers that apply to the journal pertain.
References
- [1].Pavlova NN, Thompson CB, The Emerging Hallmarks of Cancer Metabolism, Cell Metab. 23 (2016) 27–47. doi: 10.1016/j.cmet.2015.12.006. [DOI] [PMC free article] [PubMed] [Google Scholar]
- [2].Pfeiffer T, Schuster S, Bonhoeffer S, Cooperation and competition in the evolution of ATP-producing pathways, Science (80-. ). 293 (2001) 1436. [DOI] [PubMed] [Google Scholar]
- [3].Epstein T, Gatenby RA, Brown JS, The Warburg effect as an adaptation of cancer cells to rapid fluctuations in energy demand, PLoS One. 12 (2017) 1–14. doi: 10.1371/journal.pone.0185085. [DOI] [PMC free article] [PubMed] [Google Scholar]
- [4].Snell K, Enzymes of serine metabolism in normal and neoplastic rat tissues, Adv. Enzyme Regul 22 (1984) 325–400. doi: 10.1016/0304-4165(85)90149-7. [DOI] [PubMed] [Google Scholar]
- [5].Possemato R, Marks KM, Shaul YD, Pacold ME, Kim D, Birsoy K, Sethumadhavan S, Woo HK, Jang HG, Jha AK, Chen WW, Barrett FG, Stransky N, Tsun ZY, Cowley GS, Barretina J, Kalaany NY, Hsu PP, Ottina K, Chan AM, Yuan B, Garraway LA, Root DE, Mino-Kenudson M, Brachtel EF, Driggers EM, Sabatini DM, Functional genomics reveal that the serine synthesis pathway is essential in breast cancer, Nature. 476 (2011) 346–350. doi: 10.1038/nature10350. [DOI] [PMC free article] [PubMed] [Google Scholar]
- [6].Ducker GS, Rabinowitz JD, One-Carbon Metabolism in Health and Disease., Cell Metab. 25 (2017) 27–42. doi: 10.1016/j.cmet.2016.08.009. [DOI] [PMC free article] [PubMed] [Google Scholar]
- [7].Ducker GS, Chen L, Morscher RJ, Ghergurovich JM, Esposito M, Teng X, Kang Y, Rabinowitz JD, Reversal of Cytosolic One-Carbon Flux Compensates for Loss of the Mitochondrial Folate Pathway, Cell Metab. 24 (2016) 640–641. doi: 10.1016/j.cmet.2016.09.011. [DOI] [PubMed] [Google Scholar]
- [8].Tang X, Keenan MM, Wu J, Lin CA, Dubois L, Thompson JW, Freedland SJ, Murphy SK, Chi JT, Comprehensive Profiling of Amino Acid Response Uncovers Unique Methionine-Deprived Response Dependent on Intact Creatine Biosynthesis, PLoS Genet. 11 (2015) 1–28. doi: 10.1371/journal.pgen.1005158. [DOI] [PMC free article] [PubMed] [Google Scholar]
- [9].Vander Heiden MG, Targeting cancer metabolism: a therapeutic window opens, Nat. Rev. Drug Discov 10 (2011) 671–684. doi: 10.1038/nrd3504. [DOI] [PubMed] [Google Scholar]
- [10].Zhu L, Ploessl K, Zhou R, Mankoff D, Kung HF, Metabolic Imaging of Glutamine in Cancer, J. Nucl. Med 58 (2017) 533–537. doi: 10.2967/jnumed.116.182345. [DOI] [PMC free article] [PubMed] [Google Scholar]
- [11].Xu W, Gao L, Shao A, Zheng J, Zhang J, The performance of 11C-Methionine PET in the differential diagnosis of glioma recurrence, Oncotarget. 8 (2017) 91030–91039. doi : 10.18632/oncotarget.19024. [DOI] [PMC free article] [PubMed] [Google Scholar]
- [12].Venneti S, Dunphy MP, Zhang H, Pitter KL, Campos C, Carlin SD, La Rocca G, Lyashchenko S, Rohle D, Omuro AM, Cross JR, Brennan CW, Weber WA, Holland EC, Mellinghoff IK, Kung HF, Jason S, Glutamine-based PET imaging facilitates enhanced metabolic evaluation of gliomas in vivo, 7 (2015). doi: 10.1126/scitranslmed.aaa1009.Glutamine-based. [DOI] [PMC free article] [PubMed] [Google Scholar]
- [13].Zhang K, Xu P, Sowers JL, Machuca DF, Mirfattah B, Herring J, Tang H, Chen Y, Tian B, Brasier AR, Sowers LC, Proteome Analysis of Hypoxic Glioblastoma Cells Reveals Sequential Metabolic Adaptation of One-Carbon Metabolic Pathways, Mol. Cell. Proteomics 16 (2017) 1906–1921. doi: 10.1074/mcp.RA117.000154. [DOI] [PMC free article] [PubMed] [Google Scholar]
- [14].Ou Y, Wang S-J, Jiang L, Zheng B, Gu W, p53 Protein-mediated regulation of phosphoglycerate dehydrogenase (PHGDH) is crucial for the apoptotic response upon serine starvation., J. Biol. Chem. 290 (2015) 457–66. doi: 10.1074/jbc.M114.616359. [DOI] [PMC free article] [PubMed] [Google Scholar]
- [15].Zhang K, Schrag M, Crofton A, Trivedi R, Vinters H, Kirsch W, Targeted proteomics for quantification of histone acetylation in Alzheimer’s disease, Proteomics. 12 (2012) 1261–1268. doi: 10.1002/pmic.201200010. [DOI] [PMC free article] [PubMed] [Google Scholar]
- [16].Baetz AL, Hubbert WT, Graham CK, Developmental changes of free amino acids in bovine fetal fluids with gestational age and the interrelationships between the amino acid concentrations in the fluid compartments., J. Reprod. Fertil. 44 (1975) 437–77. http://www.ncbi.nlm.nih.gov/pubmed/1181412 (accessed August 26, 2018). [DOI] [PubMed] [Google Scholar]
- [17].Snell K, Natsumeda Y, Weber G, The modulation of serine metabolism in hepatoma 3924A during different phases of cellular proliferation in culture, Biochem. J 245 (1987) 609–612. doi: 10.1042/bj2450609. [DOI] [PMC free article] [PubMed] [Google Scholar]
- [18].Herring JL, Rogstad DK, Sowers LC, Enzymatic Methylation of DNA in Cultured Human Cells Studied by Stable Isotope Incorporation and Mass Spectrometry, Chem Res Toxicol. 22 (2009) 1060–1068. doi: 10.1021/nn300902w. Release. [DOI] [PMC free article] [PubMed] [Google Scholar]
Associated Data
This section collects any data citations, data availability statements, or supplementary materials included in this article.


