

SUMMARY
The liver can substantially regenerate after injury, with both main epithelial cell types, hepatocytes and biliary epithelial cells (BECs), playing important roles in parenchymal regeneration. Beyond metabolic functions, BECs exhibit substantial plasticity and in some contexts can drive hepatic repopulation. Here we performed single-cell RNA sequencing to examine BEC and hepatocyte heterogeneity during homeostasis and after injury. Instead of evidence for a transcriptionally-defined progenitor-like BEC cell, we found significant homeostatic BEC heterogeneity that reflects fluctuating activation of a YAP-dependent program. This transcriptional signature defines a dynamic cellular state during homeostasis and is highly responsive to injury. YAP signaling is induced by physiological bile acids (BA), is required for BEC survival in response to BA exposure, and is necessary for hepatocyte reprogramming into biliary progenitors upon injury. Together, these findings uncover molecular heterogeneity within the ductal epithelium and reveal YAP as a protective rheostat and regenerative regulator in the mammalian liver.
eTOC
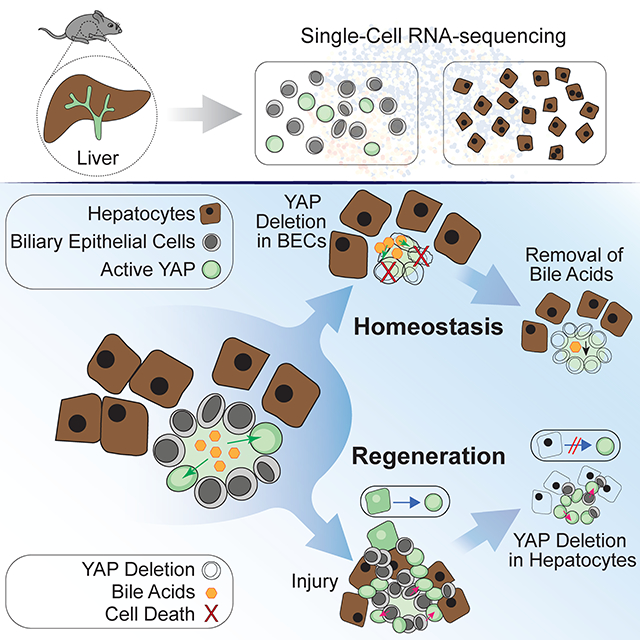
The transcriptional landscape of the epithelium in healthy and regenerating murine livers was investigated, revealing a dynamically fluctuating and heterogeneous YAP transcriptional program. Further analysis uncovered YAP signaling dualism: It is essential in biliary epithelial cells for homeostatic maintenance and in hepatocytes for the regenerative response to injury.
Graphical Abstract
INTRODUCTION
The liver is an indispensable organ with compartmentalized metabolic function and significant regenerative capabilities. While the two main epithelial cell types within the liver, hepatocytes and biliary epithelial cells (BECs), play a vital role in both of these processes, recent work has illuminated a more prominent functional role for BECs. Indeed, while BECs are essential for the modification and transport of toxic canalicular bile(Jones et al., 2015; Tabibian et al., 2013), they also exhibit remarkable plasticity and can even serve as the major cell source for regenerative cellular expansion after damage (Jörs et al., 2015; Rodrigo-Torres et al., 2014; Schaub et al., 2014; Yanger et al., 2014). Furthermore, recent lineage tracing studies have shown that BECs can act as facultative liver stem cells to repopulate the liver parenchyma in fulminant or chronic liver injury(Deng et al., 2018; Huch et al., 2015; Lu et al., 2015; Raven et al., 2017).
Despite the emerging significance of BECs as liver progenitor cells, debate remains as to whether all BECs have regenerative capacity. Studying BEC heterogeneity has proven arduous, due to low cell abundance and difficulties with their isolation and purification. As a result, understanding has remained cursory with subset evaluations restricted to isolation techniques that account for differences in cell size(Kanno et al., 2000) or by a priori choices of variably expressed biliary markers, such as ST14 or CD133(Bin Li et al., 2017; Kamimoto et al., 2016; Kanno et al., 2000; Lu et al., 2015; Okabe et al., 2009). Despite these advances, a detailed and unbiased approach to understanding heterogeneity of the liver epithelium, in homeostasis and upon regeneration, has yet to be realized.
Here, we utilize high-throughput single-cell RNA-sequencing (scRNA-seq) to uncover and dissect the transcriptional heterogeneity of adult homeostatic and injured hepatocytes and BECs. Upon combination, our data uncover a YAP transcriptional module driving dynamic heterogeneity in BECs. Additional lineage-tracing and hepatocyte- and BEC-specific Yap knockout (KO) mouse models further reveal that YAP in the liver epithelium is an essential transcriptional rheostat, regulating the dynamic and regenerative response to environmental stimuli.
RESULTS
ScRNA-seq Analysis Reveals Transcriptional Heterogeneity in the Biliary Epithelium
To probe heterogeneity in an unbiased manner, intrahepatic BECs from adult mice were isolated and purified by fluorescence-activated cell sorting (FACS) using EpCAM, a well-established marker for BECs(Lu et al., 2015), and processed by inDrop(Klein et al., 2015) for scRNA-seq (Figure 1A, Figure S1A). A total of 2,344 BECs from three independent adult mice were analyzed and showed strong transcriptomic overlap by t-distributed stochastic neighbor embedding (t-SNE), as well as similar transcript and gene counts per cell (Figure 1B, Figure S1B–C). Notably, while the common BEC markers Sox9 and Epcam were uniformly highly-expressed, several other well-known biliary markers, such as Krt19, and Hnf1ß, showed variable or low expression levels (Figure 1C, Figure S1D), supporting previously observed differences in labeling or recombination efficiency (Yanger et al., 2013). Previously proposed progenitor markers, such as Prom1(Lu et al., 2015), St14(Bin Li et al., 2017), or Foxj1(Dorrell et al., 2011), did not typify any subpopulation in our clustering analysis (Figure S1E), nor did they show a unique set of shared genes by correlation analysis. While positive correlations with receptor/transporter genes commonly known to associate with larger, distal BECs, such as Cftr and Sctr (SR), revealed other interesting transporters, these did not define a unique BEC subset in the scRNA-seq analysis and therefore further evaluation was not pursued (Figure S1F, Table S1). Finally, analysis identified a small subpopulation of cells (N=5), expressing Dmbt1 and Ly6d, suggestive for extrahepatic BECs(De Lisle et al., 1997). Immunofluorescence (IF) stains confirmed these genes to be exclusively expressed extrahepatically (Figure S1G–H, Table S2).
Figure 1. ScRNA-Seq Analysis Reveals Genes Associated With YAP Activity Define Heterogeneity in Adult Homeostatic BECs.

(A) Schematic illustrating the isolation procedure for single BECs.
(B) t-SNE plot of the scRNA-seq data of 2,344 adult BECs (n = 3 mice, indicated with different colors).
(C) Relative expression of biliary marker Sox9 and the YAP targets Cyr61, Ankrd1, and Gadd45b, as represented by t-SNE. Colors denote relative expression of respective gene in each cell (log2). Circles outline cells identified as subset A in panel (D).
(D) Heatmap with cells ordered along the x-axis (left to right) according to their y-axis position (bottom to top) in the t-SNE, and genes on the y-axis were hierarchically clustered by their z-scores (with maximum value set to 3). Right: The genes identified from clusters 1, 2, and 5 from the left heat-map. A selection of YAP targets is highlighted in red and AP-1 related genes in blue. Dashed lines separate population of interest (population A) from other BECs (population B).
(E) GSEA plot of significant differentially-expressed genes between populations A and B in comparison to a gene list from YAP overexpression in the liver, indicating enrichment in YAP targets for population A.
(F) GO analysis of differentially-expressed genes between populations A and B using EnrichR, listing terms identified, with bars indicating level of significance.
See also Figure S1.
While the isolated BECs maintain a generally congruous transcriptional landscape, an unsupervised clustering analysis with RaceID3 revealed that heterogeneity was primarily defined by a set of genes including Cyr61, Ankrd1, and Gadd45b (Figure 1C). Hierarchical clustering of the filtered 286 genes, based on z-scored expression revealed two cell groupings separated across t-SNE2 (y-axis): subset A (26% of the cells), which express these genes, as opposed to subset B (Figure 1D). Upon examination of the full list of differentially expressed genes between the two populations (Table S3), we recognized many bona fide targets of the central downstream transducer of the Hippo signaling pathway, YAP(Galli et al., 2015; Stein et al., 2015). Performing a Gene Set Enrichment Analysis of our gene list over a well-established active-YAP signature(Dong et al., 2007), we confirmed that these differentially expressed genes were indeed significantly enriched for YAP targets (Figure 1E). Identification of YAP-peaks at, or within the vicinity of, promoters of Cyr61, Klf6, Ankrd1, and Gadd45b in previously acquired chromatin immunoprecipitation sequencing (ChIP-seq) data from human biliary cells(Galli et al., 2015) further suggests these genes are direct targets of YAP (Figure S2A). Gene ontology (GO) analysis revealed other enriched GO terms, such as MAPK signaling, transcription factor AP-1 complex, and mechanical stimulus/cell adhesion (Figure 1F) which have been associated with active YAP signaling(Dubois et al., 2016; Reddy and Irvine, 2013; Yang et al., 2016; Zanconato et al., 2015). Taken together, we find that BEC transcriptional heterogeneity in homeostasis is defined by a YAP target gene signature. Previously, YAP has been shown to be critical for BEC maturation during embryonic development(Zhang et al., 2010) and can lead to expansion of ductal-like cells(Benhamouche et al., 2010; Lee et al., 2010; Lu et al., 2010). Yet, while there is evidence that supports a role for YAP in establishing biliary fate, the role of YAP in ductal heterogeneity, and its overall function in adult BECs has not been previously defined.
YAP Transcriptional Activity Distinguishes BEC Heterogeneity and is Dynamic
To validate heterogeneous YAP activity in vivo, we utilized IF as well as RNA single molecule in situ hybridization (RNA-ISH) for Cyr61, Klf6 and Hes1, another gene identified by our scRNA-seq analysis (Figure S1I). Our data demonstrate a range of expression of these genes within individual ducts, including BECs that display an absence of such transcripts (Figure 2A). Significant correlation of gene expression, observed in the scRNA-seq, was confirmed between Cyr61 and Klf6 or Hes1 (Figure 2B). Similarly, IF for JUNB protein and phosphorylated ERK (pERK), a surrogate for active MAPK signaling, highlighted clear intra-ductal molecular heterogeneity and small groupings of cells (2–3 cells) with positive signal (Figure 2C). Using a knock-in BAC-transgenic YAP-reporter mouse, which expresses eGFP under the control of the Cyr61 regulatory sequences (Cyr61eGFP), we further demonstrated heterogeneous expression in situ and by FACS (Figure 2D–F). We confirmed that this Cyr61eGFP reporter mouse is responsive to YAP activity in vivo (Figure S2B–C).
Figure 2. YAP Activity Defines BEC Heterogeneity In Vivo and Reflects a Dynamic Cell State In Vitro.

(A) Cyr61-Klf6 and Cyr61-Hes1 RNA-ISH combined with IF stain for pan-Cytokeratin (pCK) of mouse liver sections. Arrows indicate BECs co-expressing Cyr61 and Klf6 RNA, and arrowheads RNA-negative molecules.
(B) Bubble plots depicting the correlation of co-localized Cyr61-Klf6 and Cyr61-Hes1RNA molecules per BEC. Size of bubble corresponds to the respective co-expression frequency with inset showing size of bubble corresponding to % of cells with indicated frequency (n = 4 mice, BECs from 5 portal fields each, Spearman correlation).
(C) IF for pERK and JUNB (arrows) demonstrate heterogeneity within murine Cytokeratin19+ (KRT19+) BECs.
(D) Schematic for the Cyr61eGFP transgenic allele which expresses eGFP under the Cyr61 promoter and is used as a reporter for YAP transcriptional activity.
(E) Representative FACS analysis of GFP expression in BECs of a wildtype (WT) and a Cyr61eGFP mouse, where typically between 3–11% GFP+ BECs are seen.
(F) IF for GFP/KRT19 demonstrating clear intraductal heterogeneity of expression in the liver of a Cyr61eGFP-reporter mice. Arrows designate GFP+ cells.
(G) FACs analysis of freshly isolated GFP− BECs sorted from Cyr61eGFP mice, used for in vitro organoid growth assay. Bar plot depicts % of GFP+ cells over time, from 5000 initially seeded GFP− cells, showing that >90% of cultured BECs start expressing GFP within 6 days. (Mean ± SD, n = 3 mice, each in triplicate, ANOVA, followed by Tukey multiple comparisons test).
Dashed lines generally outline biliary structures.
See also Figure S2.
We next assessed potential functional differences between these cells, similarly to previous studies(Bin Li et al., 2017; Lu et al., 2015), based on whether cells with higher levels of Cyr61 expression would have higher primary biliary organoid forming capacities, a surrogate for stemness(Huch et al., 2015). Cyr61eGFP+ BECs showed a minimal enrichment in their propensity to form colonies in vitro in comparison to GFP− BECs (Figure S2D–E) suggesting that YAP transcriptional activity is not a major determinant of organoid forming capacity. Interestingly, imaging and FACS analysis of sorted GFP− BECs cultured as organoids revealed dramatic upregulation of GFP expression in culture over time (Figure 2G, Figure S2F). This suggests that the YAP-driven gene signature can be induced in previously YAP-naïve cells, likely for survival in these culture conditions. Taken together, these data imply that the identified biliary YAP gene signature reflects a dynamic cell state, as opposed to a specialized cell type.
ScRNA-seq of Regenerating BECs Reveals a Broadened YAP Transcriptional Response and the Compartmentalized Emergence of a Wnt-Associated Signaling Module
To address the heterogeneity of transcriptional changes in response to chronic injury in vivo, we next performed scRNA-seq of BECs from mice which had been administered, for 1 week, a diet supplemented with 0.1% 3,5-diethoxycarbonyl-1,4-dihydrocollidine (DDC)(Kaneko et al., 2015). As expected, DDC injury resulted in increased biliary proliferation as determined by IF for PCNA (Figure S3A). Upon scRNA-seq analysis, 1,268 BECs from a DDC-treated mouse occupied a separate transcriptional space in the t-SNE compared to control BECs (Figure S3B–C). This could be well explained by expression changes in a variety of typically upregulated genes, such as Cxcl2 and Tacstd2(Rodrigo-Torres et al., 2014)(Figure S3C, Table S4).
Intriguingly, we also determined that the number of YAP-active BECs increased upon DDC administration but no longer occupied a separate spatial location by t-SNE (Figure 3A–B). IF for GFP and pERK, FACS analysis of Cyr61eGFP mice, and RNA-ISH for Cyr61 and Klf6 all confirmed increased YAP activity in BECs upon DDC injury (Figure 3C–E). Furthermore, the same changes were also observed in bile duct ligated mice (Figure 3F). These data demonstrate that BECs utilize a YAP transcriptional program to dynamically respond to chronic liver injury in vivo. The upregulation of this transcriptional program likely reflects naïve BECs undergoing a change of state as opposed to the expansion of a subpopulation of YAP-active cells.
Figure 3. ScRNA-Seq Analysis of DDC-Injured BECs Reveals a Broadened YAP-Signaling Response and the Emergence of a Subset of BECs Expressing a Wnt Transcriptional Module In Vivo.

(A) Illustration of the experimental design.
(B) t-SNE plot of BEC scRNA-seq data from a mouse fed DDC for 1 week. Colors denote relative expression of Sox9 (biliary marker) and the YAP-targets Cyr61, Ankrd1 and Gadd45b in each BEC (log2).
(C) Top: IF for GFP and pCK on liver sections of Cyr61eGFP mice on regular (Control) or DDC diet for 1 week. Bottom: FACS analysis for GFP on sorted BECs from Control or DDC-fed Cyr61eGFP mice.
(D) RNA-ISH for Cyr61 and Klf6 on Control and DDC-fed mice depicting an upregulation of these transcripts within the same pCK+ BECs.
(E) Top: IF for pERK/KRT19 on livers from Control and DDC-fed Cyr61eGFP mice. Bottom: Scatter-bar plot of quantified pERK+ BECs. (Mean ± SD for five portal fields with each bar representing a mouse).
(F) Representative FACS plots for sorted BECs of Cyr61eGFP mice 1 week after sham operation or bile duct ligation indicating a strong increase of GFP+ BECs upon cholestatic injury.
(G) t-SNE plots of BEC scRNA-seq data from a mouse fed DDC for 1 week. Colors denote relative expression of Spp1, Apoc1, Alb, Cd44, Wnt7a, and Wnt10a (log2). Red oval outlines subset of cells with increased expression of Wnt genes.
(H) Heatmap representing z-scores of gene expression. Cells were ordered on the x-axis (left to right) by their position in the x-axis of the t-SNE. Depicted genes (n=40) were selected based on their correlation coefficients (corr > 0.25 or corr < −0.25) with Wnt7a, Wnt7b, Cd44, Spp1, and Apoe1 and then hierarchically clustered by z-scores (maximum value 2.3).
(I) Representative IF for CD44/OPN (Spp1) on livers of mice fed DDC for 1 week. Arrows show CD44high OPNlow BECs, whereas arrowheads show CD44low OPNhigh BECs (n = 3 mice).
Dashed lines generally outline biliary structures.
See also Figure S3.
Exclusively in the DDC sample, we also identified a unique subset of BECs with abundant expression of Wnt-related genes: Wnt7a, Wnt7b, Wnt10a, and Cd44 (Figure 3G–H). These genes were previously found to be generally upregulated in injured BECs and were suggested to mark a progenitor-like state(Okabe et al., 2016). Interestingly, the cells expressing this Wnt-associated signaling module also showed an anti-correlative expression pattern with certain mature hepatocyte markers, such as Apoc1, Alb, Ttr, but also the biliary marker Spp1 (Figure 3G–H). These cells had a distinct transcriptional profile and could be identified, using CD44 as a surrogate marker, in a subset of BECs within intact luminal bile duct structures (Figure 3G–I). As we were unable to detect Lgr5- or Axin2- induction in BECs in DDC treated livers by scRNA-seq or by RNA-ISH (data not shown), the activation of these Wnt-related genes appears to be non-canonically regulated, which has been suggested previously(Okabe et al., 2016).
YAP is Essential in Hepatocytes for the Regenerative Ductular Response to Injury
To investigate if the identified YAP signature was unique in BECs, we performed scRNA-seq analysis on isolated hepatocytes from untreated (5087 cells) and DDC-injured (2596 cells) livers using Seq-Well(Gierahn et al., 2017) (Figure S3D–F). Our data confirmed previously established hepatic zonation gene differences based on spatial positioning in the hepatic lobule in control hepatocytes(Halpern et al., 2017) (Figure S3G–H). Interestingly, while we could not detect homeostatic hepatocytes expressing high levels of genes associated with active YAP, a fraction of hepatocytes was found to upregulate Cyr61 and Klf6, as well as the biliary marker Spp1, upon one week of DDC-injury, suggesting the emergence of the YAP transcriptional program in injured hepatocytes as well (Figure 4A, Figure S3I). Strikingly, RNA-ISH for Cyr61 and Klf6 showed robust co-localization and increased expression in an average of 9.23% of DDC-injured hepatocytes primarily in the periportal zone compared to controls (Figure 4B). Our results speak to the activation of YAP upon regeneration in a subset of hepatocytes. As shown previously in the literature, a population of hepatocytes can undergo reprogramming to atypical duct cells during multiple types of injury, generating cells thought to have progenitor-like capacities in a process considered to be critical for normal regenerative response(Yanger et al., 2013). To test whether upregulation of the YAP-signature in hepatocytes was important for this process, we induced ablation of YAP and concurrent expression of TdTomato (Tom) selectively in hepatocytes, using Yapfl/fl; R26LSL-TdTomato/+ mice administered with AAV8-TBG-Cre (ΔYapHEP), followed by injury (Figure 4C, Figure S3J). We found that loss of YAP specifically in hepatocytes resulted in a significant attenuation of the ductular reaction post DDC, whereas control mice typically showed increased YAP in some periportal hepatocytes (Figure 4D–F). Additionally, we observed that while lineage-traced hepatocytes can form duct-like structures under prolonged DDC injury, this response was abrogated in mice who had YAP deleted from the hepatic parenchyma (Figure 4G–H). Considering the extent of the diminished ductular reaction in ΔYapHEP mice, additional cell non-autonomous mechanisms might also be in play. Taken together, we find that activation of a YAP-driven transcriptional program is crucial for the process of liver regeneration after DDC injury and specifically for hepatocyte reprogramming towards a progenitor, biliary-like fate.
Figure 4. YAP Activity is Upregulated in a Subset of Hepatocytes and is Required for the Hepatocyte Regenerative Ductular Response to Injury.

(A) Heatmap of scRNA-seq analysis of hepatocytes isolated from mice either fed a regular (Control) or DDC diet for 1 week, each with cells ordered according to their predicted relative position from the central (left) to the portal vein (right), using landmark genes (exemplary Alb, Cyp2f2 and Cyp2e1 in blue). Colors denote relative expression for shown candidate genes (highlighted: biliary markers (green) YAP targets from BECs (black), RNA-ISH analyzed genes (red).
(B) RNA-ISH for Klf6 and Cyr61 in livers of mice fed with regular (Control) or DDC diet for 1 week (with magnified insets). Arrows and dashed lines represent YAP-active, periportal hepatocytes that co-express both Cyr61 and Klf6 RNA. Bar plot depicts mean ± SD of YAP-active hepatocytes.
(C) Schematic of study design for panels D-H.
(D) pCK and YAP immunostains of control and ΔYapHep mice.
(E) Quantification of pCK+ cells per portal field (20 per mouse analyzed, mean ± SD for each mouse (n = 4)).
(F) Representative high magnification images of YAP immunostain for portal and central vein areas highlighting clusters of YAPHigh hepatocytes (white dashed lines) exclusively periportal. Bile duct is outlined with red dashed line.
(G) IF for YAP/Tom of control and ΔYapHep DDC mice with magnifications. Presence of Tom+/KRT19+ cells (arrow) are only observed in the biliary structures (dashed lines) of control, DDC only, mice (n = 4 mice per group).
(H) IF for SOX9/Tom/ZO-1 of control and ΔYapHep DDC mice. Dashed lines outline biliary structures. Magnified insets show SOX9+ ducts with apical ZO-1 expression. Arrows indicate SOX9+/Tom+ cells within the duct, exclusively in DDC control mice.
See also Figure S3.
YAP is Required for the Maintenance of Adult Homeostatic BECs
To better understand the specific role of YAP in BECs, we utilized Yapfl/fl; Krt19CreER/+; R26LSL-TdTomato/+ (ΔYapBEC) mice, in which tamoxifen (TAM) administration induces the deletion of Yap and concurrent expression of Tom in Krt19-expressing biliary cells(Means et al., 2008). Krt19CreER/+; R26LSL-TdTomato/+ (ControlBEC) mice were used as controls (Figure 5A). Loss of Yap was observed in about 40% of BECs 3 days after TAM, which correlated with the percentage of Tom expressing cells (Figure S4A). Using Tom expression as a surrogate for Yap KO, we found a dramatic decrease of Tom+ BECs in ΔYapBEC mice over time, compared to a constant labeling percentage in ControlBEC mice (Figure 5B–C). YAP IF on ΔYapBEC mice confirmed loss of Yap KO cells, while the persistence of YAP+ BECs that were also Tom+ demonstrated the ability of YAP+ escaper BECs to survive (Figure S4B–C). Further analysis in ΔYapBEC mice compared to ControlBEC mice, 7 days after TAM, revealed that remaining YAP+ BECs in ΔYapBEC mice proliferate significantly more than control or YAP− BECs (Figure 5D).
Figure 5. YAP is Required for the Maintenance of Adult Homeostatic BECs.

(A) Schematic illustrating experimental design for TAM-inducible biliary-specific Yap KO (ΔYapBEC) and control mice and expected correlation of Tom labeling with Yap KO.
(B) IF for pCK/Tom in ΔYapBEC and control mice at indicated time points after TAM.
(C) Scatter plot of the % of pCK+ BECs that are Tom+ at indicated time points after TAM, showing Tom+ cell loss in ΔYapBEC mice over time (Mean ± SD for 15 portal fields per mouse).
(D) Left: PCNA and YAP IF on ΔYapBEC and Control mice 7 days after TAM. Right: % of PCNA+ BECs stratified according to YAP-positivity, indicating that KO escaper BECs are actively proliferating (Mean ± SD for 20 portal fields for 3 mice per group, ANOVA, followed by Tukey multiple comparisons test).
(E) Schematic illustrating pan-inducible KO of Yap (ΔYap mice).
(F) Representative serial immunostains of pCK and YAP for ΔYap and Control mice 2 weeks after starting Dox, showing efficient Yap KO and disintegration of ductal structure in ΔYap mice.
(G) Scatter plot of the number of pCK cells per portal field in ΔYap and Control mice (Mean ± SD for 6 portal fields per mouse).
(H) Immunostains for pCK of ΔYap and Control 12 weeks after starting Dox. Arrowhead indicates area of intraparenchymal necrosis. Insets depict bile duct at high magnification with arrow indicating few remaining pCK+ cells in ΔYap mice.
(I) Heatmap of top 1426 significantly 1.5-fold up- and down-regulated genes (padj < 0.1) based on RNA-seq data from FACS-sorted ΔYap and Control BECs from mice (n = 3 per group) 2 weeks after start of Dox. YAP-associated genes are highlighted in red.
(J) GO terms of differentially-expressed genes from David Bioinformatics database. Bars indicate level of significance.
(K) IF for cleaved-Caspase 3 (cCasp3) from ΔYap and Control mice 2 weeks after start of Dox. Arrow points out positive signal only observed in ΔYap mice.
(L) Quantification of cCasp3+ cells within two histological sections per mouse. (Mean ± SD, n = 4 mice per group).
Dashed lines generally outline biliary structures.
See also Figures S4 and S5.
As escaper BECs are able to compensate for Yap KO-induced BEC loss, in the ΔYapBEC mouse, we wanted to challenge the biliary epithelium by using Yapfl/fl; tetO-Cre; CAG-rtTA3 (ΔYap) mice, which allow for complete, albeit not BEC-specific, KO of Yap upon doxycycline administration (Figure 5E). In addition to the widespread loss of Yap throughout the liver, ΔYap mice showed extensive disruption of bile duct integrity and morphology with a significant decrease in the number of pCK+ cells per portal area 2 weeks after KO (Figure 5F–G). Long-term analysis 12 weeks after Yap KO, revealed dramatic bile duct paucity throughout the entire parenchyma in the ΔYap livers compared to controls, concurrent with patches of hepatic necrosis and elevated ALT and bilirubin levels (Figure 5H, Figure S4D–E). Long-term hepatocyte-specific KO of Yap did not result in appreciable changes in morphology or blood chemistry, suggesting against hepatocyte-induced phenotypic effects in the ΔYap model (Figure S4F–G). Surprisingly, while Yap deletion efficiency was robust in the entire organism, we did not observe any gross morphological difference upon KO in other solid tissues (Figure S4H). This remarkable observation suggests a unique role for YAP within BECs. Of note, we observed some intact ductal structures, including in the extrahepatic ducts and gallbladder epithelium, at 12 weeks; however, these ducts were YAP+, thus highly suggestive for reconstitution of ducts from the few escaper YAP+ BECs (Figure S4I–J). Taken together, these findings demonstrate that under homeostatic conditions, YAP is acutely and uniquely required for BEC maintenance and the integrity of the liver compared to other tissues in the body.
To identify transcriptional differences, BECs from ΔYap and control mice were FACS-sorted for bulk RNA-seq. Transcriptome analysis revealed 1,426 genes >1.5-fold differentially expressed (Figure 5I, Table S5) with a mean reduction in normalized Yap transcript counts of >90%. Interestingly, among the top enriched downregulated GO terms we could identify “MAPK signaling” and “focal adhesion”, similar to the scRNA-seq data of the YAP signature subset of BECs in homeostasis (Figure 5J and Figure 1F). As anticipated, downregulation of YAP target genes was also observed upon KO (Figure 5I, Figure S5A–C). We also observed almost complete disappearance of pERK in BECs upon Yap loss, strengthening the evidence that YAP has effects on MAPK/ERK signaling in adult BECs (Figure S5D–E). For upregulated genes upon YAP deletion, the enriched GO terms were mainly associated with inflammation and cell death. Specifically, several pro-apoptotic genes were identified (Figure 5J, Figure S5F), suggesting that the deletion of Yap in BECs may lead to cell loss through an apoptotic mechanism. Indeed, IF for cleaved Caspase-3, as well as TUNEL analysis, in intrahepatic BECs, revealed increased cell death in ΔYap compared to controls (Figure 5K–L and Figure S5G–H). To capture the act of apoptosis in a low abundant cell type, such as BECs, is particularly challenging and we posit that as Yap loss leads to downregulation of cell adhesion genes, these cells are most likely extruded quickly into the bile. In support of this hypothesis, IF for ß-Actin reveals the typical basal actin condensing in the process of extrusion(Gu et al., 2011) upon Yap KO (Figure S5I–J).
Homeostatic YAP Activity in BECs is Regulated by Bile Acids
The observation that YAP is essential in BECs, even under homeostatic conditions, is particularly remarkable given that YAP is dispensable in several adult homeostatic tissues studied so far(Barry et al., 2012; Chen et al., 2014; Zanconato et al., 2015), and as also suggested from our own initial histological assessment of the ΔYap mouse (Figure S5E). This notable requirement for YAP, along with the observations that BECs can dynamically upregulate the YAP transcriptional program, led us to the question, what might be a unique, causal property of the BEC environment that so distinctly requires YAP? BECs are constantly exposed to bile, containing high levels of hydrophobic bile acids (BA), such as deoxycholic acid (DCA), which have been shown to be important regulatory molecules and can be toxic in high concentrations (Higuchi et al., 2003). We therefore hypothesized that BA might induce cell toxicity, causing BECs to upregulate the YAP transcriptional program as a protective mechanism. Therefore, we examined the effect of chronically administering DCA-supplemented feed to Cyr61eGFP mice. This resulted in a dramatic increase in the number of BECs expressing the YAP transcriptional program (Figure 6A–F and Figure S6A–B).
Figure 6. Homeostatic YAP Activity in BECs is Regulated by BAs.

(A) Schematic of the experimental design.
(B) Bar-scatter-plot of the % of GFP+ BECs from Cyr61eGFP mice on indicated diets by FACS-analysis. Each dot represents a mouse (n = 4–5 per group).
(C) IF for GFP/pCK and pERK/KRT19 in Cyr61eGFP mice fed with the indicated diets. Dashed lines outline bile ducts.
(D) Quantification of GFP+ (top) and pERK+ (bottom) BECs in IF, depicting significant differences between groups. Each color represents an individual mouse per group (5 portal fields per animal).
(E) Dual RNA-ISH for Cyr61 and Klf6 with concurrent IF for pCK on Cyr61eGFP mice administered the indicated diets. Arrow indicates exemplary Cyr61-Klf6 co-expressing BEC.
(F) Bubble plots for the quantification of co-localized Cyr61 and Klf6 RNA molecules per cell. Size of bubble corresponds to the co-expression frequency for Cyr61 and Klf6 within each condition and is indicated as % in the inset (n = 4 mice, BECs from 5 portal fields each, Spearman correlation).
(G) Visualization of the hepatic parenchyma using dual RNA-ISH for Cyr61 and Klf6 on mice administered the indicated diets. Dashed lines outline hepatocytes with co-expression in the DCA group.
See also Figure S6.
We next aimed to determine if the endogenous activity of YAP, perceived in a subset of homeostatic BECs, was correlated to inputs from physiological concentrations of BAs. Hypothesizing that restricting physiological BA exposure would limit active YAP signaling in BECs, Cyr61eGFP mice were fed a diet containing 2% of the resin cholestyramine (resin), which is a BA sequestrant(Zhang and Klaassen, 2010), for 1 week. Remarkably, we found that limiting the physiological levels of BAs in mice led to a significant mitigation of the number of BECs expressing the YAP transcriptional program (Figure 6A–F and Figure S6A–B). We also observed a small number of hepatocytes which co-upregulated Cyr61 and Klf6 upon DCA administration, suggesting that a non-physiological increase in BAs can induce YAP activity in hepatocytes as well (Figure 6G). The gallbladder epithelium, physiologically exposed to very high levels of BAs, did not show an increased induction of YAP activity compared to intrahepatic BECs, suggesting additional protective mechanisms in these cells (Figure S6C–D). Together, our findings indicate that physiological BA exposure in intrahepatic BECs is sufficient to activate the YAP-driven transcriptional program.
BA-Induced YAP Activity is ASBT-Dependent and Dynamically Fluctuates in BECs
Our data provide evidence that during homeostasis only a subpopulation of BECs displays YAP transcriptional activity. Thus, it remains perplexing as to why YAP is required in most, if not all, BECs for survival. We considered the possibility that YAP activity would fluctuate among BECs so that, over a certain timeframe, most BECs would have traversed through a YAP activated state. This scenario would explain the observed chronic requirement for YAP in the biliary epithelium. It also would suggest that, if required, most BECs should be able to rapidly turn on YAP transcriptional activity. Indeed, following only 24h after DCA injection, Cyr61eGFP expression can be detected in up to 40% of BECs (Figure 7A). To provide further evidence for these transcriptional dynamics, we utilized a lineage tracing model to label the subset of cells that at a given time displayed YAP transcriptional activity. As Hes1 mRNA expression significantly correlated with YAP target genes in YAP-active BECs, we used Hes1CreER/+; R26LSL-TdTomato/+ reporter mice (TomHes1) (Kopinke et al., 2011) (Figure 7B). In support of our initial observations regarding the number of YAP-active BECs, we found that 5 days after TAM ~13% of BECs were labelled, similar to Cyr61eGFP stains (Figure S7A and Figure 6D). We reasoned that if the YAP-active cell state is variable between BECs over time, a higher overlap of YAP target genes and the Tom label would be observed 1 day after induction when compared to 5 days after. Indeed, RNA-ISH analyses demonstrated a clear correlation between TdTomato and Cyr61 at 1 day post TAM that was not present after 5 days (Figure 7C–D). We interpret this finding as highly supportive of the idea that quiescent BECs dynamically change their YAP activity state over time.
Figure 7. BA-Induced YAP Activity is ASBT-Dependent and Dynamically Fluctuates in BECs Under Physiological Conditions.

(A) Scatter plot of the % of GFP+ BECs per portal field in IF of Cyr61eGFP mouse livers 24h after i.p. treatment with vehicle or DCA. Each diamond represents a portal field with colors indicating an individual mouse (n = 3 per group).
(B) Schematic illustrating experimental design for TAM-inducible Tom labeling of Hes1-expressing cells with TomHes1 mice at 1d and 5d chase for panels C-D.
(C) Dual RNA-ISH for Cyr61 and TdTomato (Tom) with concurrent IF for KRT19 on TomHes1 mice, 1 and 5d after TAM. Arrows indicate Tom/Cyr61 co-expressing BECs (enriched in 1d group), arrowheads designate exclusively Tom expressing BECs.
(D) Quantification of Cyr61-RNA dots per BEC, stratified by Tom-positivity indicating a significant positive correlation only at 1d chase (n = 3 mice per group).
(E) Distribution bar plot of Cyr61-RNA ISH quantification for the indicated groups. Each bar represents a mouse. BECs are color-coded according to the number of Cyr61-RNA dots and shown as % of cumulative 10 portal fields counted. P-values were computed using the Kullback-Leibler test and indicate significant differences between each group.
(F) Experimental design.
(G) Low-magnification immunostains for pCK in ΔYap mice fed with indicated diets. Magnified insets depict portal tracts with bile ducts (red dashed lines).
(H) Quantification of pCK+ cells per portal field (Mean ± SD of 10 portal fields for the indicated mice (n = 4 per group)).
See also Figure S7.
To provide insight into, why only a subset of BECs are YAP-active at a given time, we next assessed whether the expression of genes involved in regulating BA exposure to BECs, such as Mucins or BA transporters, correlate with YAP activity. Although we evaluated several candidates by targeted amplification in our scRNAseq libraries, we could not identify any significantly correlated genes (Figure S7B–C, Table S6). We posited that the lack of transcriptional correlation might be because these genes are regulated post-transcriptionally. To further functionally assess a potential link between YAP activity and several of the main proteins in BA physiology, we decided to evaluate several candidate genes in vivo. We focused on: 1. TGR5 (also known as Gpbar1), a G-protein coupled receptor known to transmit BA-mediated signaling (Deutschmann et al., 2018); 2. IQGAP1, a scaffolding protein identified to mediate BA-induced YAP-response in hepatocytes (Anakk et al., 2013); and, 3. ASBT (also known as Slc10a2), a central apical BA transporter in BECs (Lazaridis et al., 1997). Of the three KO mouse models examined, only ASBT showed a significant reduction in the number and distribution of YAP-active BECs during homeostasis, as measured by RNA-ISH for Cyr61 (Figure 7E, Figure S7D–E). Remarkably, ASBT deficiency drastically abrogated the activation of YAP transcription in BECs following DCA challenge, as compared to controls (Figure 7E). These data provide evidence that BAs not only activate YAP signaling in BECs in a direct manner, but that, to do so, they also need to be transported intracellularly.
BA Sequestration Rescues Yap Deletion-Induced BEC Loss
As YAP activity in BECs is regulated by homeostatic levels of BA exposure, this led us to inquire if the phenotype associated with Yap KO in BECs might be due to the inability of BECs to respond to BA toxicity through YAP activation. To test this idea, we evaluated whether BA sequestration in vivo could partially abrogate the BEC-loss phenotype associated with YAP deletion. Intriguingly, we found that a resin diet almost completely rescued the Yap KO phenotype in ΔYap mice. Yap-deficient BECs in this diet retained a normal bile duct morphology and their loss was significantly suppressed (Figure 7F–H). This finding further supports the important physiological role for YAP as a vital signaling regulator to protect against cell death in BECs.
DISCUSSION
Understanding signaling dynamics and heterogeneity in the liver in homeostasis and regeneration has important implications for advancing treatment of liver disease. As an increasing focus has shifted towards understanding the role of BECs and their regenerative abilities in the liver(Deng et al., 2018; Jörs et al., 2015; Kamimoto et al., 2016; Raven et al., 2017), there has been a vibrant search to identify unique subpopulations of liver cells. Using scRNA-seq we provide the first unbiased evaluation of the transcriptional landscape of BECs in homeostasis and regeneration. Although we could distinguish rare, transcriptionally distinct, extrahepatic BECs, we were unable to identify a cluster of BECs that could define a potential long-lived stem cell population. Although a limitation of high-throughput scRNA-seq is capture efficiency and sequencing depth per cell, it would seem surprising that a potential progenitor cell would be defined only by a small number of correlated modules comprised of a few low-abundance genes that do not define a distinct cluster of cells in the t-SNE. Our work, instead, uncovers heterogeneity in the biliary epithelium defined by active YAP signaling which can be induced in response to injury or BA exposure in vivo. These results discourage the idea of a transcriptionally distinct progenitor-like cell among BECs, rather they project the hypothesis that these cells have a dynamic ability to respond to environmental cues. The emergence of a subset of BECs expressing Wnt associated genes upon chronic injury further highlights the plasticity of BECs to respond to environmental signaling inputs.
Regeneration is an essential ability of the liver, which is exposed daily to a multitude of potentially toxic xenobiotics. Several studies have revealed that liver regeneration, typically after partial hepatectomy, does not involve a single pathway, but rather engages several different signaling pathways, suggesting redundancy in signaling networks(Michalopoulos, 2010). In chronic liver injury, Yanger et al. identified Notch signaling as required for hepatocytes to biliary-progenitor-cell reprogramming(Yanger et al., 2013). Our work expands the list of crucially involved pathways, as YAP KO completely inhibits the hepatocytes’ reprogramming capacity. As we have previously demonstrated that overexpression of active YAP in hepatocytes drives reprogramming via Notch2 transcriptional regulation(Yimlamai et al., 2014), the combined evidence is suggestive that YAP-NOTCH is indeed a crucial axis for this process. Interestingly, our single-cell analysis demonstrated that only a fraction of hepatocytes induced YAP activity. Further analyses will be required to determine if these hepatocytes have a pre-determined ability to reprogram, and if hepatic paracrine factors downstream of YAP influence the ductular reaction by BECs.
In addition to the dynamic response of YAP signaling in the liver epithelium upon injury, the potent BEC loss phenotype observed upon YAP KO is particularly remarkable. Indeed, Hippo signaling had previously appeared to be essential in embryonic development and for injury response but dispensable under homeostatic conditions(Patel et al., 2017). Previous work using an Mx1Cre model, has suggested that Yap KO in the liver without injury does not result in an appreciable phenotype(Bai et al., 2012). Using two different conditional in vivo models, however, we show a vital and distinct requirement for YAP in homeostatic BECs. This finding is particularly relevant as inhibition of YAP has been proposed as a cancer therapeutic strategy(Kim and Myung, 2018; Zanconato et al., 2016). Unless appropriately addressed, hepatotoxicity may therefore become a main limitation to their future use.
Our work resonates with previous observations that YAP and associated pathways are responsive to BAs(Anakk et al., 2013; Centuori et al., 2016) but, in contrast, shows that even physiological levels of BA are sufficient for that response. Interestingly, this BA-triggered YAP activity in BECs seems to dynamically fluctuate between cells. Our short-term BA treatments, coupled with our YAP deletion and Hes1 lineage tracing data suggests that most, if not all, homeostatic BECs can, and will eventually need to induce YAP activity. Our tracing data reveal that, even at 5 days, a different set of BECs express Hes1/Cyr61, suggestive of relatively rapid fluctuation. Further studies should provide insight into the timescale of this process, whose dynamics probably explain the lack of consistent correlation between pERK levels and YAP target gene expression in single BECs. Furthermore, we have also identified that ASBT is vital for this transcriptional response, suggesting that the intracellular presence of BA is required. The heterogenic and dynamic transcriptional response in BECs is most likely influenced by a multitude of factors known to alter cellular exposure to BAs, such as the apical glycocalyx, bicarbonate secretion and the presence of exporting BA transporters which might cumulatively lower the threshold for a trigger of YAP activity in the individual cell. Additionally, an alternative explanation for the observed heterogeneity is that BECs could become refractory for a certain time to YAP activity. As oscillatory gene expression behaviors have been described in multiple contexts(Halpern et al., 2015), whether this pattern of YAP activation in BECs is random or follows a defined pattern is unclear and therefore is worth future exploration.
Our findings add to the nuance, complexity, and variability of YAP signaling depending on environmental conditions and tissue type. For the biliary epithelium, as well as for hepatocytes, this work has determined that YAP signaling is acutely positioned to drive a dynamic response to environmental cues for continued survival and to regulate regeneration. Further studies evaluating the vital properties of YAP signaling in the liver will lead to a deeper understanding about the nature of our ability to respond to this tempest of environmental toxins and signaling inputs that we encounter daily.
STAR METHODS
Contact for Reagent and Resource Sharing
Further information and requests for resources and reagents should be directed to and will be fulfilled by the Lead Contact, Fernando Camargo (fernando.camargo@childrens.harvard.edu).
Experimental Model and Subject Details
Mice
All animal protocols and procedures were approved by the respective local animal institutional committees. Mice were housed in specific pathogen-free facilities on a 12h light/dark cycle and were given food and water ad libitum. All animals used in this study were 7–12 weeks of age unless otherwise specified and were on a C57Bl/6 background, except Tgr5 KO and their controls (FVB) and Iqgap1 KO and their controls (129/SVJ); both female and male mice were used for experiments. No influence of sex was observed in any of the performed experiments. Whenever possible, littermates with negative genotypes were used as controls. Only experimentally naïve mice were used for experiments. The following mouse lines were utilized or generated:
Cyr61eGFP BAC-transgenic mice were derived from GENSAT and C57BL/6J were obtained from Jackson laboratories.
R26lox-stop-lox-rtTA/+; Col1a1Teto-YapS127A/+; Cyr61eGFP mice were generated by mating Cyr61eGFP mice with R26lox-stop-lox-rtTA/+; Col1a1Teto-YapS127A/+ mice that were previously described(Yimlamai et al., 2014).
Krt19CreER/+ mice (Jackson Laboratories) were mated with R26LSL-TdTomato/+Ai9 mice (Jackson Laboratories) and Yapfl/fl mice(Schlegelmilch et al., 2011) to obtain Yapfl/fl; Krt19CreER/+; R26LSL-TdTomato/+ (ΔYapBEC) mice and control Krt19CreER/+;R26LSL-TdTomato/+
CAG-rtTA3 (Jackson Laboratories) mice were mated with (tetO)7-Cre (Jackson Laboratories) and Yapfl/fl mice(Schlegelmilch et al., 2011) to obtain the following genotypes Yapfl/fl; tetO-Cre; CAG-rtTA3 (ΔYap) and control Yapfl/fl; tetO-Cre.
For KO of Yap in hepatocytes we generated Yapfl/fl; R26LSL-TdTomato/+ Ai9 (ΔYapHEP).
Hes1CreER/+ mice (Kopinke et al., 2011) were mated with R26LSL-TdTomato/+Ai14 mice (Jackson Laboratories) (TomHes1).
Asbt, Tgr5 and Iqgap1 KO mice have previously been described (Dawson et al., 2003; Li et al., 2000; Vassileva et al., 2006).
Mouse genotyping was performed with GoTaq Green Master Mix (Promega) using the primers listed in Table S7. For injury models, mice were given feed supplemented with 0.1% 3,5-diethoxycarbonyl-1,4-dihydroxychollidine (DDC) (Bio-Serv) as previously established(Yanger et al., 2014), for the duration specified. Bile duct ligations were performed on adult mice as described previously(Tag et al., 2015) and controlled with sham-operated mice. Gamma irradiated rodent diet supplemented with 2% cholestyramine (resin) or 0.3% deoxycholic acid (DCA) (purchased from Bio-Serv) was administered to mice as previously described(Zhang and Klaassen, 2010). For 24h BA administration, mice were injected intraperitoneally with 24,4 mg/kg of deoxycholic acid (DCA) in Ethanol (1 ml/kg) once ((Paolini et al., 2002)). To induce Cre expression in the Krt19CreER models described above, mice were administered 2 doses of 4mg tamoxifen (TAM) (Sigma-Aldrich) dissolved in corn oil intraperitoneally. TomHes1 mice were administered 1mg TAM once intraperitoneally. Doxycycline was administered to mice in drinking water at a concentration of 1mg/ml unless otherwise specified. For AAV virus administration, AAV8.TBG.PI.eGFP.WPRE.bGH (University of Pennsylvania Vector Core) and AAV8.TBG.PI.Cre.rBG (University of Pennsylvania Vector Core) were administered via retro-orbital injection at the specified dosages at a volume of 100μl. For clinical chemistry analysis, 80 μl of blood was obtained via capillary retro-orbitally and analyzed utilizing chemistry rotors for Vetscan VS2 (Abaxis).
Cell lines
L-WRN cells were used as described to generate conditioned media for organoid culture (secreting Wnt3a, R-spondin, Noggin) (Miyoshi and Stappenbeck, 2013). Cells were cultured in a humidified 5% CO2 atmosphere at 37°C.
Method Details
BEC Isolation
Optimal isolation of a single-cell suspension of biliary cells was obtained by modifying previously established, two-step liver perfusion protocols(Dorrell et al., 2008; Li et al., 2010). Mice were euthanized, the heart and liver were surgically exposed, and a cannula was immediately inserted through an incision in the right atrium into the suprahepatic vena cava inferior. Mouse livers were then perfused by a pre-warmed (37°C) perfusion buffer (50 mM EDTA, 10 mM HEPES in 1X HBSS [Gibco]) at an initial flow rate of 3 ml/min for 2.5 minutes, followed by an increase in flow rate to 4 ml/min for an additional 2.5 minutes. This was then followed by perfusion with a pre-warmed (37°C) Collagenase Type IV (150 U/mL; Invitrogen) digestion buffer solution (1.25 mM CaCl2, 4 mM MgCl2, 10 mM HEPES in 1x HBSS) for 8–10 minutes at a flow rate of 4 ml/min. For the duration of the two-step liver perfusion, the infrahepatic inferior vena cava was digitally occluded every 30 seconds for 10 seconds.
After isolating the liver and surgically removing the gallbladder, the capsule was disrupted and the liver was gently and mechanically agitated to release dissociated single cells. The remaining liver was than subjected to serial digestions in Collagenase Type IV (150 U/mL), Accutase (EMD Millipore), and trypsin (0.25%) for 30 minutes, 30 minutes, and 20 minutes, respectively, at 37°C. Dissociated cells were collected after each step and filtered through a 100 μm cell strainer, washed, and re-suspended in ice-cold resuspension buffer (2% FBS, 1.25 mM CaCl2, 4 mM MgCl2, 10mM HEPES, 5 mM glucose in 1X HBSS). The remaining procedure was at 4°C. Hepatocytes were pelleted by a 30×g spin for 5 minutes and discarded, and the remaining cells in the supernatant were spun at 300×g for 5 minutes. The pelleted cells were resuspended in 5 ml red blood cell lysis buffer (Qiagen), treated on ice for 7 mins and washed with 10 ml resuspension buffer at 300×g for 5 minutes. The cells were then re-suspended in cold resuspension buffer for further processing or analysis.
Fluorescence Activated Cell Sorting
BECs were stained by a fluorescent antibody for the positive selection biliary marker EpCAM (Biolegend, 1:100) and negatively selected for by the mesenchymal/hematopoietic lineage markers CD45 (BD Biosciences, 1:100), CD11b (BD Biosciences, 1:100), and TER-119 (Biolegend, 1:100) for 30 minutes at 4°C. After a wash with resuspension buffer at 300×g for minutes, BECs were then sorted or analyzed by FACS utilizing a BD FACSAria II, using the 100μm nozzle.
BEC Single-Cell RNA Sequencing
Isolated single BECs were encapsulated, and libraries were generated using inDrops(Zilionis et al., 2017) performed at the Single Cell Core at Harvard Medical School. Approximately 1500 cells were encapsulated for each sample. Libraries were sequenced on an Illumina NextSeq 500 sequencer using a NextSeq 500/500 High Output v2 kit, 75 cycles: 35 cycles for read 1, 6 cycles for index i7 read, and 51 cycles for read 2.
Targeted Amplification of scRNA-seq library
For targeted amplification the post-in vitro transcription back-up of the three control BEC scRNA-seq libraries were used with an adaptation of the original inDrops protocol(Zilionis et al., 2017). The samples were directly reverse transcribed according to protocol but without prior fragmentation and using random hexamers without PE2-adaptor. After clean-up with SPRI (Agencourt AMPure XP) beads at a 1.2X ratio, targeted PCR amplification was performed with 5% of the purified cDNA per each individual reaction using Kapa HiFi Hot Start Mix (KAPA Biosystems) with the respective forward primers and a general reverse primer (Table S7). After clean-up with SPRI beads at a 0.8X ratio and evaluation of amplification by gel-electrophoresis, 10 cycles of indexing PCR were performed of the pooled PCR products (15% of the purified PCR product mixed in equal volumes), according to the inDrops protocol. Libraries were sequenced on an Illumina NextSeq 500 sequencer using a NextSeq 500/550 Mid Output v2.5 kit, 150 cycles: 100 cycles for read 1, 8 cycles for indes i7 read, 8 cycles for index i5 read, and 14 cycles for read 2.
Hepatocyte Isolation
For hepatocyte isolation, a similar perfusion protocol as described for BEC isolation was used with adaptation of the digestion step, by using liver digest medium (Thermo Fisher) and increasing the digestion time to 16–20 minutes while maintaining identical flow rates. After excision of the liver, the whole procedure was performed at 4°C. The liver capsule removed, and the liver gently swirled in resuspension buffer to yield a cell suspension. After filtration through a 100 μm cell strainer, the hepatocytes were selectively pelleted by centrifugation with 30×g for 5 minutes, which removes the non-parenchymal cell fraction. The resuspended hepatocytes were then mixed 1:2.2 with 40% iodixanol (Optiprep, Axis-Shield) solution (diluted in resuspension buffer) for a volume of 4.8ml, overlayered with 3 ml 18% iodixanol and 0.5 ml resuspension buffer and spun at 500×g for 25 minutes at 4°C with reduced deceleration. The top cell layer was collected, mixed with resuspension buffer supplemented with 3% BSA and washed once at 30×g for 5 min at 4°C. The cells were then re-suspended in ice-cold resuspension buffer (containing 2% BSA and 9% Optiprep), quantified and assessed for viability by Trypan blue stain. Routinely, viability of over 98% was obtained.
Hepatocyte Single-cell RNA-Sequencing
We utilized the Seq-Well platform for massively parallel scRNA-seq to capture transcriptomes of single hepatocytes on barcoded mRNA capture beads. Full methods on implementation of this platform are available in Gierahn et al. (Gierahn et al., 2017). In brief, 20,000 cells from one in vivo hepatocyte condition were loaded onto one array containing 86,000 barcoded mRNA capture beads. The loaded arrays containing cells and beads were then sealed using a polycarbonate membrane with a pore size of 0.01 μm, which allows for exchange of buffers but retains biological molecules confined within each microwell. Subsequent exchange of buffers allows for cell lysis, transcript hybridization, and bead recovery before performing reverse transcription en masse. Following reverse transcription and exonuclease treatment to remove excess primers, PCR amplification was carried out using KAPA HiFi PCR Mastermix with 2,000 beads per 50 μL reaction volume. Six libraries (totaling 12,000 beads) were then pooled and purified using Agencourt AMPure XP beads by a 0.6X SPRI followed by a 0.7X SPRI and quantified using Qubit hsDNA Assay (Thermo Fisher). Libraries were constructed using the Nextera Tagmentation method on a total of 800 pg of pooled cDNA library from 12,000 recovered beads. Tagmented and amplified sequences were purified at a 0.6X SPRI ratio yielding library sizes with an average distribution of 650–750 base pairs in length as determined using the Agilent hsD1000 Screen Tape System (Agilent Genomics). Arrays were sequenced with an Illumina 75 Cycle NextSeq500/550 High Output v2 kit at a final concentration of 2.8 pM. The read structure was paired end with Read 1 starting from a custom read 1 primer containing 20 bases with a 12bp cell barcode and 8bp unique molecular identifier (UMI) and Read 2 being 50 bases containing transcript information.
Immunohistochemistry / Immunofluorescence
If mice were harvested for BEC isolation, the right-lateral lobe of the liver was ligated and resected before perfusion. If mice were not used for BEC isolation, the whole liver was isolated. Livers and other organs were fixed in 4% Paraformaldehyde for 24–48 hours at room temperature, washed with PBS and 70% ethanol, and embedded in paraffin. 5 μm sections were rehydrated and treated with citric-acid based pH 6.0 Antigen Unmasking Solution (Vector Labs,) at 95°C in a cooker for 1h for antigen retrieval. Slides were then treated with 0.3% hydrogen peroxide to quench endogenous peroxidase activity. To prevent non-specific antibody binding, slides were incubated in protein blocking solution (5% donkey Serum [Sigma-Aldrich] in 1% BSA/PBS/0.1% Tween) for 1 hour before overnight incubation with primary antibody at 4°C. The slides were washed three times in PBS for 5 minutes and then for immunofluorescence (IF) incubated with appropriate fluorescent secondary antibodies for 45 minutes in blocking buffer. For IF stains for GFP and JUNB, tyramide amplification was used (AF488 Tyramide SuperBoost Kit, Thermo Fisher Scientific) according to kit specifications. Slides were then washed and incubated with 1 μg/ml DAPI for 10 minutes in PBS and then mounted with Prolong Gold antifade with DAPI (Invitrogen), for IF.
To process immunohistochemistry (IHC) samples, appropriate biotinylated secondary antibodies (Vector Labs) were used with the Vectastain Elite ABC-HRP reagent (Vector Labs) and Diaminobenzidine-reaction kit (Vector Labs) to develop the IHC signal. Harris modified haematoxylin (Fisher Scientific) was used to counterstain nuclei. Finally, slides were washed, dehydrated, and mounted using Vectamount (Vector Labs). TUNEL assay was performed using the In Situ Cell Detection Kit, TMR red (Sigma Aldrich) according to manufacturer’s instructions.
RNA In Situ Hybridization
RNAscope Multiplex Fluorescent Detection kit v2 (ACDbio) in combination with TSA Fluorescein and Cyanine3 Plus Evaluation kits (Perkin Elmer) were used for RNA in situ hybridization according to manufacturer’s instructions. Before mounting, the slides were counterstained with a primary antibody against pCK or KRT19 for 1h at RT, and then processed as described for the IF methods. Probes for TdTomato and murine Cyr61, Klf6 and Hes1 were used (ACDbio).
Microscopy
IHC images were taken on a Zeiss Axio scope. IF images were obtained on a Zeiss AxioObserver Z1 or on a Zeiss LSM 700 Laser Scanning Confocal microscope. Organoids were visualized by a Nikon SMZ18 and a Zeiss AxioObserver Z1 with Apotome. Composite IF images are indicated by colored text that corresponds to each respective overlaid channel within the image.
Single-Cell Organoid Forming Assay
Single BECs were sorted directly into a 96-well plate (1 cell/well) containing organoid media with 5% Geltrex (Thermo Fisher Scientific, LDEV-Free, hESC-Qualified, reduced growth factor basement membrane matrix) as previously described(Bin Li et al., 2017). Organoid forming percentage was determined 14 days after plating. Organoid media consisted of a 1:1 mixture of L-WRN conditioned media generated as described previously(Miyoshi and Stappenbeck, 2013) and fresh 2X-Media (Advanced Dulbecco’s modified Eagle’s medium /F12 medium [Invitrogen], 103 U/ml;103 μg/ml Penicillin/Streptomycin (Invitrogen), 2 mM L-Glutamine, 2x N2-supplement [Invitrogen], 2× B27 without vitamin A supplement [Invitrogen], 20 mM nicotinamide [Sigma-Aldrich], 0.002 mM dexamethasone [Sigma-Aldrich], 10 mM HEPES [Invitrogen], 20 μM Y27632 [Sigma-Aldrich] (only upon initial derivation and upon passage), 50 ng/ml rmEGF [R&D Systems], 40 ng/ml rmHGF [Peprotech], and 1:500 Primocin [Invivogen]).
RNA Isolation and quantitative RT-PCR
RNA was isolated using Trizol Reagent (Life Technologies) or NucleoSpin® RNA XS (Macherey-Nagel) according to manufacturers’ instructions. Isolated RNA was reverse transcribed for real-time quantitative PCR (qRT-PCR) by an iScript™ cDNA Synthesis Kit (Bio-Rad). qRT-PCR was performed on One Step plus Sequence Detection System (Applied Biosystems) using Fast SYBR® Green Master Mix (Life Technologies). Gene expression data was normalized to Gapdh. qRT-PCR primer sequences are listed in Table S7.
Bulk RNA-Sequencing
RNA was isolated from FACs sorted BECs using the NucleoSpin® RNA XS Kit (Macherey-Nagel) according to the manufacturer’s instructions. Libraries were prepared on the same day using TruSeq RNA Library Preparation Kit v2, Set B (Illumina). Quantitative PCR and TapeStation to assess library concentration were run by the Biopolymers facility at Harvard Medical School. Samples were sequenced using an Illumina NextSeq 500 with Mid Output kit v2 for 56 cycles.
Quantification and Statistical Analysis
BEC scRNA-Seq Computational Analysis
Reads from BEC scRNA-seq were mapped using bwa mem-0.7.10 with default parameters to the reference transcriptome (Mus musculus 10) after extraction of the corresponding cell-specific barcode and unique molecular identifier (UMI). The number of unique transcripts per gene for each cell-specific barcode was extracted from the UMI count as previously described in Grün et al.(Grün et al., 2016). We hence refer to transcripts as unique molecules based on UMI correction. In a first filtering step, only cellular barcodes with more than 1000 mapped reads were kept (1228, 1249 and 1304 barcodes in homeostatic mice 1, 2, and 3 respectively; 1517 barcodes in DDC). Next, cellular barcodes with more than 20% mitochondrial transcripts were discarded. We ran RaceID3(Herman et al., 2018) to downsample transcript count per cell to 700, and we subsequently removed genes that are present only in 2 cells or less that have 5 transcripts or less. The remaining 286 genes (from originally 14,193 genes found in the raw data) were used to build a t-distributed stochastic neighbor-embedding (t-SNE) map based on Pearson-correlation distances between cells. Non-BEC contaminants, and highly stressed cells (identified as those where heat-shock proteins represent > 1.25% of the whole transcriptome), were identified and removed. The robustness of the data-set was tested with two batch correction algorithms, scran and the one included in RaceID3(Haghverdi et al., 2018; Herman et al., 2018). Unsupervised clustering (k-medoids) was performed using RaceID to identify subpopulations. To generate the heatmap in Figure 1D, the cells in the x-axis were ordered left to right according to their y-coordinate in the t-SNE from Figure 1C (bottom to top). This strategy, to order the cells in that way, was confirmed by performing hierarchical clustering and unsupervised k-medoids clustering (using RaceID3) of the cells based on their gene expression. Both independent clustering approaches identified cellular populations that were ordered along the y-axis of the t-SNE. The 286 genes on the y-axis were hierarchically clustered by their z-scores (with maximum value set to 3). Genes in clusters annotated with numbers 1, 2 and 5, which show opposing gradients in the average gene expression, were used to define a distinct BEC subset A (26% of cells) and subset B (74%). These gene selections were consistent with the ones defining the cellular subpopulations obtained by k-medoid-based and hierarchical-based clustering. For Figure 1E, a differential gene expression analysis between cell subsets A and B was performed (Table S3) to rank the significant differentially expressed genes based on log2 fold-change and to compare with the top 600 expressed genes from Yap overexpression in the liver(Dong et al., 2007) by GSEA3.0. In Figure 1F, gene ontology analysis of these differentially-expressed genes was performed using EnrichR(Chen et al., 2013). In Figure S3B–C for the construction of the t-SNE map, the DDC data set was combined with the BEC control data.
The sequencing data of the targeted amplification was mapped in the same way. For Figure S7B, cells were stratified according to their YAP status (subset A vs. subset B from Figure 1D), and the distribution of number of detected UMIs per cell was computed for each of the targeted genes. Significance was assessed using Kolmogorov-Smirnov test.
Hepatocyte scRNA-Seq Computational Analysis
Read alignment was performed as in (Macosko et al., 2015). Briefly, for each NextSeq sequencing run, raw sequencing data was converted to demultiplexed FASTQ files using bcl2fastq2 based on Nextera N700 indices corresponding to individual samples/arrays. Reads were then aligned to mm10 genome using the Galaxy portal maintained by the Broad Institute for Drop-Seq alignment using standard settings. Individual reads were tagged according to the 12-bp barcode sequencing and the 8-bp UMI contained in Read 1 of each fragment. Following alignment, reads were binned onto 12-bp cell barcodes and collapsed by their 8-bp UMI. Digital gene expression matrices (e.g. cell by gene tables) for each sample were obtained from quality filtered and mapped reads and UMI-collapsed data and were utilized for further analysis. Barcodes with more than 40% and 80% mitochondrial transcripts in the control and the DDC samples, respectively, were removed.
The number of unique transcripts per gene for each cell-specific barcode was extracted from the UMI count as previously described in Grün et al.(Grün et al., 2016). We hence refer to transcripts as unique molecules based on UMI correction. In a first filtering step, only cellular barcodes with more than 1000 mapped reads were kept (5221 barcodes for adult control mouse and 3192 barcodes for DDC-treated mouse). RaceID3(Herman et al., 2018) was run to downsample transcript count per cell to 700, and subsequently non-hepatocyte contaminants were removed and genes that were present only in 2 cells or less that have 5 transcripts or less. The remaining 277 genes (from originally 16,874 genes found in the raw data) were used to build a t-SNE map based on Pearson-correlation distances between cells. To generate the heatmaps in Figure 4A and Figure S3G, both homeostatic and DDC cells in the x-axis were ordered left to right according to zonation using the algorithm described in(Halpern et al., 2017). In Figures S3F and S3H–I, for the construction of the t-SNE map, the DDC data set was combined with the adult hepatocyte control data.
Bulk RNA-Sequencing Computational Analysis
Raw sequence reads were processed using Trimmomatic-0.33 with the following parameters: TRAILING:25 MINLEN:35. Sequences were aligned using STAR aligner to the mouse genome: mm10. Gene counts were determined using FeatureCounts. Differential analysis between samples was performed by normalizing read counts using DESeq2 in RStudio and examining significantly expressed genes padj < 0.05. Heatmap was generated using pheatmap (v. 1.0.8) in RStudio. Gene ontology analysis of differentially-expressed genes was performed using the DAVID Bioinformatics database(Huang et al., 2009).
ChIP-Seq Data Analysis
ChIP-Seq data was re-analyzed from previously published data(Galli et al., 2015). Data was aligned to the human genome hg19 using the UCSC genome browser.
Quantification / Statistical Analysis
Power calculations were not routinely performed; however, animal numbers were chosen to reflect the expected magnitude of response considering the variability observed in previous experiments. For quantification of sections, in general, 5–10 random portal fields of each liver sample were imaged and then quantified using Fiji software. Data presented are expressed as mean ± standard deviation (SD) unless otherwise specified. Data other than sequencing data were analyzed and plotted using Prism Software 8.0 (GraphPad). Technical and biological replicates are specified for each experiment in the figure legends. P values are presented as follows: * p < 0.05, ** p < 0.01, *** p < 0.001, **** p < 0.0001, and were determined by two-tailed Student’s t test, unless otherwise specified in the figure legends. When comparing more than two means, significance was assessed by ANOVA, followed by Tukey multiple comparisons test. To compare differences of cellular distribution in regard to mRNA-dots per cell as obtained by RNA-ISH data, the Kullback-Leibler test was performed. FlowJo software was used for all flow-cytometry analysis. Figures were generated using Adobe Illustrator.
Data Availability
The scRNA-seq data (BECs and hepatocytes) and the bulk RNA-seq data (BECs) are deposited in the Gene Expression Omnibus database under accession number GSE125688.
Supplementary Material
Table S1. Gene Correlation Analysis from scRNA-seq of Homeostatic BECs. Related to Figure 1.
Table S3. Differentially Expressed Yap-associated Genes from scRNA-seq of Homeostatic BECs (population A vs. population B). Related to Figure 1.
Table S4. Differentially Expressed Genes (bulk) of Control (Sample 3) vs. DDC-treated BECs from scRNA-seq. Related to Figure 3.
Table S5. Differentially Expressed Genes in BECs of Control vs. ΔYap mice (bulk RNA-seq). Related to Figure 5.
Highlights.
ScRNA-seq of the healthy and injured liver epithelium reveals dynamic heterogeneity
Transcriptional heterogeneity is driven by fluctuating activation of YAP signaling
YAP is essential for adult biliary cell survival under homeostatic conditions
YAP is required in hepatocytes for the ductular response during regeneration
ACKNOWLEDGEMENTS
The authors are grateful to Ronald Mathieu and Mahnaz Paktinat for assistance with FACS and to Luigi Terracciano for his assistance in evaluation of histopathology. The authors thank Charles Murtaugh for Hes1CreER mice, and the members of the Camargo laboratory for helpful discussion. This work was supported by a National Science Foundation Predoctoral Award and a NIH grant F31 DK107049–01A1 to B.J.P.-M., Swiss National Science Foundation fellowships P2BSP3_161941 and P300PB_171568, and the Eugen and Elisabeth Schellenberg-Stiftung to M.T.D., European Research Council Advanced grant (ERC-AdG 742225-IntScOmics), Nederlandse Organisatie voor Wetenschappelijk Onderzoek TOP award (NWO-CW 714.016.001), and the Foundation for Fundamental Research on Matter, financially supported by NWO (FOM-14NOISE01) to A.v.O.. A.K.S. was supported by the Searle Scholars Program, the Beckman Young Investigator Program, the Alfred P. Sloan Foundation, NIH grants 1DP2GM119419, 2U19AI089992, 1U54CA217377, 2P01AI039671, 5U24AI118672, 2RM1HG006193, 1R33CA202820, and Bill and Melinda Gates Foundation grants OPP1139972 and BMGF OPP1116944. J.O.M. is an HHMI Damon Runyon Cancer Research Foundation Fellow (DRG-2274–16). A.R. and P.A.D were supported by NIH R01 DK047987. Further support was provided by NIH R01 DK099559 and NIHR01 AR064036 to F.D.C.
Footnotes
DECLARATION OF INTERESTS
The authors declare no competing interests.
Publisher's Disclaimer: This is a PDF file of an unedited manuscript that has been accepted for publication. As a service to our customers we are providing this early version of the manuscript. The manuscript will undergo copyediting, typesetting, and review of the resulting proof before it is published in its final citable form. Please note that during the production process errors may be discovered which could affect the content, and all legal disclaimers that apply to the journal pertain.
REFERENCES
- Anakk S, Bhosale M, Schmidt VA, Johnson RL, Finegold MJ, and Moore DD (2013). Bile Acids Activate YAP to Promote Liver Carcinogenesis. Cell Rep. 5, 1060–1069. [DOI] [PMC free article] [PubMed] [Google Scholar]
- Bai H, Zhang N, Xu Y, Chen Q, Khan M, Potter JJ, Nayar SK, Cornish T, Alpini G, Bronk S, et al. (2012). Yes-associated protein regulates the hepatic response after bile duct ligation. Hepatology 56, 1097–1107. [DOI] [PMC free article] [PubMed] [Google Scholar]
- Barry ER, Morikawa T, Butler BL, Shrestha K, la Rosa de R, Yan KS, Fuchs CS, Magness ST, Smits R, Ogino S, et al. (2012). Restriction of intestinal stem cell expansion and the regenerative response by YAP. Nature 493, 106–110. [DOI] [PMC free article] [PubMed] [Google Scholar]
- Benhamouche S, Curto M, Saotome I, Gladden AB, Liu CH, Giovannini M, and McClatchey AI (2010). Nf2/Merlin controls progenitor homeostasis and tumorigenesis in the liver. Genes Dev 24, 1718–1730. [DOI] [PMC free article] [PubMed] [Google Scholar]
- Li Bin, Dorrell C, Canaday PS, Pelz C, Haft A, Finegold M, and Grompe M (2017). Adult Mouse Liver Contains Two Distinct Populations of Cholangiocytes. Stem Cell Reports 9, 478–489. [DOI] [PMC free article] [PubMed] [Google Scholar]
- Centuori SM, Gomes CJ, Trujillo J, Borg J, Brownlee J, Putnam CW, and Martinez JD (2016). Deoxycholic acid mediates non-canonical EGFR-MAPK activation through the induction of calcium signaling in colon cancer cells. Biochim Biophys Acta 1861, 663–670. [DOI] [PMC free article] [PubMed] [Google Scholar]
- Chen EY, Tan CM, Kou Y, Duan Q, Wang Z, Meirelles GV, Clark NR, and Ma’ayan A (2013). Enrichr: interactive and collaborative HTML5 gene list enrichment analysis tool. BMC Bioinformatics 14, 128. [DOI] [PMC free article] [PubMed] [Google Scholar]
- Chen Q, Zhang N, Gray RS, Li H, Ewald AJ, Zahnow CA, and Pan D (2014). A temporal requirement for Hippo signaling in mammary gland differentiation, growth, and tumorigenesis. Genes Dev 28, 432–437. [DOI] [PMC free article] [PubMed] [Google Scholar]
- Dawson PA, Haywood J, Craddock AL, Wilson M, Tietjen M, Kluckman K, Maeda N, and Parks JS (2003). Targeted Deletion of the Ileal Bile Acid Transporter Eliminates Enterohepatic Cycling of Bile Acids in Mice. J Biol Chem 278, 33920–33927. [DOI] [PubMed] [Google Scholar]
- De Lisle RC, Petitt M, Huff J, Isom KS, and Agbas A (1997). MUCLIN expression in the cystic fibrosis transmembrane conductance regulator knockout mouse. Gastroenterology 113, 521–532. [DOI] [PubMed] [Google Scholar]
- Deng X, Zhang X, Li W, Feng R-X, Li L, Yi G-R, Zhang X-N, Yin C, Yu H-Y, Zhang J-P, et al. (2018). Chronic Liver Injury Induces Conversion of Biliary Epithelial Cells into Hepatocytes. Cell Stem Cell 23, 114–122. [DOI] [PubMed] [Google Scholar]
- Deutschmann K, Reich M, Klindt C, Dröge C, Spomer L, Häussinger D, and Keitel V (2018). Bile acid receptors in the biliary tree: TGR5 in physiology and disease. Biochim Biophys Acata Mol Basis Dis 1864, 1319–1325. [DOI] [PubMed] [Google Scholar]
- Dong J, Feldmann G, Huang J, Wu S, Zhang N, Comerford SA, Gayyed MF, Anders RA, Maitra A, and Pan D (2007). Elucidation of a Universal Size-Control Mechanism in Drosophila and Mammals. Cell 130, 1120–1133. [DOI] [PMC free article] [PubMed] [Google Scholar]
- Dorrell C, Erker L, Lanxon-Cookson KM, Abraham SL, Victoroff T, Ro S, Canaday PS, Streeter PR, and Grompe M (2008). Surface markers for the murine oval cell response. Hepatology 48, 1282–1291. [DOI] [PMC free article] [PubMed] [Google Scholar]
- Dorrell C, Erker L, Schug J, Kopp JL, Canaday PS, Fox AJ, Smirnova O, Duncan AW, Finegold MJ, Sander M, et al. (2011). Prospective isolation of a bipotential clonogenic liver progenitor cell in adult mice. Genes Dev 25, 1193–1203. [DOI] [PMC free article] [PubMed] [Google Scholar]
- Dubois F, Keller M, Calvayrac O, Soncin F, Hoa L, Hergovich A, Parrini M-C, Mazières J, Vaisse-Lesteven M, Camonis J, et al. (2016). RASSF1A Suppresses the Invasion and Metastatic Potential of Human Non-Small Cell Lung Cancer Cells by Inhibiting YAP Activation through the GEF-H1/RhoB Pathway. Cancer Res 76, 1627–1640. [DOI] [PubMed] [Google Scholar]
- Galli GG, Carrara M, Yuan W-C, Valdes-Quezada C, Gurung B, Pepe-Mooney B, Zhang T, Geeven G, Gray NS, de Laat W, et al. (2015). YAP Drives Growth by Controlling Transcriptional Pause Release from Dynamic Enhancers. Mol Cell 60, 328–337. [DOI] [PMC free article] [PubMed] [Google Scholar]
- Gierahn TM, Wadsworth MH, Hughes TK, Bryson BD, Butler A, Satija R, Fortune S, Love JC, and Shalek AK (2017). Seq-Well: portable, low-cost RNA sequencing of single cells at high throughput. Nat Methods 14, 395–398. [DOI] [PMC free article] [PubMed] [Google Scholar]
- Grün D, Muraro MJ, Boisset J-C, Wiebrands K, Lyubimova A, Dharmadhikari G, van den Born M, van Es J, Jansen E, Clevers H, et al. (2016). De Novo Prediction of Stem Cell Identity using Single-Cell Transcriptome Data. Cell Stem Cell 19, 266–277. [DOI] [PMC free article] [PubMed] [Google Scholar]
- Gu Y, Forostyan T, Sabbadini R, and Rosenblatt J (2011). Epithelial cell extrusion requires the sphingosine-1-phosphate receptor 2 pathway. J Cell Biol 193, 667–676. [DOI] [PMC free article] [PubMed] [Google Scholar]
- Haghverdi L, Lun ATL, Morgan MD, and Marioni JC (2018). Batch effects in single-cell RNA-sequencing data are corrected by matching mutual nearest neighbors. Nat Biotechnol 36, 421–427. [DOI] [PMC free article] [PubMed] [Google Scholar]
- Halpern KB, Shenhav R, Matcovitch-Natan O, Tóth B, Lemze D, Golan M, Massasa EE, Baydatch S, Landen S, Moor AE, et al. (2017). Single-cell spatial reconstruction reveals global division of labour in the mammalian liver. Nature 542, 352–356. [DOI] [PMC free article] [PubMed] [Google Scholar]
- Halpern KB, Tanami S, Landen S, Chapal M, Szlak L, Hutzler A, Nizhberg A, and Itzkovitz S (2015). Bursty Gene Expression in the Intact Mammalian Liver. Mol Cell 58, 147–156. [DOI] [PMC free article] [PubMed] [Google Scholar]
- Herman JS, Sagar, and Grün D (2018). FateID infers cell fate bias in multipotent progenitors from single-cell RNA-seq data. Nat Methods 15, 379–386. [DOI] [PubMed] [Google Scholar]
- Higuchi H, Yoon J-H, Grambihler A, Werneburg N, Bronk SF, and Gores GJ (2003). Bile Acids Stimulate cFLIP Phosphorylation Enhancing TRAIL-mediated Apoptosis. J Biol Chem 278, 454–461. [DOI] [PubMed] [Google Scholar]
- Huang DW, Sherman BT, and Lempicki RA (2009). Systematic and integrative analysis of large gene lists using DAVID bioinformatics resources. Nat Protoc 4, 44–57. [DOI] [PubMed] [Google Scholar]
- Huch M, Gehart H, van Boxtel R, Hamer K, Blokzijl F, Verstegen MMA, Ellis E, van Wenum M, Fuchs SA, de Ligt J, et al. (2015). Long-Term Culture of Genome-Stable Bipotent Stem Cells from Adult Human Liver. Cell 160, 299–312. [DOI] [PMC free article] [PubMed] [Google Scholar]
- Jones H, Alpini G, and Francis H (2015). Bile acid signaling and biliary functions. Acta Pharm Sin B 5, 123–128. [DOI] [PMC free article] [PubMed] [Google Scholar]
- Jörs S, Jeliazkova P, Ringelhan M, Thalhammer J, Dürl S, Ferrer J, Sander M, Heikenwalder M, Schmid RM, Siveke JT, et al. (2015). Lineage fate of ductular reactions in liver injury and carcinogenesis. J Clin Invest. 125, 2445–2457. [DOI] [PMC free article] [PubMed] [Google Scholar]
- Kamimoto K, Kaneko K, Kok CY-Y, Okada H, Miyajima A, and Itoh T (2016). Heterogeneity and stochastic growth regulation of biliary epithelial cells dictate dynamic epithelial tissue remodeling. Elife 5, e15034. [DOI] [PMC free article] [PubMed] [Google Scholar]
- Kaneko K, Kamimoto K, Miyajima A, and Itoh T (2015). Adaptive remodeling of the biliary architecture underlies liver homeostasis. Hepatology 61, 2056–2066. [DOI] [PubMed] [Google Scholar]
- Kanno N, LeSage G, Glaser S, Alvaro D, and Alpini G (2000). Functional heterogeneity of the intrahepatic biliary epithelium. Hepatology 31, 555–561. [DOI] [PubMed] [Google Scholar]
- Kim H-B, and Myung S-J (2018). Clinical implications of the Hippo-YAP pathway in multiple cancer contexts. BMB Rep 51, 119–125. [DOI] [PMC free article] [PubMed] [Google Scholar]
- Klein AM, Mazutis L, Akartuna I, Tallapragada N, Veres A, Li V, Peshkin L, Weitz DA, and Kirschner MW (2015). Droplet Barcoding for Single-Cell Transcriptomics Applied to Embryonic Stem Cells. Cell 161, 1187–1201. [DOI] [PMC free article] [PubMed] [Google Scholar]
- Kopinke D, Brailsford M, Shea JE, Leavitt R, Scaife CL, and Murtaugh LC (2011). Lineage tracing reveals the dynamic contribution of Hes1+ cells to the developing and adult pancreas. Development 138, 431–441. [DOI] [PMC free article] [PubMed] [Google Scholar]
- Lazaridis KN, Pham L, Tietz P, Marinelli RA, deGroen PC, Levine S, Dawson PA, and LaRusso NF (1997). Rat cholangiocytes absorb bile acids at their apical domain via the ileal sodium-dependent bile acid transporter. J Clin Invest 100, 2714–2721. [DOI] [PMC free article] [PubMed] [Google Scholar]
- Lee K-P, Lee J-H, Kim T-S, Kim T-H, Park H-D, Byun J-S, Kim M-C, Jeong W-I, Calvisi DF, Kim J-M, et al. (2010). The Hippo-Salvador pathway restrains hepatic oval cell proliferation, liver size, and liver tumorigenesis. Proc Natl Acad Sci U S A 107, 8248–8253. [DOI] [PMC free article] [PubMed] [Google Scholar]
- Li S, Wang Q, Chakladar A, Bronson RT, and Bernards A (2000). Gastric hyperplasia in mice lacking the putative Cdc42 effector IQGAP1. Mol Cell Biol 20, 697–701. [DOI] [PMC free article] [PubMed] [Google Scholar]
- Li W-C, Ralphs KL, and Tosh D (2010). Isolation and culture of adult mouse hepatocytes. Methods Mol Biol 633, 185–196. [DOI] [PubMed] [Google Scholar]
- Lu L, Li Y, Kim SM, Bossuyt W, Liu P, Qiu Q, Wang Y, Halder G, Finegold MJ, Lee JS, et al. (2010). Hippo signaling is a potent in vivo growth and tumor suppressor pathway in the mammalian liver. Proc Natl Acad Sci U S A 107, 1437–1442. [DOI] [PMC free article] [PubMed] [Google Scholar]
- Lu W-Y, Bird TG, Boulter L, Tsuchiya A, Cole AM, Hay T, Guest RV, Wojtacha D, Man TY, Mackinnon A, et al. (2015). Hepatic progenitor cells of biliary origin with liver repopulation capacity. Nat Cell Biol 17, 971–983. [DOI] [PMC free article] [PubMed] [Google Scholar]
- Macosko EZ, Basu A, Satija R, Nemesh J, Shekhar K, Goldman M, Tirosh I, Bialas AR, Kamitaki N, Martersteck EM, et al. (2015). Highly Parallel Genome-wide Expression Profiling of Individual Cells Using Nanoliter Droplets. Cell 161, 1202–1214. [DOI] [PMC free article] [PubMed] [Google Scholar]
- Maglic D, Schlegelmilch K, Dost AF, Panero R, Dill MT, Calogero RA, and Camargo FD (2018). YAP-TEAD signaling promotes basal cell carcinoma development via a c-JUN/AP1 axis. EMBO J 37, e98642. [DOI] [PMC free article] [PubMed] [Google Scholar]
- Means AL, Xu Y, Zhao A, Ray KC, and Gu G (2008). A CK19 CreERTknockin mouse line allows for conditional DNA recombination in epithelial cells in multiple endodermal organs. Genesis 46, 318–323. [DOI] [PMC free article] [PubMed] [Google Scholar]
- Michalopoulos GK (2010). Liver Regeneration after Partial Hepatectomy. The American Journal of Pathology 176, 2–13. [DOI] [PMC free article] [PubMed] [Google Scholar]
- Miyoshi H, and Stappenbeck TS (2013). In vitro expansion and genetic modification of gastrointestinal stem cells in spheroid culture. Nat Protoc 8, 2471–2482. [DOI] [PMC free article] [PubMed] [Google Scholar]
- Okabe H, Yang J, Sylakowski K, Yovchev M, Miyagawa Y, Nagarajan S, Chikina M, Thompson M, Oertel M, Baba H, et al. (2016). Wnt signaling regulates hepatobiliary repair following cholestatic liver injury in mice. Hepatology 64, 1652–1666. [DOI] [PMC free article] [PubMed] [Google Scholar]
- Okabe M, Tsukahara Y, Tanaka M, Suzuki K, Saito S, Kamiya Y, Tsujimura T, Nakamura K, and Miyajima A (2009). Potential hepatic stem cells reside in EpCAM+ cells of normal and injured mouse liver. Development 136, 1951–1960. [DOI] [PubMed] [Google Scholar]
- Paolini M, Pozzetti L, Montagnani M, Potenza G, Sabatini L, Antelli A, Cantelli-Forti G, and Roda A (2002). Ursodeoxycholic acid (UDCA) prevents DCA effects on male mouse liver via up-regulation of CYP [correction of CXP] and preservation of BSEP activities. Hepatology 36, 305–314. [DOI] [PubMed] [Google Scholar]
- Patel SH, Camargo FD, and Yimlamai D (2017). Hippo Signaling in the Liver Regulates Organ Size, Cell Fate, and Carcinogenesis. Gastroenterology 152, 533–545. [DOI] [PMC free article] [PubMed] [Google Scholar]
- Raven A, Lu W-Y, Man TY, Ferreira-Gonzalez S, O’Duibhir E, Dwyer BJ, Thomson JP, Meehan RR, Bogorad R, Koteliansky V, et al. (2017). Cholangiocytes act as facultative liver stem cells during impaired hepatocyte regeneration. Nature 547, 350–354. [DOI] [PMC free article] [PubMed] [Google Scholar]
- Reddy BVVG, and Irvine KD (2013). Regulation of Hippo Signaling by EGFR-MAPK Signaling through Ajuba Family Proteins. Developmental Cell 24, 459–471. [DOI] [PMC free article] [PubMed] [Google Scholar]
- Rodrigo-Torres D, Affò S, Coll M, Morales-Ibanez O, Millán C, Blaya D, Alvarez-Guaita A, Rentero C, Lozano JJ, Maestro MA, et al. (2014). The biliary epithelium gives rise to liver progenitor cells. Hepatology 60, 1367–1377. [DOI] [PMC free article] [PubMed] [Google Scholar]
- Schaub JR, Malato Y, Gormond C, and Willenbring H (2014). Evidence against a Stem Cell Origin of New Hepatocytes in a Common Mouse Model of Chronic Liver Injury. Cell Rep 8, 933–939. [DOI] [PMC free article] [PubMed] [Google Scholar]
- Schindelin J, Arganda-Carreras I, Frise E, Kaynig V, Longair M, Pietzsch T, Preibisch S, Rueden C, Saalfeld S, Schmid B, et al. (2012). Fiji: an open-source platform for biological-image analysis. Nat Methods 9, 676–682. [DOI] [PMC free article] [PubMed] [Google Scholar]
- Schlegelmilch K, Mohseni M, Kirak O, Pruszak J, Rodriguez JR, Zhou D, Kreger BT, Vasioukhin V, Avruch J, Brummelkamp TR, et al. (2011). Yap1 Acts Downstream of alpha-Catenin to Control Epidermal Proliferation. Cell 144, 782–795. [DOI] [PMC free article] [PubMed] [Google Scholar]
- Stein C, Bardet AF, Roma G, Bergling S, Clay I, Ruchti A, Agarinis C, Schmelzle T, Bouwmeester T, Schübeler D, et al. (2015). YAP1 Exerts Its Transcriptional Control via TEAD-Mediated Activation of Enhancers. PLoS Genet 11, e1005465. [DOI] [PMC free article] [PubMed] [Google Scholar]
- Subramanian A, Tamayo P, Mootha VK, Mukherjee S, Ebert BL, Gillette MA, Paulovich A, Pomeroy SL, Golub TR, Lander ES, et al. (2005). Gene set enrichment analysis: a knowledge-based approach for interpreting genome-wide expression profiles. Proc Natl Acad Sci U S A 102, 15545–15550. [DOI] [PMC free article] [PubMed] [Google Scholar]
- Tabibian JH, Masyuk AI, Masyuk TV, O’Hara SP, and LaRusso NF (2013). Physiology of cholangiocytes. Compr Physiol 3, 541–565. [DOI] [PMC free article] [PubMed] [Google Scholar]
- Tag CG, Sauer-Lehnen S, Weiskirchen S, Borkham-Kamphorst E, Tolba RH, Tacke F, and Weiskirchen R (2015). Bile Duct Ligation in Mice: Induction of Inflammatory Liver Injury and Fibrosis by Obstructive Cholestasis. J Vis Exp 96, e52438. [DOI] [PMC free article] [PubMed] [Google Scholar]
- Vassileva G, Golovko A, Markowitz L, Abbondanzo SJ, Zeng M, Yang S, Hoos L, Tetzloff G, Levitan D, Murgolo NJ, et al. (2006). Targeted deletion of Gpbar1 protects mice from cholesterol gallstone formation. Biochem. J 398, 423–430. [DOI] [PMC free article] [PubMed] [Google Scholar]
- Yang K, Wu Y, Cheng P, Zhang J, Yang C, Pi B, Ye Y, You H, Chen A, Xu T, et al. (2016). YAP and ERK mediated mechanical strain-induced cell cycle progression through RhoA and cytoskeletal dynamics in rat growth plate chondrocytes. J Orthop Res. 34, 1121–1129. [DOI] [PubMed] [Google Scholar]
- Yanger K, Zong Y, Maggs LR, Shapira SN, Maddipati R, Aiello NM, Thung SN, Wells RG, Greenbaum LE, and Stanger BZ (2013). Robust cellular reprogramming occurs spontaneously during liver regeneration. Genes Dev 27, 719–724. [DOI] [PMC free article] [PubMed] [Google Scholar]
- Yanger K, Knigin D, Zong Y, Maggs L, Gu G, Akiyama H, Pikarsky E, and Stanger Ben Z (2014). Adult Hepatocytes Are Generated by Self-Duplication Rather than Stem Cell Differentiation. Cell Stem Cell 15, 340–349. [DOI] [PMC free article] [PubMed] [Google Scholar]
- Yimlamai D, Christodoulou C, Galli GG, Yanger K, Pepe-Mooney B, Gurung B, Shrestha K, Cahan P, Stanger Ben Z, and Camargo FD (2014). Hippo Pathway Activity Influences Liver Cell Fate. Cell 157, 1324–1338. [DOI] [PMC free article] [PubMed] [Google Scholar]
- Zanconato F, Cordenonsi M, and Piccolo S (2016). YAP/TAZ at the Roots of Cancer. Cancer Cell 29, 783–803. [DOI] [PMC free article] [PubMed] [Google Scholar]
- Zanconato F, Forcato M, Battilana G, Azzolin L, Quaranta E, Bodega B, Rosato A, Bicciato S, Cordenonsi M, and Piccolo S (2015). Genome-wide association between YAP/TAZ/TEAD and AP-1 at enhancers drives oncogenic growth. Nat Cell Biol 17, 1218–1227. [DOI] [PMC free article] [PubMed] [Google Scholar]
- Zhang N, Bai H, David KK, Dong J, Zheng Y, Cai J, Giovannini M, Liu P, Anders RA, and Pan D (2010). The Merlin/NF2 tumor suppressor functions through the YAP oncoprotein to regulate tissue homeostasis in mammals. Dev Cell 19, 27–38. [DOI] [PMC free article] [PubMed] [Google Scholar]
- Zhang Y, and Klaassen CD (2010). Effects of feeding bile acids and a bile acid sequestrant on hepatic bile acid composition in mice. J. Lipid Res. 51, 3230–3242. [DOI] [PMC free article] [PubMed] [Google Scholar]
- Zilionis R, Nainys J, Veres A, Savova V, Zemmour D, Klein AM, and Mazutis L (2017). Single-cell barcoding and sequencing using droplet microfluidics. Nature Protoc 12, 44–73. [DOI] [PubMed] [Google Scholar]
Associated Data
This section collects any data citations, data availability statements, or supplementary materials included in this article.
Supplementary Materials
Table S1. Gene Correlation Analysis from scRNA-seq of Homeostatic BECs. Related to Figure 1.
Table S3. Differentially Expressed Yap-associated Genes from scRNA-seq of Homeostatic BECs (population A vs. population B). Related to Figure 1.
Table S4. Differentially Expressed Genes (bulk) of Control (Sample 3) vs. DDC-treated BECs from scRNA-seq. Related to Figure 3.
Table S5. Differentially Expressed Genes in BECs of Control vs. ΔYap mice (bulk RNA-seq). Related to Figure 5.
Data Availability Statement
The scRNA-seq data (BECs and hepatocytes) and the bulk RNA-seq data (BECs) are deposited in the Gene Expression Omnibus database under accession number GSE125688.