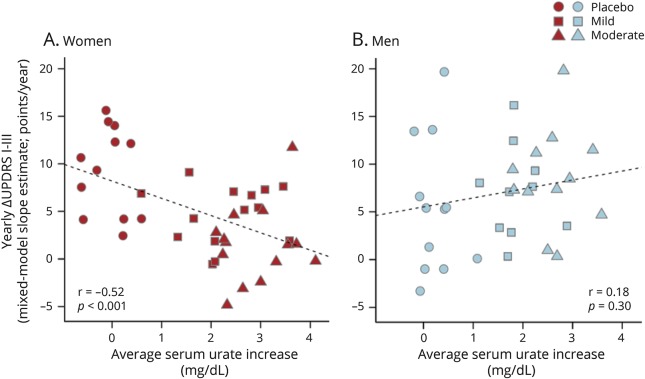
Figure 5. Relationships between change in serum urate and estimated rate of clinical decline.
(A) Women. (B) Men. For each participant, the increase in serum urate from baseline to the average of on-treatment values was plotted against the individual's annualized change in total UPDRS score estimated from the random-slopes model shown in figure 2. The placebo group data (circles) appear on the left of each plot given the expected lack of any urate change. Although a clustering of men in the placebo group showed no decline during the trial (filled circles in lower left), contributing to an overall trend toward worsening with increasing urate among men, the trend was not significant. UPDRS = Unified Parkinson’s Disease Rating Scale.

