Abstract
Background
We investigated cerebral degeneration and neurochemistry in patients with amyotrophic lateral sclerosis (ALS) using magnetic resonance spectroscopy (MRS).
Methods
We prospectively studied 65 patients and 43 age-matched healthy controls. Participants were recruited from 4 centers as part of a study in the Canadian ALS Neuroimaging Consortium. All participants underwent single-voxel proton MRS using a protocol standardized across all sites. Metabolites reflecting neuronal integrity (total N-acetyl aspartyl moieties [tNAA]) and gliosis (myo-inositol [Ino]), as well as creatine (Cr) and choline (Cho), were quantified in the midline motor cortex and midline prefrontal cortex. Comparisons were made between patients with ALS and healthy controls. Metabolites were correlated with clinical measures of upper motor neuron dysfunction, disease progression rate, and cognitive performance.
Results
In the motor cortex, tNAA/Cr, tNAA/Cho, and tNAA/Ino ratios were reduced in the ALS group compared with controls. Group differences in tNAA/Cr and tNAA/Cho in the prefrontal cortex displayed reduced ratios in ALS patients; however, these were not statistically significant. Reduced motor cortex ratios were associated with slower foot tapping rate, whereas only motor tNAA/Ino was associated with finger tapping rate. Disease progression rate was associated with motor tNAA/Cho. Verbal fluency, semantic fluency, and digit span forwards and backwards were associated with prefrontal tNAA/Cr.
Conclusions
This study demonstrates that cerebral degeneration in ALS is more pronounced in the motor than prefrontal cortex, that multicenter MRS studies are feasible, and that motor tNAA/Ino shows promise as a potential biomarker.
Amyotrophic lateral sclerosis (ALS) has the hallmarks of degeneration of upper and lower motor neurons (UMN and LMN), often with involvement of the frontal and temporal lobes. A major impediment to finding effective treatments is the lack of a biomarker for diagnosis and of understanding ALS biology and phenotypic heterogeneity.
Magnetic resonance spectroscopy (MRS) measures cerebral metabolites relevant in neurodegeneration: N-acetylaspartate (NAA, neuronal integrity marker) and myo-inositol (Ino, putative gliosis marker1). Previous studies demonstrated its utility in consistently detecting cerebral degeneration in ALS,2–10 where motor cortex NAA ratios to creatine (Cr),11 choline (Cho),12 or Ino,6 are reduced. Consistent with the spatial pathology of FTLD,13 NAA is reduced in the prefrontal cortex.14–16 We showed that NAA/Ino ratio has particular promise in detecting motor and prefrontal cortex degeneration6,16 because of the combined effects of decreased NAA from neuronal degeneration and increased Ino from gliosis.
All previous MRS studies have been at single centers, usually with small sample sizes, and with heterogeneous data acquisition and processing methods. The replication of prior MRS findings on a multicenter scale is an important step towards validation of clinical utility. We sought to do this and extend our prior observations of NAA/Ino changes by a study within the Canadian ALS Neuroimaging Consortium (CALSNIC), a multicenter clinical research platform that conducts neuroimaging research in a standardized manner. We hypothesized that spectroscopic markers of neuronal integrity will be abnormal in the motor and prefrontal cortices, and they will correlate with clinical signs of UMN dysfunction, disease progression, and cognitive impairment.
Methods
Canadian ALS Neuroimaging Consortium
The primary objectives of CALSNIC are to develop and validate novel neuroimaging biomarkers and to provide the infrastructure for collaborative translational research. Each participating center in CALSNIC followed identical standard operating procedures for clinical evaluations and brain imaging. Four sites were included in this study: the University of Alberta, the University of Calgary, the University of Toronto, and McGill University.
Standard protocol approvals, registrations, and patient consents
All patients and healthy controls gave written consent and the study was approved by the health research ethics boards at each of the participating sites. This study is registered with ClinicalTrials.gov under the identifier number: NCT02405182.
Participants
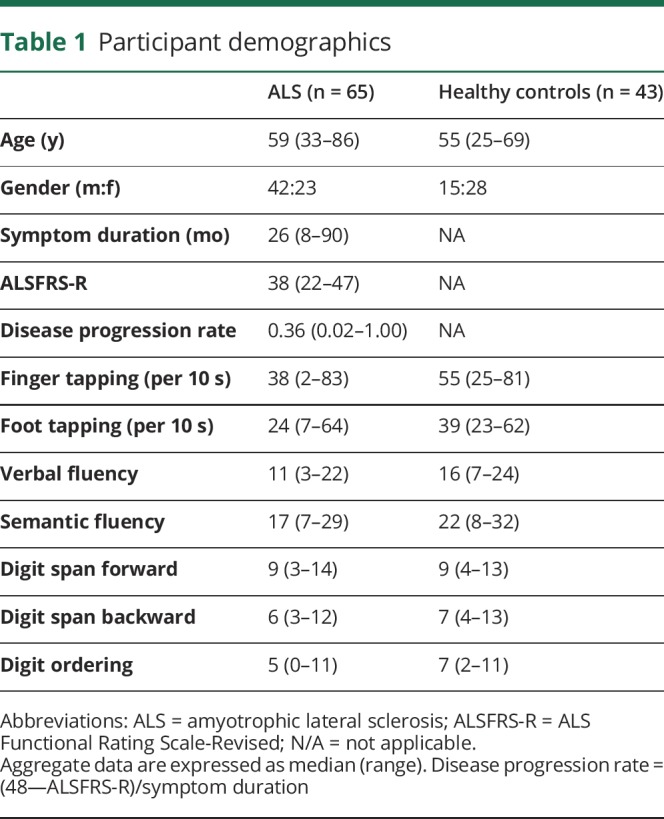
Sixty-five patients and 43 healthy controls were prospectively recruited from the ALS clinics (table 1). Eligible patients had a diagnosis of ALS according to the El Escorial criteria of possible ALS or higher,17 and thus had a combination of UMN and LMN signs on neurological examination in at least one region, and had the cognitive capacity to provide informed consent. Participants were excluded if they had a history of other neurological or psychiatric disorders, prior brain injury, or respiratory impairment resulting in an inability to lie flat and tolerate the MRI scan. Participants in the study were enrolled between September 2015 and February 2018. Average symptom duration was 33.2 ± 20.7 months at the time of the MRS data collection. There was an attempt to balance the ALS and healthy controls with respect to age and gender, but challenges in recruitment resulted in a sample of convenience. In addition, 5 healthy volunteers that were separate from the healthy controls (“traveling head phantoms”) were each scanned twice at the individual sites to evaluate the reproducibility of our MRS measures.
Table 1.
Participant demographics
Clinical evaluations
Finger and foot tapping rates (left and right) were measured and averaged as indicators of UMN function, and disability was assessed with the ALS Functional Rating Scale-Revised (ALSFRS-R). Cognitive function was assessed using tests for verbal fluency (letter F18), digit span, and the Edinburgh Cognitive and Behavioral ALS Screen (ECAS) scores. Disease progression rate was estimated using the formula: (48 − ALSFRS-R)/symptom duration.
MRI data acquisition
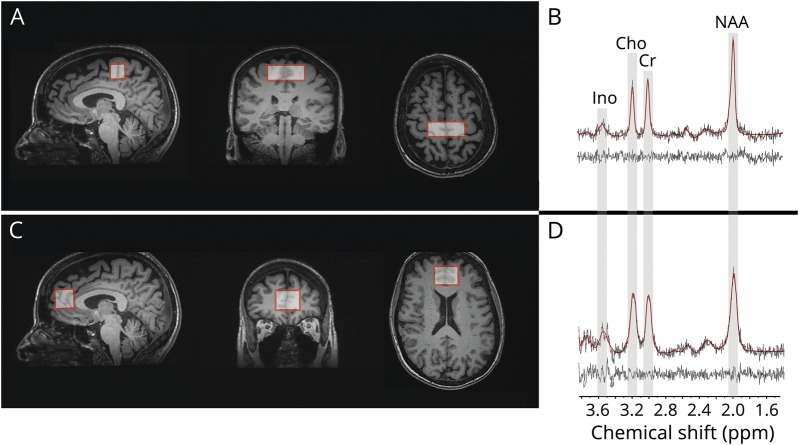
All data were acquired on MRI systems operating at 3 Tesla. Two sites (University of Alberta and McGill University) acquired data using Siemens systems (Prisma and TimTrio, respectively), and the remaining 2 sites acquired data using General Electric Healthcare (Discovery MR750) systems. The data acquisition protocol included a 3D-T1 volume acquired at 1 mm3 isotropic resolution. Acquisition parameters were identical for the Siemens systems, which used magnetization-prepared rapid gradient echo imaging (MPRAGE sequence, repetition time [TR] = 2,300 ms, echo time [TE] = 3.43 ms, inversion time [TI] = 900 ms, flip angle = 9°, field of view [FOV] = 256 mm × 256 mm) and the 2 General Electric systems, which used fast spoiled gradient-recalled echo imaging (FSPGR sequence, TR = 7.4 ms, TE = 3.1 ms, TI = 400 ms, flip angle = 11°, FOV = 256 mm × 256 mm). These anatomical images were used for planning of the MRS voxels in the 2 regions of interest: midline motor cortex (20 × 50 × 20 mm) and midline prefrontal cortex (25 × 32 × 25 mm) (figure). Voxels were placed with the use of anatomical landmarks according to a standardized procedure. The motor cortex voxel was centered symmetrically across the midline. Its bottom edge was parallel to the anterior commissure-posterior commissure (AC-PC) line. The posterior edge was parallel to and touching a line drawn perpendicular to the AC-PC line that touched the posterior edge of splenium. The prefrontal cortex voxel was also placed centered symmetrically across the midline. Its bottom edge was parallel to the AC-PC line at the level of genu of the corpus callosum. The posterior edge touched the anterior edge of the genu of corpus callosum. Single-voxel spectroscopy with a stimulated echo acquisition mode (STEAM) sequence was performed to acquire water suppressed spectra from each region (TR = 3 seconds, TE = 160 ms, mixing time [TM] = 40 ms, 2 acquisitions per voxel of 32 signal averages each). STEAM slice selection was performed at an offset of −1.9 ppm relative to the water frequency.
Figure. Single voxel magnetic resonance spectroscopy of the motor and prefrontal cortex.
Magnetic resonance spectroscopic data were acquired from 2 brain regions as illustrated in the T1-weighted images showing voxel prescription in the (A) motor and (C) prefrontal cortices. Proton magnetic resonance spectrum acquired from each of the regions, shown in (B) and (D), respectively, highlights the target metabolites: Cho = choline; Cr = creatine + phosphocreatine; Ino = myo-inositol; NAA = N-acetylaspartate + N-acetylaspartylglutamate.
MRS data post processing
All data were centrally processed and analyzed at a singlecore laboratory, the ALS Neuroimaging Research Unit, at the University of Alberta. Automated metabolite quantification of the proton MR spectra was performed using LCModel® (version 6.1).19 Manual inspection was conducted on each spectrum fitted by LCModel to assure quality with respect to lineshape, linewidth, signal-to-noise ratio, and the presence of spurious signal as a result of eddy current effects. Spectra not meeting these quality check criteria or those with an LCModel fit with a standard deviation greater than 15% were excluded from further analysis.19 MRS quality is particularly sensitive to participant motion; thus, the acquisition of 2 spectra in each region greatly reduced the possibility of not having useable metabolite data because of brief movement during the scanning period. The peak area estimates from LCModel of Cr, Cho, Ino, NAA, and N-acetylaspartylglutamate (NAAG) were of interest for this study. Peak areas for NAA and NAAG metabolites were combined to quantify the total amount of N-acetyl aspartyl moieties (tNAA). tNAA metabolite ratios (tNAA/Cho, tNAA/Cr, tNAA/Ino) were derived for primary statistical analyses and Ino ratios (Ino/Cho, Ino/Cr) for secondary (exploratory) analyses. The final ratio in a region was the average of the ratios derived from the 2 scans in that region, when possible. Acquisition of 2 spectra permits averaging of small fluctuations in metabolite peak measures, and thereby arriving at more accurate results for that participant.
Statistical analyses
In addition to quality checking spectra as described above, Tukey's test was used to detect outliers in metabolite ratios that were subsequently removed from further analysis. Metabolite ratios were compared between ALS patients and healthy controls using linear regression after accounting for clustering within sites, and age and gender as covariates. Pearson correlations were performed to assess associations between participant metabolite ratios and clinical measures, namely ALSFRS-R, finger and foot tapping rate, disease progression rate, verbal fluency, and digit span. Statistical analyses were performed on MedCalc Statistical Software version 17.6 (MedCalc Software bvba, Ostend, Belgium; www.medcalc.org; 2017) and linear regression was performed on Stata 14 SE. Statistical significance was accepted at p < 0.05 for all analyses.
Data availability
Anonymized data will be shared at the request of qualified investigators.
Results
Representative spectra from the motor and prefrontal are shown in the figure. With our quality assurance protocol, 5.9% of both motor and frontal spectra were rejected (21 spectra out of 354 for each region). Fifteen metabolite ratios identified as outliers were excluded from analysis. The number of participants were different in the metabolite-specific analyses after quality assurance assessments: motor tNAA/Cr (n = 106), tNAA/Cho (n = 101), tNAA/Ino (n = 89), and frontal tNAA/Cr (n = 100), tNAA/Cho (n = 100), tNAA/Ino (n = 92).
Reproducibility
Metabolite ratio data acquired from the traveling head phantoms revealed that for a single individual, intrasite reproducibility was within 3.0% for the motor region and 5.1% for the prefrontal region while intersite reproducibility was very similar at 2.9% for the motor region and 5.2% for the prefrontal region. Thus, there was excellent congruence between site and across site data.
Group differences
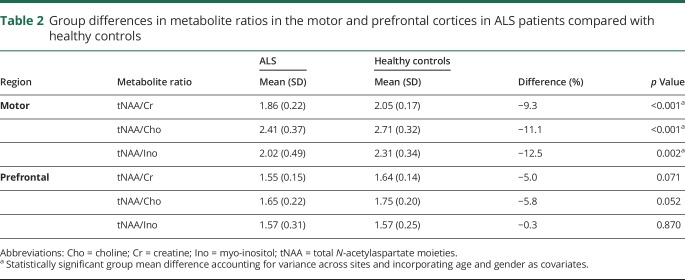
In the motor cortex, tNAA ratios were reduced by 9%–12% in the ALS group, with all reaching statistical significance: NAA/Cr (p < 0.001), NAA/Cho (p < 0.001), NAA/Ino (p = 0.002) as shown in table 2. There were no significant group differences in the motor cortex for Ino/Cr and Ino/Cho ratios between patients with ALS and healthy controls. In the prefrontal cortex, tNAA/Cr and tNAA/Cho were reduced by 5% and 6%, respectively, in patients with ALS and approached but did not reach statistical significance (table 2). There were no differences observed between patients with limb or bulbar site of onset.
Table 2.
Group differences in metabolite ratios in the motor and prefrontal cortices in ALS patients compared with healthy controls
Correlations
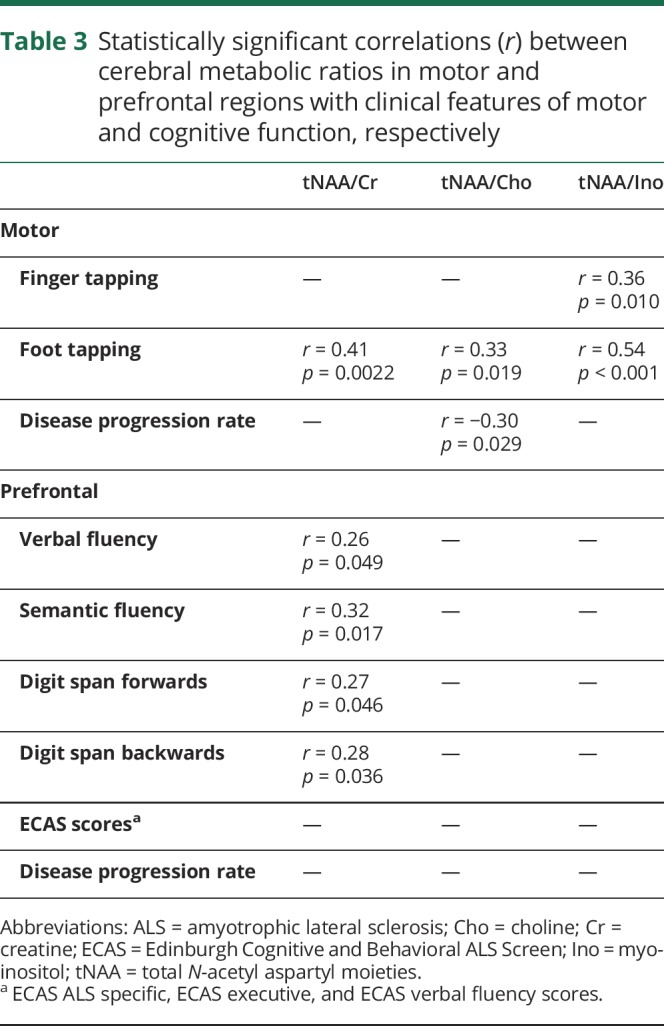
Lower motor tNAA ratios for ALS patients were associated with reduced foot tapping rate (table 3). Lower motor tNAA/Ino was associated with reduced finger tapping rate as well. Higher disease progression rate was associated with lower motor tNAA/Cho. Decreased prefrontal tNAA/Cr ratio was associated with lower verbal fluency, semantic fluency, and digit span (forwards and backwards). There was no correlation with ALSFRS-R or symptom duration.
Table 3.
Statistically significant correlations (r) between cerebral metabolic ratios in motor and prefrontal regions with clinical features of motor and cognitive function, respectively
Discussion
The objective of this study was to investigate cerebral degeneration in patients with ALS using MRS. The focus was on regions that contribute to the major clinical manifestations of ALS, notably motor impairment because of the involvement of the motor cortex and cognitive impairment because of the involvement of the prefrontal cortex. These 2 specific regions of interest were selected based on encouraging results from our previous studies, which measured NAA/Ino in ALS populations.6,16 Compared with the single-center studies reported to date, this work was a prospective multicenter study wherein participants underwent a clinical and neuroimaging protocol that was harmonized across all sites.
As hypothesized, tNAA ratios in the motor region were lower in ALS, indicative of impaired neuronal integrity in the motor cortex and subjacent white matter. These findings parallel those of previous single-center MRS studies demonstrating abnormal metabolites in this same region, including reductions in tNAA concentration20,21 or of its ratios: NAA/Cr,2,9,22 NAA/Cho,8,23 and NAA/Ino.6,24 As in our previous study,6 we found that the magnitude of change in tNAA ratios was lowest with Ino. We found mild reductions in tNAA/Cr and tNAA/Cho ratios in the prefrontal cortex; however, these did not reach statistical significance. This confirms in vivo the gradation of cerebral pathology in ALS, with more severe degeneration in the motor cortex compared with extramotor regions.25,26
In our previous single-center study, we did find a statistically significant reduction of NAA/Ino in the mesial prefrontal cortex.16 This discrepancy could be because of heterogeneity in the patient populations with respect to involvement of extramotor regions; indeed, one study has reported pathological heterogeneity even within the primary motor cortex with motor neuron density in gray and white matter varying between end-stage ALS patients.27 Technical factors influencing the accuracy of metabolite quantification is also to be considered because frontal lobe spectra are more liable to be of lower quality due to issues such as shimming performance and a greater detrimental effect of head motion in this region. The present study attempted to mitigate the latter by acquiring 2 spectra from each region (in case one is not useable) and by employing strict quality control procedures. The comparable standard deviations of metabolite ratios between prefrontal and motor regions, and similarly, the rejection of a low number of spectra from each region suggest that a discrepancy in quality of spectral quantification was not an important factor in the results reported here.
Besides the study by Usman et al.,16 there has been only one other study that evaluated mesial prefrontal cortex metabolites using MRS in ALS.28 Direct comparison is not possible with the latter as their statistical analysis evaluated patients dichotomized according to site of onset: those with bulbar onset (n = 5) had reduced NAA/Cr, whereas in patients with limb onset (n = 8), it was normal. A comparable region, the dorsolateral prefrontal cortex, has been evaluated and found to have reduced NAA/Cr in patients with impaired verbal fluency.15 However, an analysis of prefrontal cortex metabolites between patients and healthy controls was not performed as the study did not include healthy controls. Overall, mesial prefrontal cortex spectroscopy does not appear to be a useful diagnostic tool with respect to distinguishing patients from healthy controls. It may be useful to understand spatial distribution of pathology and in identifying ALS subgroups.
Clinical associations between metabolite ratios and measures of UMN dysfunction were also observed in the present work. Reduced motor cortex tNAA/Cr, tNAA/Cho, and tNAA/Ino ratios were associated with lower foot tapping rate, and reduced tNAA/Ino was associated with lower finger tapping rate. The more robust association with foot tapping may be attributed to the midline placement of the MRS voxel, which would have greater sampling of the lower limb than upper limb region on the motor homunculus. Reduced motor tNAA/Cho was associated with higher disease progression rate, indicating that greater cerebral degeneration is associated with faster progressing disease. Our findings are consistent with prior studies reporting clinical correlations of motor metabolites with finger tapping,4,7,11,24 foot tapping,24 and disease progression.8,24,29,30 Correlations with tapping rates provide a degree of clinical validation of the specificity of the metabolite findings to cerebral degeneration, as impaired tapping is a result of UMN dysfunction rather than weakness which is the result largely of LMN degeneration.33 While we did not find associations between metabolite ratios and symptom duration and ALSFRS-R, previous studies have indicated that reduced ratios were associated with longer disease duration8,30,31 and lower ALSFRS-R (greater disability).6,7,9,24,29,32 The lack of an association with the ALSFRS-R is not surprising given that disability is largely dependent on strength which in turn is largely dependent on LMN integrity in ALS.33
Exploration of correlations of frontal metabolite ratios revealed that lower tNAA/Cr ratio was associated with reduced executive function (verbal fluency and backwards digit span). Impaired fluency has consistently been reported as a feature of dysexecutive functioning in ALS.34 This association suggests MRS as a potential biomarker for identifying cognitive subgroups.
Cerebral metabolite changes measured using MRS have been documented in ALS studies with group sizes in the teens to mid-twenties. These studies have consistently shown reduced NAA ratios in the motor cortex and extramotor regions including the posterior limb of the internal capsule,4,22 brainstem,3 medulla oblongata,32 cingulate cortex,35 and mesial prefrontal cortex.16 There have been a few large-scale studies reported; however, they have all been retrospective in nature and conducted at single sites. One study of 164 patients reported correlations of NAA/Cr ratio with UMN signs; however, there was no healthy control group.36 Cervo et al.37 compared 84 ALS patients to a relatively small (n = 28) group of healthy controls and reported reduced NAA/(Cho + Cr) ratio in the motor cortex of patients. The present prospective study has aimed to address these limitations by examining a large cohort of both ALS patients and controls through a prospective multicenter approach and by using a harmonized clinical and radiological protocol.
This study has a number of limitations for which we propose mitigating strategies in future experiments. To address the heterogeneity of the ALS population, it would be preferable to conduct analysis on a more stratified cohort with over 30 patients and 30 healthy controls from each site. To explore the potential of MRS as a diagnostic marker for ALS, future studies should include disease controls such as progressive muscular atrophy, primary lateral sclerosis, and relevant neuropathies, such as multifocal motor neuropathy. Caution is required in the attribution of tapping rate to purely UMN integrity in the presence of significant LMN involvement, as the latter can manifest with marked weakness and fatigue; correcting or statistically modeling for the presence of both UMN and LMN signs should be considered. Although the variability between sites was small, future multicenter MRS studies may benefit from identifying an intersite correction measure.
Our review of the literature would suggest that there is no consensus yet on which metabolic marker or ratio is the best to distinguish between patients and controls or to correlate with UMN degeneration. However, we did replicate our prior study,6 which found motor tNAA/Ino ratio to have the largest decrease among the motor metabolite ratios and to have the strongest clinical correlation. Future studies should further evaluate this measure, including its sensitivity to disease progression, utility in subgrouping patients, and determining its pathological correlates.
In summary, this study demonstrates in vivo that cerebral degeneration in ALS is most profound in the motor cortex and less so in the mesial prefrontal cortex, that tNAA/Ino ratio remains a promising biomarker of degeneration and one that requires further evaluation. This study also demonstrates that a multicenter approach to prospective MRS studies in ALS is feasible.
Acknowledgment
Ojas Srivastava received stipend support from the Undergraduate Research Initiative at the University of Alberta and the Alberta Innovates Health Solutions Summer Studentship. David Costa, Ruby Endre, Ronaldo Lopez, Cheryl R. McCreary, Peter Seres, and Fred Tam are acknowledged for their expertise in MR data collection. Data management and quality control was facilitated by the Canadian Neuromuscular Disease Registry.
Appendix. Authors


Study funding
This study was funded by the Canadian Institutes of Health Research (CIHR).
Disclosure
The authors report no disclosures relevant to the manuscript. Full disclosure form information provided by the authors is available with the full text of this article at Neurology.org/cp.
References
- 1.Brand A, Richter-Landsberg C, Leibfritz D. Multinuclear NMR studies on the energy metabolism of glial and neuronal cells. Dev Neurosci 1993;15:289–298. [DOI] [PubMed] [Google Scholar]
- 2.Pioro EP, Antel JP, Cashman NR, Arnold DL. Detection of cortical neuron loss in motor neuron disease by proton magnetic resonance spectroscopic imaging in vivo. Neurology 1994;44:1933–1938. [DOI] [PubMed] [Google Scholar]
- 3.Cwik VA, Hanstock CC, Allen PS, Martin WR. Estimation of brainstem neuronal loss in amyotrophic lateral sclerosis with in vivo proton magnetic resonance spectroscopy. Neurology 1998;50:72–77. [DOI] [PubMed] [Google Scholar]
- 4.Rooney WD, Miller RG, Gelinas D, Schuff N, Maudsley AA, Weiner MW. Decreased N-acetylaspartate in motor cortex and corticospinal tract in ALS. Neurology 1998;50:1800–1805. [DOI] [PubMed] [Google Scholar]
- 5.Hanstock CC, Cwik VA, Martin WRW. Reduction in metabolite transverse relaxation times in amyotrophic lateral sclerosis. J Neurol Sci 2002;198:37–41. [DOI] [PubMed] [Google Scholar]
- 6.Kalra S, Vitale A, Cashman NR, Genge A, Arnold DL. Cerebral degeneration predicts survival in amyotrophic lateral sclerosis. J Neurol Neurosurg Psychiatry 2006;77:1253–1255. [DOI] [PMC free article] [PubMed] [Google Scholar]
- 7.Mitsumoto H, Uluğ A, Pullman S, et al. Quantitative objective markers for upper and lower motor neuron dysfunction in ALS. Neurology 2007;68:1402–1410. [DOI] [PubMed] [Google Scholar]
- 8.Pyra T, Hui B, Hanstock C, et al. Combined structural and neurochemical evaluation of the corticospinal tract in amyotrophic lateral sclerosis. Amyotroph Lat Scler 2010;11:157–165. [DOI] [PubMed] [Google Scholar]
- 9.Sivák Š, Bittšanský M, Kurča E, et al. Proton magnetic resonance spectroscopy in patients with early stages of amyotrophic lateral sclerosis. Neuroradiology 2010;52:1079–1085. [DOI] [PubMed] [Google Scholar]
- 10.Unrath A, Ludolph AC, Kassubek J. Brain metabolites in definite amyotrophic lateral sclerosis. J Neurol 2007;254:1099–1106. [DOI] [PubMed] [Google Scholar]
- 11.Wang Y, Li X, Chen W, et al. Detecting neuronal dysfunction of hand motor cortex in ALS: a MRSI study. Somatosens Mot Res 2017;34:15–20. [DOI] [PubMed] [Google Scholar]
- 12.Rule R, Suhy J, Schuff N, Gelinas D, Miller R, Weiner M. Reduced NAA in motor and non-motor brain regions in amyotrophic lateral sclerosis: a cross-sectional and longitudinal study. Amyotroph Lateral Sclerosis Other Motor Neuron Disord 2004;5:141–149. [DOI] [PMC free article] [PubMed] [Google Scholar]
- 13.Phukan J, Elamin M, Bede P, et al. The syndrome of cognitive impairment in amyotrophic lateral sclerosis: a population-based study. J Neurol Neurosurg Psychiatry 2012;83:102–108. [DOI] [PubMed] [Google Scholar]
- 14.Abe K, Takanashi M, Watanabe Y, et al. Decrease in N-acetylaspartate/creatine ratio in the motor area and the frontal lobe in amyotrophic lateral sclerosis. Neuroradiology 2001;43:537–541. [DOI] [PubMed] [Google Scholar]
- 15.Quinn C, Elman L, McCluskey L, et al. Frontal lobe abnormalities on MRS correlate with poor letter fluency in ALS. Neurology 2012;79:583–588. [DOI] [PMC free article] [PubMed] [Google Scholar]
- 16.Usman U, Choi C, Camicioli R, et al. Mesial prefrontal cortex degeneration in amyotrophic lateral sclerosis: a high-field proton MR spectroscopy study. AJNR Am J Neuroradiol 2011;32:1677–1680. [DOI] [PMC free article] [PubMed] [Google Scholar]
- 17.Brooks BR, Miller RG, Swash M, Munsat TL. El Escorial revisited: revised criteria for the diagnosis of amyotrophic lateral sclerosis. Amyotroph Lateral Sclerosis Other Motor Neuron Disord 2000;1:293–299. [DOI] [PubMed] [Google Scholar]
- 18.Borkowski JG, Benton AL, Spreen O. Word fluency and brain damage. Neuropsychologia 1967;5:135–140. [Google Scholar]
- 19.Provencher SW. Estimation of metabolite concentrations from localized in vivo proton NMR spectra. Magn Reson Med 1993;30:672–679. [DOI] [PubMed] [Google Scholar]
- 20.Schuff N, Rooney WD, Miller R, et al. Reanalysis of multislice (1)H MRSI in amyotrophic lateral sclerosis. Magn Reson Med 2001;45:513–516. [DOI] [PubMed] [Google Scholar]
- 21.Atassi N, Ratai E-, Greenblatt DJ, et al. A phase I, pharmacokinetic, dosage escalation study of creatine monohydrate in subjects with amyotrophic lateral sclerosis. Amyotroph Lat Scler 2010;11:508–513. [DOI] [PMC free article] [PubMed] [Google Scholar]
- 22.Han J, Ma L. Study of the features of proton MR spectroscopy (1H-MRS) on amyotrophic lateral sclerosis. J Magn Reson Imaging 2010;31:305–308. [DOI] [PubMed] [Google Scholar]
- 23.Vora M, Kumar S, Sharma S, Sharma S, Makhaik S, Sood RG. Advanced magnetic resonance neuroimaging in bulbar and limb onset early amyotrophic lateral sclerosis. J Neurosci Rural Pract 2016;7:102–108. [DOI] [PMC free article] [PubMed] [Google Scholar]
- 24.van der Graaff MM, Lavini C, Akkerman EM, et al. MR spectroscopy findings in early stages of motor neuron disease. AJNR Am J Neuroradiol 2010;31:1799–1806. [DOI] [PMC free article] [PubMed] [Google Scholar]
- 25.Braak H, Brettschneider J, Ludolph AC, Lee VM, Trojanowski JQ, Del Tredici K. Amyotrophic lateral sclerosis—a model of corticofugal axonal spread. Nat Rev Neurol 2013;9:708. [DOI] [PMC free article] [PubMed] [Google Scholar]
- 26.Brettschneider J, Del Tredici K, Toledo JB, et al. Stages of pTDP-43 pathology in amyotrophic lateral sclerosis. Ann Neurol 2013;74:20–38. [DOI] [PMC free article] [PubMed] [Google Scholar]
- 27.Chen J, Kostenko V, Pioro EP, Trapp BD. MR imaging–based estimation of upper motor neuron density in patients with amyotrophic lateral sclerosis: a feasibility study. Radiology 2018;287:955–964. [DOI] [PMC free article] [PubMed] [Google Scholar]
- 28.Strong MJ, Grace GM, Orange JB, Leeper HA, Menon RS, Aere C. A prospective study of cognitive impairment in ALS. Neurology 1999;53:1665–1670. [DOI] [PubMed] [Google Scholar]
- 29.Atassi N, Xu M, Triantafyllou C, et al. Ultra high-field (7tesla) magnetic resonance spectroscopy in Amyotrophic Lateral Sclerosis. PLoS One 2017;12:e0177680. [DOI] [PMC free article] [PubMed] [Google Scholar]
- 30.Pohl C, Block W, Karitzky J, et al. Proton magnetic resonance spectroscopy of the motor cortex in 70 patients with amyotrophic lateral sclerosis. Arch Neurol 2001;58:729–735. [DOI] [PubMed] [Google Scholar]
- 31.Sako W, Abe T, Izumi Y, Harada M, Kaji R. The ratio of N-acetyl aspartate to glutamate correlates with disease duration of amyotrophic lateral sclerosis. J Clin Neurosci 2016;27:110–113. [DOI] [PubMed] [Google Scholar]
- 32.Pioro EP, Majors AW, Mitsumoto H, Nelson DR, Ng TC. 1H-MRS evidence of neurodegeneration and excess glutamate + glutamine in ALS medulla. Neurology 1999;53:71–79. [DOI] [PubMed] [Google Scholar]
- 33.Kent-Braun JA, Walker CH, Weiner MW, Miller RG. Functional significance of upper and lower motor neuron impairment in amyotrophic lateral sclerosis. Muscle Nerve 1998;21:762–768. [DOI] [PubMed] [Google Scholar]
- 34.Strong MJ, Abrahams S, Goldstein LH, et al. Amyotrophic lateral sclerosis: frontotemporal spectrum disorder (ALS-FTSD): revised diagnostic criteria. Amyotroph Lateral Scler Frontotemporal Degener 2017;18:153–174. [DOI] [PMC free article] [PubMed] [Google Scholar]
- 35.Sudharshan N, Hanstock C, Hui B, Pyra T, Johnston W, Kalra S. Degeneration of the mid-cingulate cortex in amyotrophic lateral sclerosis detected in vivo with MR spectroscopy. AJNR Am J Neuroradiol 2011;32:403–407. [DOI] [PMC free article] [PubMed] [Google Scholar]
- 36.Kaufmann P, Pullman SL, Shungu DC, et al. Objective tests for upper motor neuron involvement in amyotrophic lateral sclerosis (ALS). Neurology 2004;62:1753–1757. [DOI] [PubMed] [Google Scholar]
- 37.Cervo A, Cocozza S, Saccà F, et al. The combined use of conventional MRI and MR spectroscopic imaging increases the diagnostic accuracy in amyotrophic lateral sclerosis. Eur J Radiol 2015;84:151–157. [DOI] [PubMed] [Google Scholar]
Associated Data
This section collects any data citations, data availability statements, or supplementary materials included in this article.
Data Availability Statement
Anonymized data will be shared at the request of qualified investigators.


